Qualicum Beach Airbnb Market Analysis 2025: Short Term Rental Data & Vacation Rental Statistics in British Columbia, Canada
Is Airbnb profitable in Qualicum Beach in 2025? Explore comprehensive Airbnb analytics for Qualicum Beach, British Columbia, Canada to uncover income potential. This 2025 STR market report for Qualicum Beach, based on AirROI data from April 2024 to March 2025, reveals key trends in the niche market of 65 active listings.
Whether you're considering an Airbnb investment in Qualicum Beach, optimizing your existing vacation rental, or exploring rental arbitrage opportunities, understanding the Qualicum Beach Airbnb data is crucial. Navigating the high regulation landscape is key to maximizing your short term rental income potential. Let's dive into the specifics.
Key Qualicum Beach Airbnb Performance Metrics Overview
Monthly Airbnb Revenue Variations & Income Potential in Qualicum Beach (2025)
Understanding the monthly revenue variations for Airbnb listings in Qualicum Beach is key to maximizing your short term rental income potential. Seasonality significantly impacts earnings. Our analysis, based on data from the past 12 months, shows that the peak revenue month for STRs in Qualicum Beach is typically August, while March often presents the lowest earnings, highlighting opportunities for strategic pricing adjustments during shoulder and low seasons. Explore the typical Airbnb income in Qualicum Beach across different performance tiers:
- Best-in-class properties (Top 10%) achieve $4,990+ monthly, often utilizing dynamic pricing and superior guest experiences.
- Strong performing properties (Top 25%) earn $3,133 or more, indicating effective management and desirable locations/amenities.
- Typical properties (Median) generate around $1,736 per month, representing the average market performance.
- Entry-level properties (Bottom 25%) see earnings around $882, often with potential for optimization.
Average Monthly Airbnb Earnings Trend in Qualicum Beach
Qualicum Beach Airbnb Occupancy Rate Trends (2025)
Maximize your bookings by understanding the Qualicum Beach STR occupancy trends. Seasonal demand shifts significantly influence how often properties are booked. Typically, Julysees the highest demand (peak season occupancy), while June experiences the lowest (low season). Effective strategies, like adjusting minimum stays or offering promotions, can boost occupancy during slower periods. Here's how different property tiers perform in Qualicum Beach:
- Best-in-class properties (Top 10%) achieve 81%+ occupancy, indicating high desirability and potentially optimized availability.
- Strong performing properties (Top 25%) maintain 60% or higher occupancy, suggesting good market fit and guest satisfaction.
- Typical properties (Median) have an occupancy rate around 37%.
- Entry-level properties (Bottom 25%) average 17% occupancy, potentially facing higher vacancy.
Average Monthly Occupancy Rate Trend in Qualicum Beach
Average Daily Rate (ADR) Airbnb Trends in Qualicum Beach (2025)
Effective short term rental pricing strategy in Qualicum Beach involves understanding monthly ADR fluctuations. The Average Daily Rate (ADR) for Airbnb in Qualicum Beach typically peaks in July and dips lowest during February. Leveraging Airbnb dynamic pricing tools or strategies based on this seasonality can significantly boost revenue. Here's a look at the typical nightly rates achieved:
- Best-in-class properties (Top 10%) command rates of $311+ per night, often due to premium features or locations.
- Strong performing properties (Top 25%) achieve nightly rates of $220 or more.
- Typical properties (Median) charge around $129 per night.
- Entry-level properties (Bottom 25%) earn around $98 per night.
Average Daily Rate (ADR) Trend by Month in Qualicum Beach
Get Live Qualicum Beach Market Intelligence 👇

Explore Real-time Analytics
Airbnb Seasonality Analysis & Trends in Qualicum Beach (2025)
Peak Season (August, July, May)
- Revenue averages $3,415 per month
- Occupancy rates average 52.0%
- Daily rates average $192
Shoulder Season
- Revenue averages $2,167 per month
- Occupancy maintains around 35.5%
- Daily rates hold near $178
Low Season (February, March, December)
- Revenue drops to average $1,571 per month
- Occupancy decreases to average 38.4%
- Daily rates adjust to average $159
Seasonality Insights for Qualicum Beach
- The Airbnb seasonality in Qualicum Beach shows highly seasonal trends requiring careful strategy. While the sections above show seasonal averages, it's also insightful to look at the extremes:
- During the high season, the absolute peak month showcases Qualicum Beach's highest earning potential, with monthly revenues capable of climbing to $3,750, occupancy reaching a high of 59.9%, and ADRs peaking at $195.
- Conversely, the slowest single month of the year, typically falling within the low season, marks the market's lowest point. In this month, revenue might dip to $1,433, occupancy could drop to 31.3%, and ADRs may adjust down to $157.
- Understanding both the seasonal averages and these monthly peaks and troughs in revenue, occupancy, and ADR is crucial for maximizing your Airbnb profit potential in Qualicum Beach.
Seasonal Strategies for Maximizing Profit
- Peak Season: Maximize revenue through premium pricing and potentially longer minimum stays. Ensure high availability.
- Low Season: Offer competitive pricing, special promotions (e.g., extended stay discounts), and flexible cancellation policies. Target off-season travelers like remote workers or budget-conscious guests.
- Shoulder Seasons: Implement dynamic pricing that balances peak and low rates. Target weekend travelers or specific events. Offer slightly more flexible terms than peak season.
- Regularly analyze your own performance against these Qualicum Beach seasonality benchmarks and adjust your pricing and availability strategy accordingly.
Best Areas for Airbnb Investment in Qualicum Beach (2025)
Exploring the top neighborhoods for short-term rentals in Qualicum Beach? This section highlights key areas, outlining why they are attractive for hosts and guests, along with notable local attractions. Consider these locations based on your target guest profile and investment strategy.
| Neighborhood / Area | Why Host Here? (Target Guests & Appeal) | Key Attractions & Landmarks |
|---|---|---|
| Qualicum Beach Village | Charming village atmosphere with local shops, restaurants, and easy access to the beach. Perfect for families and couples looking for a quaint getaway. | Qualicum Beach, Qualicum Beach Farmers Market, Milner Gardens & Woodland, Heritage Forest, The Old Schoolhouse Arts Centre |
| Beachfront | Direct access to the stunning Qualicum Beach, known for its beautiful sandy shoreline and picturesque sunsets. Ideal for those looking to enjoy beach activities and relaxation. | Beachfront Boardwalk, Public Beach Access, Qualicum Beach Fishing Pier, Parksville-Qualicum Beach Tourism |
| Bowser | A peaceful, scenic area that attracts nature lovers and outdoor enthusiasts. Close to parks and hiking trails, offering a tranquil escape from city life. | Bowser Provincial Park, Chipley Farm Market, Scenic Views of the Strait of Georgia |
| Nanaimo | Nearby urban center with vibrant city life. Popular with visitors who want to explore more than just the beach, with restaurants, shopping, and cultural experiences. | Nanaimo Harbour, Newcastle Island, Diverse dining options, Duncan Circus, Dolphin Cruises |
| Deep Bay | A serene area known for its marine activities and beautiful waterfront. Attracts visitors interested in kayaking, sailing, and marine wildlife. | Deep Bay Marina, Bailey's Chasm, Scenic Walks along the waterfront |
| Parksville | Famous for its sandy beaches and family-friendly attractions. Close proximity to Qualicum Beach makes it a favored choice for tourists. | Parksville Beach, Rathtrevor Beach Provincial Park, Parksville Community Park, Coombs Old Country Market |
| Mount Arrowsmith | Offers stunning views and great hiking opportunities. Popular with outdoor enthusiasts and those seeking tranquility in nature. | Mount Arrowsmith Trail, Hiking Routes, Scenic Viewing Points |
| Qualicum Bay | A quiet coastal area providing a relaxing environment with a close-knit community feel. Great for family vacations and fishing activities. | Qualicum Bay Marina, Fishing and Crabbing, Local Parks |
Understanding Airbnb License Requirements & STR Laws in Qualicum Beach (2025)
Yes, Qualicum Beach, British Columbia, Canada enforces high STR regulations. Obtaining a license and ensuring compliance is almost certainly required according to current 2025 STR laws. Always verify the latest short term rental regulations and Airbnb license requirements directly with local government authorities for Qualicum Beach to ensure full compliance before hosting.
(Source: AirROI data, 2025, based on 63% licensed listings)
Top Performing Airbnb Properties in Qualicum Beach (2025)
Benchmark your potential! Explore examples of top-performing Airbnb properties in Qualicum Beachbased on Trailing Twelve Month (TTM) revenue. Analyze their characteristics, revenue, occupancy rate, and ADR to understand what drives success in this market.
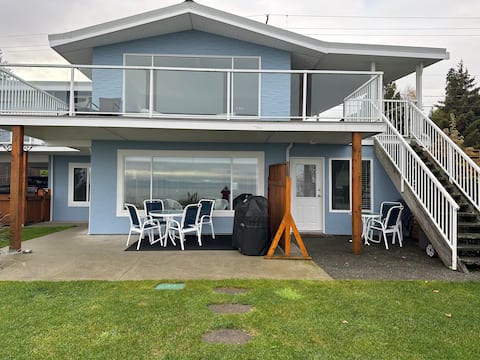
Walk on Oceanfront in Qualicum
Entire Place • 4 bedrooms
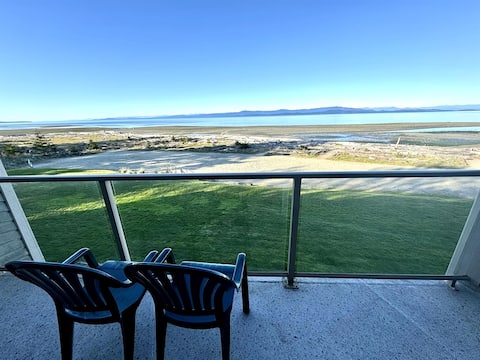
Shorewater Resort Deluxe Loft
Entire Place • 1 bedroom
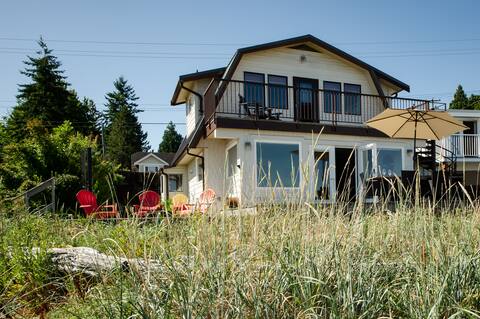
3-Bed house walk on waterfront. Perfect for family
Entire Place • 3 bedrooms
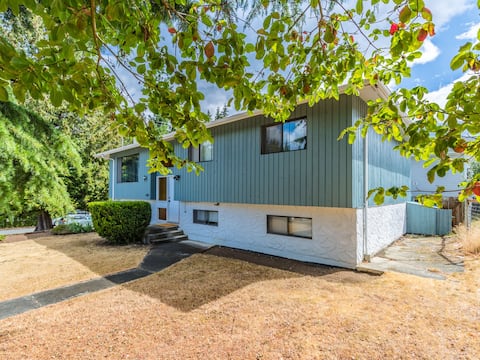
Downtown Gem: Private Pool Included!
Entire Place • 3 bedrooms

Eagleview Suite - Qualicum Beach Villa
Entire Place • 2 bedrooms
Seaspray Suite - Qualicum Beach Villa
Entire Place • 2 bedrooms
Note: Performance varies based on location, size, amenities, seasonality, and management quality. Data reflects the past 12 months.
Top Performing Airbnb Hosts in Qualicum Beach (2025)
Learn from the best! This table showcases top-performing Airbnb hosts in Qualicum Beach based on the number of properties managed and estimated total revenue over the past year. Analyze their scale and performance metrics.
| Host Name | Properties | Grossing Revenue | Stay Reviews | Avg Rating |
|---|---|---|---|---|
| Tina | 3 | $148,558 | 217 | 4.89/5.0 |
| Qualicum Beach | 8 | $120,704 | 119 | 4.86/5.0 |
| Tara | 4 | $119,171 | 51 | 4.86/5.0 |
| Mischa | 2 | $102,067 | 65 | 4.97/5.0 |
| Georgina | 1 | $57,007 | 82 | 4.94/5.0 |
| Host #145033708 | 1 | $54,753 | 20 | 4.65/5.0 |
| Wyatt | 3 | $53,979 | 177 | 4.74/5.0 |
| Ladda | 4 | $50,849 | 50 | 4.96/5.0 |
| Regan | 1 | $42,864 | 49 | 4.94/5.0 |
| Dana | 1 | $42,414 | 52 | 5.00/5.0 |
Analyzing the strategies of top hosts, such as their property selection, pricing, and guest communication, can offer valuable lessons for optimizing your own Airbnb operations in Qualicum Beach.
Dive Deeper: Advanced Qualicum Beach STR Market Data (2025)
Ready to unlock more insights? AirROI provides access to advanced metrics and comprehensive Airbnb data for Qualicum Beach. Explore detailed analytics beyond this report to refine your investment strategy, optimize pricing, and maximize your vacation rental profits.
Explore Advanced MetricsQualicum Beach Short-Term Rental Market Composition (2025): Property & Room Types
Room Type Distribution
Property Type Distribution
Market Composition Insights for Qualicum Beach
- The Qualicum Beach Airbnb market composition is heavily skewed towards Entire Home/Apt listings, which make up 78.5% of the 65 active rentals. This indicates strong guest preference for privacy and space.
- Looking at the property type distribution in Qualicum Beach, House properties are the most common (30.8%), reflecting the local real estate landscape.
- Houses represent a significant 30.8% portion, catering likely to families or larger groups.
- The presence of 24.6% Hotel/Boutique listings indicates integration with traditional hospitality.
Qualicum Beach Airbnb Room Capacity Analysis (2025): Bedroom Distribution
Distribution of Listings by Number of Bedrooms
Room Capacity Insights for Qualicum Beach
- The dominant room capacity in Qualicum Beach is 1 bedroom listings, making up 41.5% of the market. This suggests a strong demand for properties suitable for couples or solo travelers.
- Together, 1 bedroom and 2 bedrooms properties represent 64.6% of the active Airbnb listings in Qualicum Beach, indicating a high concentration in these sizes.
Qualicum Beach Vacation Rental Guest Capacity Trends (2025)
Distribution of Listings by Guest Capacity
Guest Capacity Insights for Qualicum Beach
- The most common guest capacity trend in Qualicum Beach vacation rentals is listings accommodating 4 guests (33.8%). This suggests the primary traveler segment is likely small families or groups.
- Properties designed for 4 guests and 2 guests dominate the Qualicum Beach STR market, accounting for 61.5% of listings.
- 15.4% of properties accommodate 6+ guests, serving the market segment for larger families or group travel in Qualicum Beach.
- On average, properties in Qualicum Beach are equipped to host 3.4 guests.
Qualicum Beach Airbnb Booking Patterns (2025): Available vs. Booked Days
Available Days Distribution
Booked Days Distribution
Booking Pattern Insights for Qualicum Beach
- The most common availability pattern in Qualicum Beach falls within the 271-366 days range, representing 38.5% of listings. This suggests many properties have significant open periods on their calendars.
- Approximately 70.8% of listings show high availability (181+ days open annually), indicating potential for increased bookings or specific owner usage patterns.
- For booked days, the 91-180 days range is most frequent in Qualicum Beach (32.3%), reflecting common guest stay durations or potential owner blocking patterns.
- A notable 29.3% of properties secure long booking periods (181+ days booked per year), highlighting successful long-term rental strategies or significant owner usage.
Qualicum Beach Airbnb Minimum Stay Requirements Analysis
Distribution of Listings by Minimum Night Requirement
1 Night
18 listings
30% of total
2 Nights
19 listings
31.7% of total
3 Nights
4 listings
6.7% of total
4-6 Nights
4 listings
6.7% of total
7-29 Nights
1 listings
1.7% of total
30+ Nights
14 listings
23.3% of total
Key Insights
- The most prevalent minimum stay requirement in Qualicum Beach is 2 Nights, adopted by 31.7% of listings. This highlights the market's preference for shorter, flexible bookings.
- A strong majority (61.7%) of the Qualicum Beach Airbnb data shows acceptance of very short stays (1-2 nights), indicating a dynamic, high-turnover market.
- A significant segment (23.3%) caters to monthly stays (30+ nights) in Qualicum Beach, pointing to opportunities in the extended-stay market.
Recommendations
- Align with the market by considering a 2 Nights minimum stay, as 31.7% of Qualicum Beach hosts use this setting.
- Explore offering discounts for stays of 30+ nights to attract the 23.3% of the market seeking extended stays.
- Adjust minimum nights based on seasonality – potentially shorter during low season and longer during peak demand periods in Qualicum Beach.
Qualicum Beach Airbnb Cancellation Policy Trends Analysis (2025)
Flexible
8 listings
13.3% of total
Moderate
20 listings
33.3% of total
Firm
17 listings
28.3% of total
Strict
15 listings
25% of total
Cancellation Policy Insights for Qualicum Beach
- The prevailing Airbnb cancellation policy trend in Qualicum Beach is Moderate, used by 33.3% of listings.
- A majority (53.3%) of hosts in Qualicum Beach utilize Firm or Strict policies, indicating a market where hosts prioritize booking security.
Recommendations for Hosts
- Consider adopting a Moderate policy to align with the 33.3% market standard in Qualicum Beach.
- Regularly review your cancellation policy against competitors and market demand shifts in Qualicum Beach.
Qualicum Beach STR Booking Lead Time Analysis (2025)
Average Booking Lead Time by Month
Booking Lead Time Insights for Qualicum Beach
- The overall average booking lead time for vacation rentals in Qualicum Beach is 67 days.
- Guests book furthest in advance for stays during July (average 139 days), likely coinciding with peak travel demand or local events.
- The shortest booking windows occur for stays in March (average 31 days), indicating more last-minute travel plans during this time.
- Seasonally, Summer (117 days avg.) sees the longest lead times, while Winter (40 days avg.) has the shortest, reflecting typical travel planning cycles.
Recommendations for Hosts
- Use the overall average lead time (67 days) as a baseline for your pricing and availability strategy in Qualicum Beach.
- For July stays, consider implementing length-of-stay discounts or slightly higher rates for bookings made less than 139 days out to capitalize on advance planning.
- Target marketing efforts for the Summer season well in advance (at least 117 days) to capture early planners.
- Monitor your own booking lead times against these Qualicum Beach averages to identify opportunities for dynamic pricing adjustments.
Popular & Essential Airbnb Amenities in Qualicum Beach (2025)
Amenity Prevalence
Amenity Insights for Qualicum Beach
- Essential amenities in Qualicum Beach that guests expect include: Wifi, Free parking on premises, Heating, Smoke alarm. Lacking these (any) could significantly impact bookings.
- Popular amenities like TV, Fire extinguisher, Essentials are common but not universal. Offering these can provide a competitive edge.
Recommendations for Hosts
- Ensure your listing includes all essential amenities for Qualicum Beach: Wifi, Free parking on premises, Heating, Smoke alarm.
- Prioritize adding missing essentials: Free parking on premises, Heating, Smoke alarm.
- Consider adding popular differentiators like TV or Fire extinguisher to increase appeal.
- Highlight unique or less common amenities you offer (e.g., hot tub, dedicated workspace, EV charger) in your listing description and photos.
- Regularly check competitor amenities in Qualicum Beach to stay competitive.
Qualicum Beach Airbnb Guest Demographics & Profile Analysis (2025)
Guest Profile Summary for Qualicum Beach
- The typical guest profile for Airbnb in Qualicum Beach consists of primarily domestic travelers (80%), often arriving from nearby Vancouver, typically belonging to the Post-2000s (Gen Z/Alpha) group (50%), primarily speaking English or French.
- Domestic travelers account for 79.7% of guests.
- Key international markets include Canada (79.7%) and United States (11.2%).
- Top languages spoken are English (70.3%) followed by French (13.6%).
- A significant demographic segment is the Post-2000s (Gen Z/Alpha) group, representing 50% of guests.
Recommendations for Hosts
- Target domestic marketing efforts towards travelers from Vancouver and Victoria.
- Tailor amenities and listing descriptions to appeal to the dominant Post-2000s (Gen Z/Alpha) demographic (e.g., highlight fast WiFi, smart home features, local guides).
- Highlight unique local experiences or amenities relevant to the primary guest profile.
- Consider seasonal promotions aligned with peak travel times for key origin markets.
Nearby Short-Term Rental Market Comparison
How does the Qualicum Beach Airbnb market stack up against its neighbors? Compare key performance metrics like average monthly revenue, ADR, and occupancy rates in surrounding areas to understand the broader regional STR landscape.
| Market | Active Properties | Monthly Revenue | Daily Rate | Avg. Occupancy |
|---|---|---|---|---|
| Tofino | 331 | $4,937 | $285.11 | 57% |
| Friday Harbor | 219 | $4,187 | $371.96 | 45% |
| Ucluelet | 344 | $3,256 | $221.35 | 51% |
| Beaver | 14 | $3,205 | $245.01 | 54% |
| Area D (Elaho/Garibaldi) | 46 | $3,163 | $248.45 | 48% |
| Sekiu | 35 | $3,138 | $235.66 | 49% |
| Clallam Bay | 11 | $3,072 | $211.28 | 58% |
| Juan de Fuca Electoral Area | 300 | $3,025 | $226.57 | 48% |
| Sequim | 311 | $3,018 | $227.21 | 51% |
| Bowen Island Municipality | 134 | $2,987 | $207.24 | 58% |