Prince George Airbnb Market Analysis 2025: Short Term Rental Data & Vacation Rental Statistics in British Columbia, Canada
Is Airbnb profitable in Prince George in 2025? Explore comprehensive Airbnb analytics for Prince George, British Columbia, Canada to uncover income potential. This 2025 STR market report for Prince George, based on AirROI data from April 2024 to March 2025, reveals key trends in the niche market of 177 active listings.
Whether you're considering an Airbnb investment in Prince George, optimizing your existing vacation rental, or exploring rental arbitrage opportunities, understanding the Prince George Airbnb data is crucial. Leveraging the low regulation environment is key to maximizing your short term rental income potential. Let's dive into the specifics.
Key Prince George Airbnb Performance Metrics Overview
Monthly Airbnb Revenue Variations & Income Potential in Prince George (2025)
Understanding the monthly revenue variations for Airbnb listings in Prince George is key to maximizing your short term rental income potential. Seasonality significantly impacts earnings. Our analysis, based on data from the past 12 months, shows that the peak revenue month for STRs in Prince George is typically May, while March often presents the lowest earnings, highlighting opportunities for strategic pricing adjustments during shoulder and low seasons. Explore the typical Airbnb income in Prince George across different performance tiers:
- Best-in-class properties (Top 10%) achieve $2,728+ monthly, often utilizing dynamic pricing and superior guest experiences.
- Strong performing properties (Top 25%) earn $1,924 or more, indicating effective management and desirable locations/amenities.
- Typical properties (Median) generate around $1,347 per month, representing the average market performance.
- Entry-level properties (Bottom 25%) see earnings around $737, often with potential for optimization.
Average Monthly Airbnb Earnings Trend in Prince George
Prince George Airbnb Occupancy Rate Trends (2025)
Maximize your bookings by understanding the Prince George STR occupancy trends. Seasonal demand shifts significantly influence how often properties are booked. Typically, Novembersees the highest demand (peak season occupancy), while March experiences the lowest (low season). Effective strategies, like adjusting minimum stays or offering promotions, can boost occupancy during slower periods. Here's how different property tiers perform in Prince George:
- Best-in-class properties (Top 10%) achieve 89%+ occupancy, indicating high desirability and potentially optimized availability.
- Strong performing properties (Top 25%) maintain 75% or higher occupancy, suggesting good market fit and guest satisfaction.
- Typical properties (Median) have an occupancy rate around 54%.
- Entry-level properties (Bottom 25%) average 30% occupancy, potentially facing higher vacancy.
Average Monthly Occupancy Rate Trend in Prince George
Average Daily Rate (ADR) Airbnb Trends in Prince George (2025)
Effective short term rental pricing strategy in Prince George involves understanding monthly ADR fluctuations. The Average Daily Rate (ADR) for Airbnb in Prince George typically peaks in July and dips lowest during February. Leveraging Airbnb dynamic pricing tools or strategies based on this seasonality can significantly boost revenue. Here's a look at the typical nightly rates achieved:
- Best-in-class properties (Top 10%) command rates of $136+ per night, often due to premium features or locations.
- Strong performing properties (Top 25%) achieve nightly rates of $95 or more.
- Typical properties (Median) charge around $73 per night.
- Entry-level properties (Bottom 25%) earn around $58 per night.
Average Daily Rate (ADR) Trend by Month in Prince George
Get Live Prince George Market Intelligence 👇

Explore Real-time Analytics
Airbnb Seasonality Analysis & Trends in Prince George (2025)
Peak Season (May, June, July)
- Revenue averages $1,689 per month
- Occupancy rates average 53.8%
- Daily rates average $85
Shoulder Season
- Revenue averages $1,516 per month
- Occupancy maintains around 54.6%
- Daily rates hold near $84
Low Season (February, March, December)
- Revenue drops to average $1,185 per month
- Occupancy decreases to average 47.9%
- Daily rates adjust to average $80
Seasonality Insights for Prince George
- The Airbnb seasonality in Prince George shows moderate seasonality with distinct peak and low periods. While the sections above show seasonal averages, it's also insightful to look at the extremes:
- During the high season, the absolute peak month showcases Prince George's highest earning potential, with monthly revenues capable of climbing to $1,768, occupancy reaching a high of 58.6%, and ADRs peaking at $86.
- Conversely, the slowest single month of the year, typically falling within the low season, marks the market's lowest point. In this month, revenue might dip to $1,061, occupancy could drop to 43.9%, and ADRs may adjust down to $80.
- Understanding both the seasonal averages and these monthly peaks and troughs in revenue, occupancy, and ADR is crucial for maximizing your Airbnb profit potential in Prince George.
Seasonal Strategies for Maximizing Profit
- Peak Season: Maximize revenue through premium pricing and potentially longer minimum stays. Ensure high availability.
- Low Season: Offer competitive pricing, special promotions (e.g., extended stay discounts), and flexible cancellation policies. Target off-season travelers like remote workers or budget-conscious guests.
- Shoulder Seasons: Implement dynamic pricing that balances peak and low rates. Target weekend travelers or specific events. Offer slightly more flexible terms than peak season.
- Regularly analyze your own performance against these Prince George seasonality benchmarks and adjust your pricing and availability strategy accordingly.
Best Areas for Airbnb Investment in Prince George (2025)
Exploring the top neighborhoods for short-term rentals in Prince George? This section highlights key areas, outlining why they are attractive for hosts and guests, along with notable local attractions. Consider these locations based on your target guest profile and investment strategy.
| Neighborhood / Area | Why Host Here? (Target Guests & Appeal) | Key Attractions & Landmarks |
|---|---|---|
| Wood Innovation and Design Centre | A unique and environmentally friendly architectural marvel that serves as a hub for innovation and design. It attracts visitors interested in sustainable living and wood architecture. | Wood Innovation and Design Centre, Fort Georges Park, Two Rivers Gallery, Pine Centre Mall, Cultural Centre |
| Lheidli T'enneh Memorial Park | A picturesque park located along the river, perfect for outdoor activities. It’s a popular spot for locals and tourists looking to enjoy nature and recreation. | Lheidli T'enneh Memorial Park, Fraser River, Walking trails, Picnic areas, Playgrounds |
| Downtown Prince George | The vibrant heart of the city, filled with shops, dining, and nightlife. Ideal for travelers seeking urban amenities and local culture. | CN Centre, Theatre North West, Prince George Farmers Market, Local restaurants and cafes, Art Gallery |
| University of Northern British Columbia (UNBC) | A significant educational institution attracting students and visitors for events, conferences, and nature exploration due to its proximity to beautiful trails. | UNBC campus, Nature trails, Conference events, Research facilities, The Northern Sport Centre |
| Mackenzie Avenue | A main thoroughfare known for various retail and dining options. Popular with travelers looking for convenience and accessibility to city services. | Shopping centres, Local cafes, Dine-in restaurants, Cinema, Prince George Coliseum |
| Spruceland Mall | A locale popular for its shopping and dining, drawing shoppers from around the region. Great for visitors looking to combine leisure with convenience. | Spruceland Mall, Various retail stores, Dining options, Grocery stores, Beauty salons |
| Fort George Park | A beautiful park with scenic views and picnic spots. It attracts families and nature lovers, providing a peaceful retreat. | Fort George Park, Historical exhibits, Nature walks, Playgrounds, Community events |
| Ness Lake | A serene lake area popular for summer activities and cabin rentals. Attracts guests looking for a nature-centric experience with outdoor recreation. | Ness Lake, Canoeing and kayaking, Fishing spots, Hiking trails, Camping areas |
Understanding Airbnb License Requirements & STR Laws in Prince George (2025)
While Prince George, British Columbia, Canada currently shows low STR regulations, specific Airbnb license requirements might still exist or change. Always verify the latest short term rental regulations and Airbnb license requirements directly with local government authorities for Prince George to ensure full compliance before hosting.
(Source: AirROI data, 2025, based on 1% licensed listings)
Top Performing Airbnb Properties in Prince George (2025)
Benchmark your potential! Explore examples of top-performing Airbnb properties in Prince Georgebased on Trailing Twelve Month (TTM) revenue. Analyze their characteristics, revenue, occupancy rate, and ADR to understand what drives success in this market.
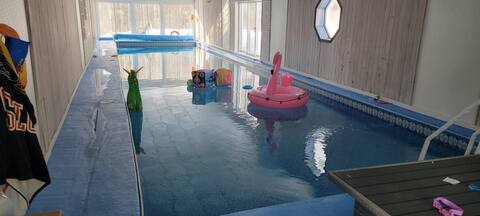
Indoor pool, hot tub, private acre, in the city!
Entire Place • 5 bedrooms
Relaxing at Ross
Entire Place • 3 bedrooms

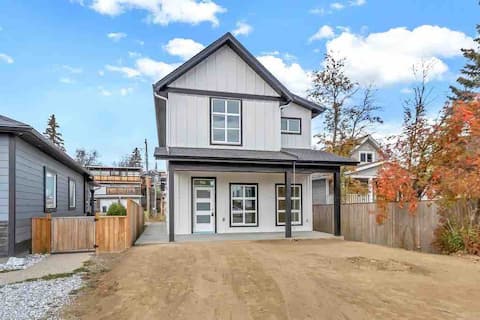
Inclusively Home - 6th ave House
Entire Place • 3 bedrooms

Stunning 2 bedroom riverfront guest house.
Entire Place • 2 bedrooms

Serene Forest Retreat with seasonal pool
Entire Place • 4 bedrooms
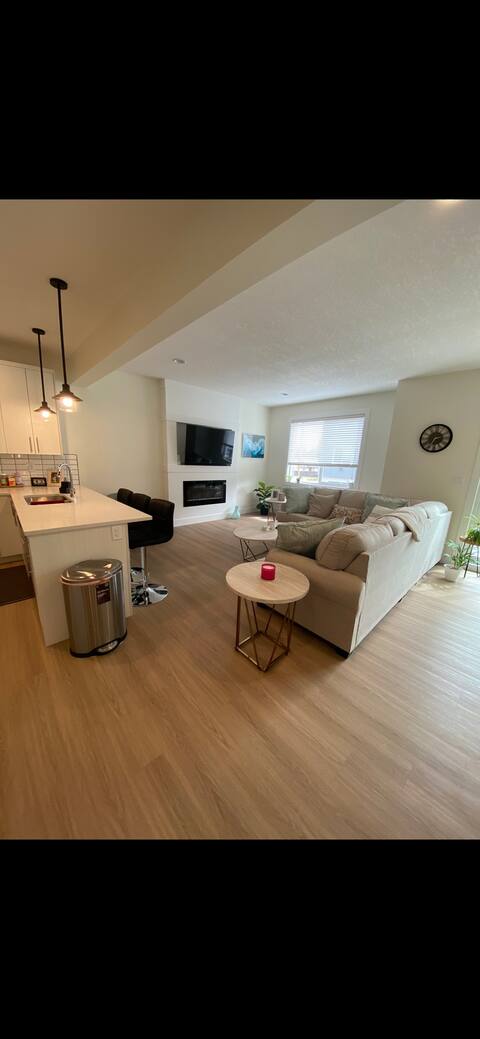
Brand new clean 2 bedroom & 2.5 bath townhouse!
Entire Place • 2 bedrooms
Note: Performance varies based on location, size, amenities, seasonality, and management quality. Data reflects the past 12 months.
Top Performing Airbnb Hosts in Prince George (2025)
Learn from the best! This table showcases top-performing Airbnb hosts in Prince George based on the number of properties managed and estimated total revenue over the past year. Analyze their scale and performance metrics.
| Host Name | Properties | Grossing Revenue | Stay Reviews | Avg Rating |
|---|---|---|---|---|
| Inclusively Home Admin | 8 | $185,454 | 228 | 4.90/5.0 |
| Jen | 3 | $66,626 | 190 | 4.78/5.0 |
| Heather | 1 | $62,301 | 114 | 4.95/5.0 |
| Jane | 3 | $55,980 | 160 | 4.96/5.0 |
| Katie | 2 | $53,809 | 20 | 4.96/5.0 |
| Louise | 3 | $49,642 | 219 | 4.98/5.0 |
| Toni | 1 | $48,840 | 24 | 4.88/5.0 |
| Landon | 1 | $42,537 | 126 | 4.96/5.0 |
| Julia | 1 | $34,281 | 15 | 4.80/5.0 |
| Fallon | 2 | $33,106 | 64 | 4.87/5.0 |
Analyzing the strategies of top hosts, such as their property selection, pricing, and guest communication, can offer valuable lessons for optimizing your own Airbnb operations in Prince George.
Dive Deeper: Advanced Prince George STR Market Data (2025)
Ready to unlock more insights? AirROI provides access to advanced metrics and comprehensive Airbnb data for Prince George. Explore detailed analytics beyond this report to refine your investment strategy, optimize pricing, and maximize your vacation rental profits.
Explore Advanced MetricsPrince George Short-Term Rental Market Composition (2025): Property & Room Types
Room Type Distribution
Property Type Distribution
Market Composition Insights for Prince George
- The Prince George Airbnb market composition is heavily skewed towards Entire Home/Apt listings, which make up 87% of the 177 active rentals. This indicates strong guest preference for privacy and space.
- Looking at the property type distribution in Prince George, House properties are the most common (54.2%), reflecting the local real estate landscape.
- Houses represent a significant 54.2% portion, catering likely to families or larger groups.
- The presence of 5.6% Hotel/Boutique listings indicates integration with traditional hospitality.
- Smaller segments like outdoor/unique (combined 0.6%) offer potential for unique stay experiences.
Prince George Airbnb Room Capacity Analysis (2025): Bedroom Distribution
Distribution of Listings by Number of Bedrooms
Room Capacity Insights for Prince George
- The dominant room capacity in Prince George is 1 bedroom listings, making up 45.8% of the market. This suggests a strong demand for properties suitable for couples or solo travelers.
- Together, 1 bedroom and 2 bedrooms properties represent 72.4% of the active Airbnb listings in Prince George, indicating a high concentration in these sizes.
Prince George Vacation Rental Guest Capacity Trends (2025)
Distribution of Listings by Guest Capacity
Guest Capacity Insights for Prince George
- The most common guest capacity trend in Prince George vacation rentals is listings accommodating 2 guests (31.6%). This suggests the primary traveler segment is likely couples or solo travelers.
- Properties designed for 2 guests and 4 guests dominate the Prince George STR market, accounting for 60.4% of listings.
- 18.7% of properties accommodate 6+ guests, serving the market segment for larger families or group travel in Prince George.
- On average, properties in Prince George are equipped to host 3.4 guests.
Prince George Airbnb Booking Patterns (2025): Available vs. Booked Days
Available Days Distribution
Booked Days Distribution
Booking Pattern Insights for Prince George
- The most common availability pattern in Prince George falls within the 271-366 days range, representing 35.6% of listings. This suggests many properties have significant open periods on their calendars.
- Approximately 67.2% of listings show high availability (181+ days open annually), indicating potential for increased bookings or specific owner usage patterns.
- For booked days, the 181-270 days range is most frequent in Prince George (27.7%), reflecting common guest stay durations or potential owner blocking patterns.
- A notable 36.7% of properties secure long booking periods (181+ days booked per year), highlighting successful long-term rental strategies or significant owner usage.
Prince George Airbnb Minimum Stay Requirements Analysis
Distribution of Listings by Minimum Night Requirement
1 Night
47 listings
31.8% of total
2 Nights
37 listings
25% of total
3 Nights
23 listings
15.5% of total
4-6 Nights
6 listings
4.1% of total
7-29 Nights
6 listings
4.1% of total
30+ Nights
29 listings
19.6% of total
Key Insights
- The most prevalent minimum stay requirement in Prince George is 1 Night, adopted by 31.8% of listings. This highlights the market's preference for shorter, flexible bookings.
- A significant segment (19.6%) caters to monthly stays (30+ nights) in Prince George, pointing to opportunities in the extended-stay market.
Recommendations
- Align with the market by considering a 1 Night minimum stay, as 31.8% of Prince George hosts use this setting.
- Explore offering discounts for stays of 30+ nights to attract the 19.6% of the market seeking extended stays.
- Adjust minimum nights based on seasonality – potentially shorter during low season and longer during peak demand periods in Prince George.
Prince George Airbnb Cancellation Policy Trends Analysis (2025)
Flexible
65 listings
43.6% of total
Moderate
39 listings
26.2% of total
Firm
26 listings
17.4% of total
Strict
19 listings
12.8% of total
Cancellation Policy Insights for Prince George
- The prevailing Airbnb cancellation policy trend in Prince George is Flexible, used by 43.6% of listings.
- There's a relatively balanced mix between guest-friendly (69.8%) and stricter (30.2%) policies, offering choices for different guest needs.
Recommendations for Hosts
- Consider adopting a Flexible policy to align with the 43.6% market standard in Prince George.
- Using a Strict policy might deter some guests, as only 12.8% of listings use it. Evaluate if potential revenue protection outweighs possible lower booking rates.
- Regularly review your cancellation policy against competitors and market demand shifts in Prince George.
Prince George STR Booking Lead Time Analysis (2025)
Average Booking Lead Time by Month
Booking Lead Time Insights for Prince George
- The overall average booking lead time for vacation rentals in Prince George is 32 days.
- Guests book furthest in advance for stays during July (average 49 days), likely coinciding with peak travel demand or local events.
- The shortest booking windows occur for stays in February (average 22 days), indicating more last-minute travel plans during this time.
- Seasonally, Summer (43 days avg.) sees the longest lead times, while Winter (27 days avg.) has the shortest, reflecting typical travel planning cycles.
Recommendations for Hosts
- Use the overall average lead time (32 days) as a baseline for your pricing and availability strategy in Prince George.
- For July stays, consider implementing length-of-stay discounts or slightly higher rates for bookings made less than 49 days out to capitalize on advance planning.
- Target marketing efforts for the Summer season well in advance (at least 43 days) to capture early planners.
- Monitor your own booking lead times against these Prince George averages to identify opportunities for dynamic pricing adjustments.
Popular & Essential Airbnb Amenities in Prince George (2025)
Amenity Prevalence
Amenity Insights for Prince George
- Essential amenities in Prince George that guests expect include: Wifi, Smoke alarm. Lacking these (any) could significantly impact bookings.
- Popular amenities like TV, Hot water, Heating are common but not universal. Offering these can provide a competitive edge.
Recommendations for Hosts
- Ensure your listing includes all essential amenities for Prince George: Wifi, Smoke alarm.
- Prioritize adding missing essentials: Smoke alarm.
- Consider adding popular differentiators like TV or Hot water to increase appeal.
- Highlight unique or less common amenities you offer (e.g., hot tub, dedicated workspace, EV charger) in your listing description and photos.
- Regularly check competitor amenities in Prince George to stay competitive.
Prince George Airbnb Guest Demographics & Profile Analysis (2025)
Guest Profile Summary for Prince George
- The typical guest profile for Airbnb in Prince George consists of primarily domestic travelers (89%), often arriving from nearby Vancouver, typically belonging to the Post-2000s (Gen Z/Alpha) group (50%), primarily speaking English or French.
- Domestic travelers account for 88.5% of guests.
- Key international markets include Canada (88.5%) and United States (6%).
- Top languages spoken are English (76.5%) followed by French (7%).
- A significant demographic segment is the Post-2000s (Gen Z/Alpha) group, representing 50% of guests.
Recommendations for Hosts
- Target domestic marketing efforts towards travelers from Vancouver and Prince George.
- Tailor amenities and listing descriptions to appeal to the dominant Post-2000s (Gen Z/Alpha) demographic (e.g., highlight fast WiFi, smart home features, local guides).
- Highlight unique local experiences or amenities relevant to the primary guest profile.
- Consider seasonal promotions aligned with peak travel times for key origin markets.
Nearby Short-Term Rental Market Comparison
How does the Prince George Airbnb market stack up against its neighbors? Compare key performance metrics like average monthly revenue, ADR, and occupancy rates in surrounding areas to understand the broader regional STR landscape.
| Market | Active Properties | Monthly Revenue | Daily Rate | Avg. Occupancy |
|---|---|---|---|---|
| Williams Lake | 14 | $1,277 | $78.91 | 57% |
| Area F (Horsefly/Likely/150 Mile House) | 18 | $961 | $106.43 | 43% |