Osoyoos Airbnb Market Analysis 2025: Short Term Rental Data & Vacation Rental Statistics in British Columbia, Canada
Is Airbnb profitable in Osoyoos in 2025? Explore comprehensive Airbnb analytics for Osoyoos, British Columbia, Canada to uncover income potential. This 2025 STR market report for Osoyoos, based on AirROI data from April 2024 to March 2025, reveals key trends in the niche market of 148 active listings.
Whether you're considering an Airbnb investment in Osoyoos, optimizing your existing vacation rental, or exploring rental arbitrage opportunities, understanding the Osoyoos Airbnb data is crucial. Leveraging the low regulation environment is key to maximizing your short term rental income potential. Let's dive into the specifics.
Key Osoyoos Airbnb Performance Metrics Overview
Monthly Airbnb Revenue Variations & Income Potential in Osoyoos (2025)
Understanding the monthly revenue variations for Airbnb listings in Osoyoos is key to maximizing your short term rental income potential. Seasonality significantly impacts earnings. Our analysis, based on data from the past 12 months, shows that the peak revenue month for STRs in Osoyoos is typically July, while February often presents the lowest earnings, highlighting opportunities for strategic pricing adjustments during shoulder and low seasons. Explore the typical Airbnb income in Osoyoos across different performance tiers:
- Best-in-class properties (Top 10%) achieve $5,392+ monthly, often utilizing dynamic pricing and superior guest experiences.
- Strong performing properties (Top 25%) earn $3,636 or more, indicating effective management and desirable locations/amenities.
- Typical properties (Median) generate around $2,035 per month, representing the average market performance.
- Entry-level properties (Bottom 25%) see earnings around $1,036, often with potential for optimization.
Average Monthly Airbnb Earnings Trend in Osoyoos
Osoyoos Airbnb Occupancy Rate Trends (2025)
Maximize your bookings by understanding the Osoyoos STR occupancy trends. Seasonal demand shifts significantly influence how often properties are booked. Typically, Julysees the highest demand (peak season occupancy), while February experiences the lowest (low season). Effective strategies, like adjusting minimum stays or offering promotions, can boost occupancy during slower periods. Here's how different property tiers perform in Osoyoos:
- Best-in-class properties (Top 10%) achieve 72%+ occupancy, indicating high desirability and potentially optimized availability.
- Strong performing properties (Top 25%) maintain 54% or higher occupancy, suggesting good market fit and guest satisfaction.
- Typical properties (Median) have an occupancy rate around 32%.
- Entry-level properties (Bottom 25%) average 17% occupancy, potentially facing higher vacancy.
Average Monthly Occupancy Rate Trend in Osoyoos
Average Daily Rate (ADR) Airbnb Trends in Osoyoos (2025)
Effective short term rental pricing strategy in Osoyoos involves understanding monthly ADR fluctuations. The Average Daily Rate (ADR) for Airbnb in Osoyoos typically peaks in July and dips lowest during December. Leveraging Airbnb dynamic pricing tools or strategies based on this seasonality can significantly boost revenue. Here's a look at the typical nightly rates achieved:
- Best-in-class properties (Top 10%) command rates of $360+ per night, often due to premium features or locations.
- Strong performing properties (Top 25%) achieve nightly rates of $273 or more.
- Typical properties (Median) charge around $196 per night.
- Entry-level properties (Bottom 25%) earn around $135 per night.
Average Daily Rate (ADR) Trend by Month in Osoyoos
Get Live Osoyoos Market Intelligence 👇

Explore Real-time Analytics
Airbnb Seasonality Analysis & Trends in Osoyoos (2025)
Peak Season (July, August, June)
- Revenue averages $4,547 per month
- Occupancy rates average 50.8%
- Daily rates average $255
Shoulder Season
- Revenue averages $2,320 per month
- Occupancy maintains around 37.1%
- Daily rates hold near $212
Low Season (January, February, March)
- Revenue drops to average $1,096 per month
- Occupancy decreases to average 24.1%
- Daily rates adjust to average $181
Seasonality Insights for Osoyoos
- The Airbnb seasonality in Osoyoos shows highly seasonal trends requiring careful strategy. While the sections above show seasonal averages, it's also insightful to look at the extremes:
- During the high season, the absolute peak month showcases Osoyoos's highest earning potential, with monthly revenues capable of climbing to $5,371, occupancy reaching a high of 61.1%, and ADRs peaking at $259.
- Conversely, the slowest single month of the year, typically falling within the low season, marks the market's lowest point. In this month, revenue might dip to $1,004, occupancy could drop to 22.5%, and ADRs may adjust down to $179.
- Understanding both the seasonal averages and these monthly peaks and troughs in revenue, occupancy, and ADR is crucial for maximizing your Airbnb profit potential in Osoyoos.
Seasonal Strategies for Maximizing Profit
- Peak Season: Maximize revenue through premium pricing and potentially longer minimum stays. Ensure high availability.
- Low Season: Offer competitive pricing, special promotions (e.g., extended stay discounts), and flexible cancellation policies. Target off-season travelers like remote workers or budget-conscious guests.
- Shoulder Seasons: Implement dynamic pricing that balances peak and low rates. Target weekend travelers or specific events. Offer slightly more flexible terms than peak season.
- Regularly analyze your own performance against these Osoyoos seasonality benchmarks and adjust your pricing and availability strategy accordingly.
Best Areas for Airbnb Investment in Osoyoos (2025)
Exploring the top neighborhoods for short-term rentals in Osoyoos? This section highlights key areas, outlining why they are attractive for hosts and guests, along with notable local attractions. Consider these locations based on your target guest profile and investment strategy.
| Neighborhood / Area | Why Host Here? (Target Guests & Appeal) | Key Attractions & Landmarks |
|---|---|---|
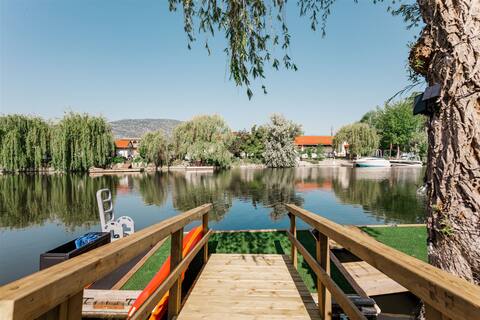
| South Osoyoos Beach | Beautiful sandy beaches and warm climate make this area highly desirable for tourists, particularly in summer. The beach is perfect for family fun and water activities. | Osoyoos Lake, Haynes Point Provincial Park, water sports rentals, Osoyoos Desert Centre, local wineries |
| Main Street Osoyoos | The heart of Osoyoos and a hub of local shops, restaurants, and attractions. It's a great spot for visitors who want to experience local culture and amenities. | Osoyoos Museum, local dining options, art galleries, Osoyoos Farmers Market, Coyote Cruises |
| Osoyoos Wine Country | A famous wine region with numerous wineries producing award-winning wines. This area attracts wine enthusiasts and tourists looking for vineyard experiences. | Nk'Mip Cellars, Osoyoos Larose, Wine tours, tasting rooms, beautiful vineyard views |
| Desert Centre Area | Unique geographic and ecological features attract nature lovers and those interested in education about the local desert environment. | Osoyoos Desert Centre, guided tours, nature trails, birdwatching, educational programs |
| Osoyoos Golf Course | The area is known for its beautiful golf courses that attract both golf enthusiasts and families seeking leisure activities. | Osoyoos Golf Club, Desert Golf Resort, scenic views, golf tournaments, family-friendly activities |
| Osoyoos Indian Band Area | Cultural experiences and opportunities to learn about Indigenous history and land. This area can attract visitors looking for authentic cultural experiences. | Cultural events, guided tours, art installations, Coyote Cruise operations, local heritage |
| Osoyoos Lake and River Area | Offering natural beauty, water sports, and relaxing beachside experiences. Great for families and outdoor activities. | water sports, fishing, picnics by the lake, swimming, Osoyoos Lake Marina |
| North Osoyoos | A quieter residential area close to nature, ideal for those seeking a more tranquil experience while still having access to the town's amenities. | nature trails, local parks, scenic views, close proximity to town, peaceful environment |
Understanding Airbnb License Requirements & STR Laws in Osoyoos (2025)
While Osoyoos, British Columbia, Canada currently shows low STR regulations, specific Airbnb license requirements might still exist or change. Always verify the latest short term rental regulations and Airbnb license requirements directly with local government authorities for Osoyoos to ensure full compliance before hosting.
(Source: AirROI data, 2025, finding no licensed listings among those analyzed)
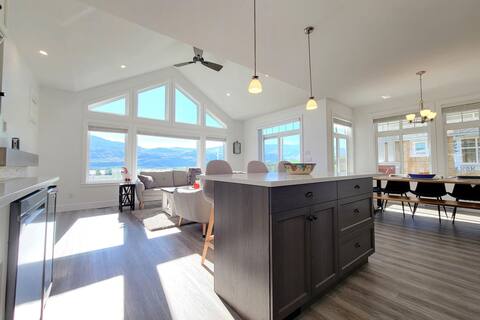
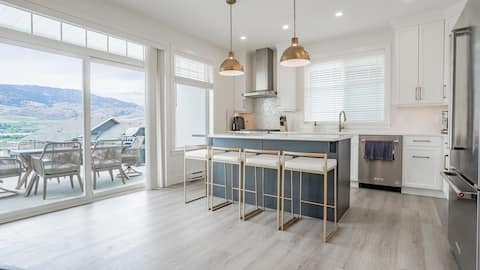
Top Performing Airbnb Properties in Osoyoos (2025)
Benchmark your potential! Explore examples of top-performing Airbnb properties in Osoyoosbased on Trailing Twelve Month (TTM) revenue. Analyze their characteristics, revenue, occupancy rate, and ADR to understand what drives success in this market.
The Lux Lakefront
Entire Place • 4 bedrooms

Blissfully Beachy Vacation Home at the Cottages
Entire Place • 4 bedrooms

The Lakehouse/Snow Vacation Rental
Entire Place • 3 bedrooms
Amazing views-golf cart #243
Entire Place • 4 bedrooms
The Great Osoyoos Escape
Entire Place • 4 bedrooms

The "B" Hive Cottage
Entire Place • 5 bedrooms
Note: Performance varies based on location, size, amenities, seasonality, and management quality. Data reflects the past 12 months.
Top Performing Airbnb Hosts in Osoyoos (2025)
Learn from the best! This table showcases top-performing Airbnb hosts in Osoyoos based on the number of properties managed and estimated total revenue over the past year. Analyze their scale and performance metrics.
| Host Name | Properties | Grossing Revenue | Stay Reviews | Avg Rating |
|---|---|---|---|---|
| John | 11 | $369,363 | 139 | 4.45/5.0 |
| DArcy | 21 | $344,381 | 114 | 3.76/5.0 |
| Diba And Arash | 1 | $78,132 | 17 | 4.71/5.0 |
| Annu | 2 | $70,306 | 21 | 4.92/5.0 |
| Romana | 2 | $69,636 | 13 | 5.00/5.0 |
| Sherry | 1 | $69,335 | 13 | 4.92/5.0 |
| Mario | 3 | $68,631 | 53 | 4.87/5.0 |
| Amanda | 3 | $66,595 | 6 | 1.67/5.0 |
| Justin | 1 | $63,102 | 24 | 4.92/5.0 |
| Noor | 4 | $51,482 | 34 | 3.29/5.0 |
Analyzing the strategies of top hosts, such as their property selection, pricing, and guest communication, can offer valuable lessons for optimizing your own Airbnb operations in Osoyoos.
Dive Deeper: Advanced Osoyoos STR Market Data (2025)
Ready to unlock more insights? AirROI provides access to advanced metrics and comprehensive Airbnb data for Osoyoos. Explore detailed analytics beyond this report to refine your investment strategy, optimize pricing, and maximize your vacation rental profits.
Explore Advanced MetricsOsoyoos Short-Term Rental Market Composition (2025): Property & Room Types
Room Type Distribution
Property Type Distribution
Market Composition Insights for Osoyoos
- The Osoyoos Airbnb market composition is heavily skewed towards Entire Home/Apt listings, which make up 98.6% of the 148 active rentals. This indicates strong guest preference for privacy and space.
- Looking at the property type distribution in Osoyoos, House properties are the most common (61.5%), reflecting the local real estate landscape.
- Houses represent a significant 61.5% portion, catering likely to families or larger groups.
- Smaller segments like outdoor/unique, hotel/boutique (combined 6.1%) offer potential for unique stay experiences.
Osoyoos Airbnb Room Capacity Analysis (2025): Bedroom Distribution
Distribution of Listings by Number of Bedrooms
Room Capacity Insights for Osoyoos
- The dominant room capacity in Osoyoos is 3 bedrooms listings, making up 37.2% of the market. This suggests a strong demand for properties suitable for families or small groups.
- Together, 3 bedrooms and 2 bedrooms properties represent 63.6% of the active Airbnb listings in Osoyoos, indicating a high concentration in these sizes.
- A significant 62.2% of listings offer 3+ bedrooms, catering to larger groups and families seeking more space in Osoyoos.
Osoyoos Vacation Rental Guest Capacity Trends (2025)
Distribution of Listings by Guest Capacity
Guest Capacity Insights for Osoyoos
- The most common guest capacity trend in Osoyoos vacation rentals is listings accommodating 8+ guests (43.9%). This suggests the primary traveler segment is likely larger groups.
- Properties designed for 8+ guests and 6 guests dominate the Osoyoos STR market, accounting for 66.9% of listings.
- 75.7% of properties accommodate 6+ guests, serving the market segment for larger families or group travel in Osoyoos.
- On average, properties in Osoyoos are equipped to host 6.4 guests.
Osoyoos Airbnb Booking Patterns (2025): Available vs. Booked Days
Available Days Distribution
Booked Days Distribution
Booking Pattern Insights for Osoyoos
- The most common availability pattern in Osoyoos falls within the 271-366 days range, representing 60.1% of listings. This suggests many properties have significant open periods on their calendars.
- Approximately 92.5% of listings show high availability (181+ days open annually), indicating potential for increased bookings or specific owner usage patterns.
- For booked days, the 31-90 days range is most frequent in Osoyoos (45.9%), reflecting common guest stay durations or potential owner blocking patterns.
- A notable 8.1% of properties secure long booking periods (181+ days booked per year), highlighting successful long-term rental strategies or significant owner usage.
Osoyoos Airbnb Minimum Stay Requirements Analysis
Distribution of Listings by Minimum Night Requirement
1 Night
7 listings
5% of total
2 Nights
20 listings
14.4% of total
3 Nights
23 listings
16.5% of total
4-6 Nights
56 listings
40.3% of total
7-29 Nights
13 listings
9.4% of total
30+ Nights
20 listings
14.4% of total
Key Insights
- The most prevalent minimum stay requirement in Osoyoos is 4-6 Nights, adopted by 40.3% of listings. This highlights the market's preference for longer commitments.
- Very short stays (1-2 nights) are less common (19.4%), suggesting hosts prefer slightly longer bookings to optimize turnover.
- A significant segment (14.4%) caters to monthly stays (30+ nights) in Osoyoos, pointing to opportunities in the extended-stay market.
Recommendations
- Align with the market by considering a 4-6 Nights minimum stay, as 40.3% of Osoyoos hosts use this setting.
- If feasible, allowing 1-night stays, especially midweek or during low season, could capture last-minute bookings, as only 5% currently do.
- Explore offering discounts for stays of 30+ nights to attract the 14.4% of the market seeking extended stays.
- Adjust minimum nights based on seasonality – potentially shorter during low season and longer during peak demand periods in Osoyoos.
Osoyoos Airbnb Cancellation Policy Trends Analysis (2025)
Super Strict 30 Days
1 listings
0.8% of total
Flexible
7 listings
5.5% of total
Moderate
21 listings
16.5% of total
Firm
71 listings
55.9% of total
Strict
27 listings
21.3% of total
Cancellation Policy Insights for Osoyoos
- The prevailing Airbnb cancellation policy trend in Osoyoos is Firm, used by 55.9% of listings.
- A majority (77.2%) of hosts in Osoyoos utilize Firm or Strict policies, indicating a market where hosts prioritize booking security.
Recommendations for Hosts
- Consider adopting a Firm policy to align with the 55.9% market standard in Osoyoos.
- Regularly review your cancellation policy against competitors and market demand shifts in Osoyoos.
Osoyoos STR Booking Lead Time Analysis (2025)
Average Booking Lead Time by Month
Booking Lead Time Insights for Osoyoos
- The overall average booking lead time for vacation rentals in Osoyoos is 80 days.
- Guests book furthest in advance for stays during July (average 138 days), likely coinciding with peak travel demand or local events.
- The shortest booking windows occur for stays in November (average 42 days), indicating more last-minute travel plans during this time.
- Seasonally, Summer (115 days avg.) sees the longest lead times, while Fall (55 days avg.) has the shortest, reflecting typical travel planning cycles.
Recommendations for Hosts
- Use the overall average lead time (80 days) as a baseline for your pricing and availability strategy in Osoyoos.
- For July stays, consider implementing length-of-stay discounts or slightly higher rates for bookings made less than 138 days out to capitalize on advance planning.
- Target marketing efforts for the Summer season well in advance (at least 115 days) to capture early planners.
- Monitor your own booking lead times against these Osoyoos averages to identify opportunities for dynamic pricing adjustments.
Popular & Essential Airbnb Amenities in Osoyoos (2025)
Amenity Prevalence
Amenity Insights for Osoyoos
- Essential amenities in Osoyoos that guests expect include: TV, Kitchen, Air conditioning, Wifi, Heating, Smoke alarm, Free parking on premises. Lacking these (any) could significantly impact bookings.
- Popular amenities like Dishes and silverware, Washer, Refrigerator are common but not universal. Offering these can provide a competitive edge.
Recommendations for Hosts
- Ensure your listing includes all essential amenities for Osoyoos: TV, Kitchen, Air conditioning, Wifi, Heating, Smoke alarm, Free parking on premises.
- Prioritize adding missing essentials: TV, Kitchen, Air conditioning, Wifi, Heating, Smoke alarm, Free parking on premises.
- Consider adding popular differentiators like Dishes and silverware or Washer to increase appeal.
- Highlight unique or less common amenities you offer (e.g., hot tub, dedicated workspace, EV charger) in your listing description and photos.
- Regularly check competitor amenities in Osoyoos to stay competitive.
Osoyoos Airbnb Guest Demographics & Profile Analysis (2025)
Guest Profile Summary for Osoyoos
- The typical guest profile for Airbnb in Osoyoos consists of primarily domestic travelers (87%), often arriving from nearby Vancouver, typically belonging to the Post-2000s (Gen Z/Alpha) group (50%), primarily speaking English or French.
- Domestic travelers account for 87.3% of guests.
- Key international markets include Canada (87.3%) and United States (7.6%).
- Top languages spoken are English (67.4%) followed by French (9.9%).
- A significant demographic segment is the Post-2000s (Gen Z/Alpha) group, representing 50% of guests.
Recommendations for Hosts
- Target domestic marketing efforts towards travelers from Vancouver and Calgary.
- Tailor amenities and listing descriptions to appeal to the dominant Post-2000s (Gen Z/Alpha) demographic (e.g., highlight fast WiFi, smart home features, local guides).
- Highlight unique local experiences or amenities relevant to the primary guest profile.
- Consider seasonal promotions aligned with peak travel times for key origin markets.
Nearby Short-Term Rental Market Comparison
How does the Osoyoos Airbnb market stack up against its neighbors? Compare key performance metrics like average monthly revenue, ADR, and occupancy rates in surrounding areas to understand the broader regional STR landscape.
| Market | Active Properties | Monthly Revenue | Daily Rate | Avg. Occupancy |
|---|---|---|---|---|
| Brewster | 10 | $4,540 | $353.39 | 46% |
| Mazama | 31 | $4,302 | $323.03 | 46% |
| Okanogan County | 25 | $3,429 | $339.54 | 38% |
| Pateros | 13 | $3,400 | $303.28 | 43% |
| Revelstoke | 270 | $2,888 | $243.40 | 48% |
| Winthrop | 166 | $2,880 | $259.98 | 40% |
| Area B (Shelter Bay/Mica Creek) | 75 | $2,605 | $286.74 | 40% |
| West Kelowna | 344 | $2,334 | $241.72 | 47% |
| Area E (Naramata/Greyback) | 81 | $2,306 | $279.66 | 45% |
| Sun Peaks Mountain Resort Municipality | 326 | $2,291 | $281.89 | 36% |