North Cowichan Airbnb Market Analysis 2025: Short Term Rental Data & Vacation Rental Statistics in British Columbia, Canada
Is Airbnb profitable in North Cowichan in 2025? Explore comprehensive Airbnb analytics for North Cowichan, British Columbia, Canada to uncover income potential. This 2025 STR market report for North Cowichan, based on AirROI data from April 2024 to March 2025, reveals key trends in the niche market of 160 active listings.
Whether you're considering an Airbnb investment in North Cowichan, optimizing your existing vacation rental, or exploring rental arbitrage opportunities, understanding the North Cowichan Airbnb data is crucial. Leveraging the low regulation environment is key to maximizing your short term rental income potential. Let's dive into the specifics.
Key North Cowichan Airbnb Performance Metrics Overview
Monthly Airbnb Revenue Variations & Income Potential in North Cowichan (2025)
Understanding the monthly revenue variations for Airbnb listings in North Cowichan is key to maximizing your short term rental income potential. Seasonality significantly impacts earnings. Our analysis, based on data from the past 12 months, shows that the peak revenue month for STRs in North Cowichan is typically August, while February often presents the lowest earnings, highlighting opportunities for strategic pricing adjustments during shoulder and low seasons. Explore the typical Airbnb income in North Cowichan across different performance tiers:
- Best-in-class properties (Top 10%) achieve $3,975+ monthly, often utilizing dynamic pricing and superior guest experiences.
- Strong performing properties (Top 25%) earn $2,521 or more, indicating effective management and desirable locations/amenities.
- Typical properties (Median) generate around $1,632 per month, representing the average market performance.
- Entry-level properties (Bottom 25%) see earnings around $908, often with potential for optimization.
Average Monthly Airbnb Earnings Trend in North Cowichan
North Cowichan Airbnb Occupancy Rate Trends (2025)
Maximize your bookings by understanding the North Cowichan STR occupancy trends. Seasonal demand shifts significantly influence how often properties are booked. Typically, Augustsees the highest demand (peak season occupancy), while January experiences the lowest (low season). Effective strategies, like adjusting minimum stays or offering promotions, can boost occupancy during slower periods. Here's how different property tiers perform in North Cowichan:
- Best-in-class properties (Top 10%) achieve 86%+ occupancy, indicating high desirability and potentially optimized availability.
- Strong performing properties (Top 25%) maintain 67% or higher occupancy, suggesting good market fit and guest satisfaction.
- Typical properties (Median) have an occupancy rate around 48%.
- Entry-level properties (Bottom 25%) average 25% occupancy, potentially facing higher vacancy.
Average Monthly Occupancy Rate Trend in North Cowichan
Average Daily Rate (ADR) Airbnb Trends in North Cowichan (2025)
Effective short term rental pricing strategy in North Cowichan involves understanding monthly ADR fluctuations. The Average Daily Rate (ADR) for Airbnb in North Cowichan typically peaks in July and dips lowest during February. Leveraging Airbnb dynamic pricing tools or strategies based on this seasonality can significantly boost revenue. Here's a look at the typical nightly rates achieved:
- Best-in-class properties (Top 10%) command rates of $245+ per night, often due to premium features or locations.
- Strong performing properties (Top 25%) achieve nightly rates of $148 or more.
- Typical properties (Median) charge around $98 per night.
- Entry-level properties (Bottom 25%) earn around $75 per night.
Average Daily Rate (ADR) Trend by Month in North Cowichan
Get Live North Cowichan Market Intelligence 👇

Explore Real-time Analytics
Airbnb Seasonality Analysis & Trends in North Cowichan (2025)
Peak Season (August, July, June)
- Revenue averages $3,033 per month
- Occupancy rates average 58.1%
- Daily rates average $140
Shoulder Season
- Revenue averages $2,056 per month
- Occupancy maintains around 46.9%
- Daily rates hold near $136
Low Season (January, February, March)
- Revenue drops to average $1,395 per month
- Occupancy decreases to average 39.5%
- Daily rates adjust to average $134
Seasonality Insights for North Cowichan
- The Airbnb seasonality in North Cowichan shows highly seasonal trends requiring careful strategy. While the sections above show seasonal averages, it's also insightful to look at the extremes:
- During the high season, the absolute peak month showcases North Cowichan's highest earning potential, with monthly revenues capable of climbing to $3,177, occupancy reaching a high of 63.2%, and ADRs peaking at $142.
- Conversely, the slowest single month of the year, typically falling within the low season, marks the market's lowest point. In this month, revenue might dip to $1,318, occupancy could drop to 39.1%, and ADRs may adjust down to $134.
- Understanding both the seasonal averages and these monthly peaks and troughs in revenue, occupancy, and ADR is crucial for maximizing your Airbnb profit potential in North Cowichan.
Seasonal Strategies for Maximizing Profit
- Peak Season: Maximize revenue through premium pricing and potentially longer minimum stays. Ensure high availability.
- Low Season: Offer competitive pricing, special promotions (e.g., extended stay discounts), and flexible cancellation policies. Target off-season travelers like remote workers or budget-conscious guests.
- Shoulder Seasons: Implement dynamic pricing that balances peak and low rates. Target weekend travelers or specific events. Offer slightly more flexible terms than peak season.
- Regularly analyze your own performance against these North Cowichan seasonality benchmarks and adjust your pricing and availability strategy accordingly.
Best Areas for Airbnb Investment in North Cowichan (2025)
Exploring the top neighborhoods for short-term rentals in North Cowichan? This section highlights key areas, outlining why they are attractive for hosts and guests, along with notable local attractions. Consider these locations based on your target guest profile and investment strategy.
| Neighborhood / Area | Why Host Here? (Target Guests & Appeal) | Key Attractions & Landmarks |
|---|---|---|
| Cowichan Bay | A picturesque seaside village known for its charming waterfront, local shops, and dining. Great for guests wanting a quaint experience with access to outdoor activities. | Cowichan Bay Maritime Centre, Ecological Reserve, local artisan shops, fishing and kayaking, restaurants with fresh seafood |
| Duncan | Known as the City of Totems, Duncan offers a rich cultural experience with its Indigenous art and history, appealing to tourists interested in local heritage. | Glenora Distillery, Duncan Totem Poles, Downtown Duncan shops, Cowichan Valley Museum, Cowichan Valley wine tours |
| Maple Bay | A scenic area with stunning views of the ocean and nearby mountains, perfect for guests seeking a relaxing getaway near beaches and trails. | Maple Bay Beach, Mount Prevost hiking trails, kayaking and boating, local restaurants, nature parks |
| Chemainus | Famous for its mural art and small-town charm, Chemainus attracts visitors looking for a cultural escape and outdoor adventures nearby. | Chemainus Murals, Chemainus Theatre, local shops, waterfront parks, ocean views |
| Lake Cowichan | This area is ideal for outdoor enthusiasts, offering lake access, camping, and various water sports, attracting families and adventure-seekers. | Lake Cowichan, scenic hiking trails, water sports, local campgrounds, wildlife watching |
| Shawnigan Lake | A popular spot for summer retreats with beautiful lake views, making it attractive for vacationers looking for tranquility and recreational activities. | Shawnigan Lake, hiking trails, beach access, local cafes, camping and boating |
| Cowichan Valley Wine Region | Known for its vineyards and wineries, this area attracts wine lovers and foodies seeking unique experiences and tastings. | local wineries, vineyard tours, wine tastings, farm-to-table dining, scenic drives |
| Salt Spring Island (accessible from North Cowichan) | This nearby island is famous for its arts community, farmers' markets, and natural beauty, ideal for guests looking for a unique island experience. | Salt Spring Island Vineyards, Funky Farms, local markets, beaches, art galleries |
Understanding Airbnb License Requirements & STR Laws in North Cowichan (2025)
While North Cowichan, British Columbia, Canada currently shows low STR regulations, specific Airbnb license requirements might still exist or change. Always verify the latest short term rental regulations and Airbnb license requirements directly with local government authorities for North Cowichan to ensure full compliance before hosting.
(Source: AirROI data, 2025, finding no licensed listings among those analyzed)
Top Performing Airbnb Properties in North Cowichan (2025)
Benchmark your potential! Explore examples of top-performing Airbnb properties in North Cowichanbased on Trailing Twelve Month (TTM) revenue. Analyze their characteristics, revenue, occupancy rate, and ADR to understand what drives success in this market.
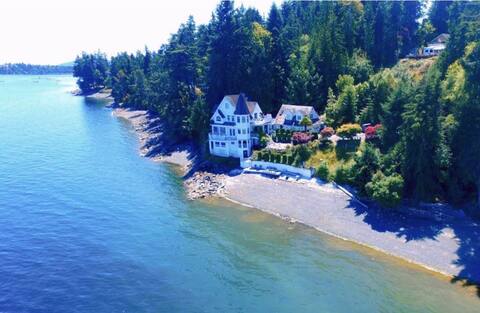
Walk on Waterfront Castle large-land
Entire Place • 5 bedrooms

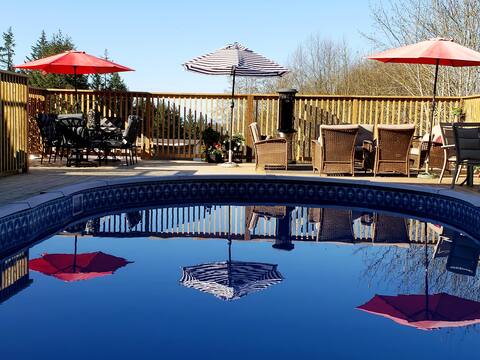
Magical Farm Villa with Heated Salt Water Pool
Entire Place • 6 bedrooms
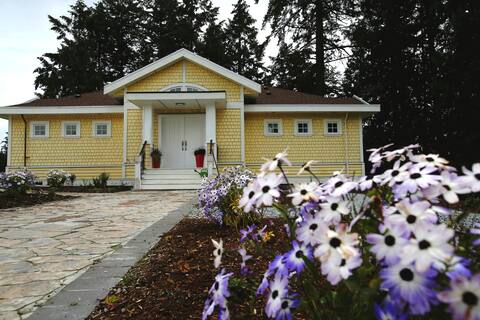
Unique Oceanside 40 acres with spacious home
Entire Place • 4 bedrooms
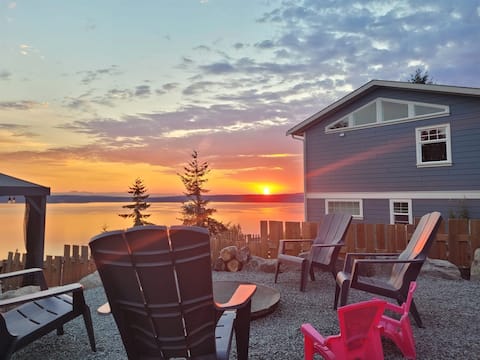
Gorgeous Home with Hot Tub & Ocean Views
Entire Place • 3 bedrooms

Beautiful timber frame rancher with Lakeview
Entire Place • 6 bedrooms
Crofton Country Retreat
Entire Place • 5 bedrooms
Note: Performance varies based on location, size, amenities, seasonality, and management quality. Data reflects the past 12 months.
Top Performing Airbnb Hosts in North Cowichan (2025)
Learn from the best! This table showcases top-performing Airbnb hosts in North Cowichan based on the number of properties managed and estimated total revenue over the past year. Analyze their scale and performance metrics.
| Host Name | Properties | Grossing Revenue | Stay Reviews | Avg Rating |
|---|---|---|---|---|
| Athena | 3 | $204,899 | 274 | 4.66/5.0 |
| Colin Marke | 1 | $143,968 | 17 | 5.00/5.0 |
| Emr | 4 | $136,476 | 71 | 4.81/5.0 |
| Matthew | 2 | $69,599 | 45 | 4.63/5.0 |
| Matt | 2 | $67,635 | 43 | 4.96/5.0 |
| Heidi | 1 | $65,267 | 33 | 5.00/5.0 |
| Shawn | 1 | $57,644 | 95 | 4.94/5.0 |
| Joyce | 2 | $57,329 | 37 | 4.95/5.0 |
| Kathini | 1 | $53,419 | 5 | 5.00/5.0 |
| Steven | 2 | $49,203 | 52 | 4.93/5.0 |
Analyzing the strategies of top hosts, such as their property selection, pricing, and guest communication, can offer valuable lessons for optimizing your own Airbnb operations in North Cowichan.
Dive Deeper: Advanced North Cowichan STR Market Data (2025)
Ready to unlock more insights? AirROI provides access to advanced metrics and comprehensive Airbnb data for North Cowichan. Explore detailed analytics beyond this report to refine your investment strategy, optimize pricing, and maximize your vacation rental profits.
Explore Advanced MetricsNorth Cowichan Short-Term Rental Market Composition (2025): Property & Room Types
Room Type Distribution
Property Type Distribution
Market Composition Insights for North Cowichan
- The North Cowichan Airbnb market composition is heavily skewed towards Entire Home/Apt listings, which make up 85% of the 160 active rentals. This indicates strong guest preference for privacy and space.
- Looking at the property type distribution in North Cowichan, Others properties are the most common (36.3%), reflecting the local real estate landscape.
- Houses represent a significant 25.6% portion, catering likely to families or larger groups.
- The presence of 15% Hotel/Boutique listings indicates integration with traditional hospitality.
- Smaller segments like unique stays (combined 1.3%) offer potential for unique stay experiences.
North Cowichan Airbnb Room Capacity Analysis (2025): Bedroom Distribution
Distribution of Listings by Number of Bedrooms
Room Capacity Insights for North Cowichan
- The dominant room capacity in North Cowichan is 1 bedroom listings, making up 49.4% of the market. This suggests a strong demand for properties suitable for couples or solo travelers.
- Together, 1 bedroom and 2 bedrooms properties represent 68.8% of the active Airbnb listings in North Cowichan, indicating a high concentration in these sizes.
North Cowichan Vacation Rental Guest Capacity Trends (2025)
Distribution of Listings by Guest Capacity
Guest Capacity Insights for North Cowichan
- The most common guest capacity trend in North Cowichan vacation rentals is listings accommodating 2 guests (35%). This suggests the primary traveler segment is likely couples or solo travelers.
- Properties designed for 2 guests and 4 guests dominate the North Cowichan STR market, accounting for 59.4% of listings.
- 17.6% of properties accommodate 6+ guests, serving the market segment for larger families or group travel in North Cowichan.
- On average, properties in North Cowichan are equipped to host 3.4 guests.
North Cowichan Airbnb Booking Patterns (2025): Available vs. Booked Days
Available Days Distribution
Booked Days Distribution
Booking Pattern Insights for North Cowichan
- The most common availability pattern in North Cowichan falls within the 271-366 days range, representing 35% of listings. This suggests many properties have significant open periods on their calendars.
- Approximately 60.6% of listings show high availability (181+ days open annually), indicating potential for increased bookings or specific owner usage patterns.
- For booked days, the 181-270 days range is most frequent in North Cowichan (33.8%), reflecting common guest stay durations or potential owner blocking patterns.
- A notable 40.7% of properties secure long booking periods (181+ days booked per year), highlighting successful long-term rental strategies or significant owner usage.
North Cowichan Airbnb Minimum Stay Requirements Analysis
Distribution of Listings by Minimum Night Requirement
1 Night
32 listings
22.9% of total
2 Nights
55 listings
39.3% of total
3 Nights
27 listings
19.3% of total
4-6 Nights
7 listings
5% of total
7-29 Nights
9 listings
6.4% of total
30+ Nights
10 listings
7.1% of total
Key Insights
- The most prevalent minimum stay requirement in North Cowichan is 2 Nights, adopted by 39.3% of listings. This highlights the market's preference for shorter, flexible bookings.
- A strong majority (62.2%) of the North Cowichan Airbnb data shows acceptance of very short stays (1-2 nights), indicating a dynamic, high-turnover market.
Recommendations
- Align with the market by considering a 2 Nights minimum stay, as 39.3% of North Cowichan hosts use this setting.
- If feasible, allowing 1-night stays, especially midweek or during low season, could capture last-minute bookings, as only 22.9% currently do.
- Explore offering discounts for stays of 30+ nights to attract the 7.1% of the market seeking extended stays.
- Adjust minimum nights based on seasonality – potentially shorter during low season and longer during peak demand periods in North Cowichan.
North Cowichan Airbnb Cancellation Policy Trends Analysis (2025)
Super Strict 60 Days
4 listings
2.8% of total
Flexible
45 listings
31.5% of total
Moderate
49 listings
34.3% of total
Firm
30 listings
21% of total
Strict
15 listings
10.5% of total
Cancellation Policy Insights for North Cowichan
- The prevailing Airbnb cancellation policy trend in North Cowichan is Moderate, used by 34.3% of listings.
- There's a relatively balanced mix between guest-friendly (65.8%) and stricter (31.5%) policies, offering choices for different guest needs.
Recommendations for Hosts
- Consider adopting a Moderate policy to align with the 34.3% market standard in North Cowichan.
- Using a Strict policy might deter some guests, as only 10.5% of listings use it. Evaluate if potential revenue protection outweighs possible lower booking rates.
- Regularly review your cancellation policy against competitors and market demand shifts in North Cowichan.
North Cowichan STR Booking Lead Time Analysis (2025)
Average Booking Lead Time by Month
Booking Lead Time Insights for North Cowichan
- The overall average booking lead time for vacation rentals in North Cowichan is 47 days.
- Guests book furthest in advance for stays during July (average 84 days), likely coinciding with peak travel demand or local events.
- The shortest booking windows occur for stays in March (average 35 days), indicating more last-minute travel plans during this time.
- Seasonally, Summer (75 days avg.) sees the longest lead times, while Winter (44 days avg.) has the shortest, reflecting typical travel planning cycles.
Recommendations for Hosts
- Use the overall average lead time (47 days) as a baseline for your pricing and availability strategy in North Cowichan.
- For July stays, consider implementing length-of-stay discounts or slightly higher rates for bookings made less than 84 days out to capitalize on advance planning.
- Target marketing efforts for the Summer season well in advance (at least 75 days) to capture early planners.
- Monitor your own booking lead times against these North Cowichan averages to identify opportunities for dynamic pricing adjustments.
Popular & Essential Airbnb Amenities in North Cowichan (2025)
Amenity Prevalence
Amenity Insights for North Cowichan
- Essential amenities in North Cowichan that guests expect include: Smoke alarm, Heating, Wifi. Lacking these (any) could significantly impact bookings.
- Popular amenities like Hot water, Dishes and silverware, Free parking on premises are common but not universal. Offering these can provide a competitive edge.
Recommendations for Hosts
- Ensure your listing includes all essential amenities for North Cowichan: Smoke alarm, Heating, Wifi.
- Prioritize adding missing essentials: Smoke alarm, Heating, Wifi.
- Consider adding popular differentiators like Hot water or Dishes and silverware to increase appeal.
- Highlight unique or less common amenities you offer (e.g., hot tub, dedicated workspace, EV charger) in your listing description and photos.
- Regularly check competitor amenities in North Cowichan to stay competitive.
North Cowichan Airbnb Guest Demographics & Profile Analysis (2025)
Guest Profile Summary for North Cowichan
- The typical guest profile for Airbnb in North Cowichan consists of primarily domestic travelers (76%), often arriving from nearby Vancouver, typically belonging to the Post-2000s (Gen Z/Alpha) group (50%), primarily speaking English or French.
- Domestic travelers account for 76.0% of guests.
- Key international markets include Canada (76%) and United States (13.8%).
- Top languages spoken are English (65.8%) followed by French (10.2%).
- A significant demographic segment is the Post-2000s (Gen Z/Alpha) group, representing 50% of guests.
Recommendations for Hosts
- Target domestic marketing efforts towards travelers from Vancouver and Victoria.
- Tailor amenities and listing descriptions to appeal to the dominant Post-2000s (Gen Z/Alpha) demographic (e.g., highlight fast WiFi, smart home features, local guides).
- Highlight unique local experiences or amenities relevant to the primary guest profile.
- Consider seasonal promotions aligned with peak travel times for key origin markets.
Nearby Short-Term Rental Market Comparison
How does the North Cowichan Airbnb market stack up against its neighbors? Compare key performance metrics like average monthly revenue, ADR, and occupancy rates in surrounding areas to understand the broader regional STR landscape.
| Market | Active Properties | Monthly Revenue | Daily Rate | Avg. Occupancy |
|---|---|---|---|---|
| Erlands Point-Kitsap Lake | 11 | $6,325 | $353.76 | 56% |
| Lake Goodwin | 11 | $4,949 | $371.43 | 44% |
| Amanda Park | 10 | $4,780 | $425.06 | 46% |
| Cape George Colony Club | 10 | $4,770 | $257.49 | 59% |
| Allyn | 20 | $4,462 | $415.57 | 36% |
| Sudden Valley | 65 | $4,390 | $286.32 | 53% |
| Olalla | 14 | $4,279 | $288.96 | 53% |
| Orcas Island | 13 | $4,220 | $514.57 | 39% |
| Friday Harbor | 219 | $4,187 | $371.96 | 45% |
| Moclips | 110 | $4,108 | $367.54 | 39% |