Langford Airbnb Market Analysis 2025: Short Term Rental Data & Vacation Rental Statistics in British Columbia, Canada
Is Airbnb profitable in Langford in 2025? Explore comprehensive Airbnb analytics for Langford, British Columbia, Canada to uncover income potential. This 2025 STR market report for Langford, based on AirROI data from April 2024 to March 2025, reveals key trends in the market of 270 active listings.
Whether you're considering an Airbnb investment in Langford, optimizing your existing vacation rental, or exploring rental arbitrage opportunities, understanding the Langford Airbnb data is crucial. Leveraging the low regulation environment is key to maximizing your short term rental income potential. Let's dive into the specifics.
Key Langford Airbnb Performance Metrics Overview
Monthly Airbnb Revenue Variations & Income Potential in Langford (2025)
Understanding the monthly revenue variations for Airbnb listings in Langford is key to maximizing your short term rental income potential. Seasonality significantly impacts earnings. Our analysis, based on data from the past 12 months, shows that the peak revenue month for STRs in Langford is typically May, while February often presents the lowest earnings, highlighting opportunities for strategic pricing adjustments during shoulder and low seasons. Explore the typical Airbnb income in Langford across different performance tiers:
- Best-in-class properties (Top 10%) achieve $5,135+ monthly, often utilizing dynamic pricing and superior guest experiences.
- Strong performing properties (Top 25%) earn $2,829 or more, indicating effective management and desirable locations/amenities.
- Typical properties (Median) generate around $1,833 per month, representing the average market performance.
- Entry-level properties (Bottom 25%) see earnings around $1,162, often with potential for optimization.
Average Monthly Airbnb Earnings Trend in Langford
Langford Airbnb Occupancy Rate Trends (2025)
Maximize your bookings by understanding the Langford STR occupancy trends. Seasonal demand shifts significantly influence how often properties are booked. Typically, Augustsees the highest demand (peak season occupancy), while December experiences the lowest (low season). Effective strategies, like adjusting minimum stays or offering promotions, can boost occupancy during slower periods. Here's how different property tiers perform in Langford:
- Best-in-class properties (Top 10%) achieve 88%+ occupancy, indicating high desirability and potentially optimized availability.
- Strong performing properties (Top 25%) maintain 77% or higher occupancy, suggesting good market fit and guest satisfaction.
- Typical properties (Median) have an occupancy rate around 57%.
- Entry-level properties (Bottom 25%) average 30% occupancy, potentially facing higher vacancy.
Average Monthly Occupancy Rate Trend in Langford
Average Daily Rate (ADR) Airbnb Trends in Langford (2025)
Effective short term rental pricing strategy in Langford involves understanding monthly ADR fluctuations. The Average Daily Rate (ADR) for Airbnb in Langford typically peaks in August and dips lowest during February. Leveraging Airbnb dynamic pricing tools or strategies based on this seasonality can significantly boost revenue. Here's a look at the typical nightly rates achieved:
- Best-in-class properties (Top 10%) command rates of $301+ per night, often due to premium features or locations.
- Strong performing properties (Top 25%) achieve nightly rates of $162 or more.
- Typical properties (Median) charge around $100 per night.
- Entry-level properties (Bottom 25%) earn around $73 per night.
Average Daily Rate (ADR) Trend by Month in Langford
Get Live Langford Market Intelligence 👇

Explore Real-time Analytics
Airbnb Seasonality Analysis & Trends in Langford (2025)
Peak Season (May, August, June)
- Revenue averages $3,468 per month
- Occupancy rates average 62.2%
- Daily rates average $154
Shoulder Season
- Revenue averages $2,533 per month
- Occupancy maintains around 53.7%
- Daily rates hold near $148
Low Season (January, February, March)
- Revenue drops to average $1,655 per month
- Occupancy decreases to average 45.7%
- Daily rates adjust to average $135
Seasonality Insights for Langford
- The Airbnb seasonality in Langford shows highly seasonal trends requiring careful strategy. While the sections above show seasonal averages, it's also insightful to look at the extremes:
- During the high season, the absolute peak month showcases Langford's highest earning potential, with monthly revenues capable of climbing to $3,520, occupancy reaching a high of 71.7%, and ADRs peaking at $158.
- Conversely, the slowest single month of the year, typically falling within the low season, marks the market's lowest point. In this month, revenue might dip to $1,494, occupancy could drop to 42.9%, and ADRs may adjust down to $132.
- Understanding both the seasonal averages and these monthly peaks and troughs in revenue, occupancy, and ADR is crucial for maximizing your Airbnb profit potential in Langford.
Seasonal Strategies for Maximizing Profit
- Peak Season: Maximize revenue through premium pricing and potentially longer minimum stays. Ensure high availability.
- Low Season: Offer competitive pricing, special promotions (e.g., extended stay discounts), and flexible cancellation policies. Target off-season travelers like remote workers or budget-conscious guests.
- Shoulder Seasons: Implement dynamic pricing that balances peak and low rates. Target weekend travelers or specific events. Offer slightly more flexible terms than peak season.
- Regularly analyze your own performance against these Langford seasonality benchmarks and adjust your pricing and availability strategy accordingly.
Best Areas for Airbnb Investment in Langford (2025)
Exploring the top neighborhoods for short-term rentals in Langford? This section highlights key areas, outlining why they are attractive for hosts and guests, along with notable local attractions. Consider these locations based on your target guest profile and investment strategy.
| Neighborhood / Area | Why Host Here? (Target Guests & Appeal) | Key Attractions & Landmarks |
|---|---|---|
| Mill Hill | A serene neighborhood situated near nature parks, Mill Hill offers a tranquil environment attracting families and nature enthusiasts. It provides easy access to walking trails and wildlife viewing. | Mill Hill Regional Park, Bear Mountain, Goldstream Provincial Park, Langford Lake, Westshore Town Centre |
| Langford Proper | The vibrant center of Langford, this area features a mix of shops, restaurants, and community events. It's ideal for tourists seeking convenience and local culture. | Langford Village, Glen Lake, Langford Lake Park, Millstream Village, Royal Colwood Golf Club |
| Bear Mountain | Known for its upscale homes and luxury resorts, Bear Mountain attracts visitors looking for golf, spa services, and outdoor activities, perfect for high-end vacation rentals. | Bear Mountain Golf Club, The Westin Bear Mountain Resort, Scenic hiking trails, Spa treatments, Nearby golf courses |
| Goldstream | A nature lover's paradise, Goldstream offers stunning views and outdoor activities. It appeals to adventurers who want to experience the natural beauty of British Columbia. | Goldstream Provincial Park, Goldstream River, Hiking trails, Wildlife viewing, Visitor Centre |
| Happy Valley | This family-friendly community is close to multiple recreational facilities and schools, making it popular among families traveling with kids. | Happy Valley Park, Thetis Lake Regional Park, Galloping Goose Trail, Family-centric events, Local markets |
| Langford Lake | A peaceful lakeside area perfect for summer getaways. It attracts visitors looking for water activities, picnics, and relaxed vacations. | Langford Lake, Kayaking and canoeing, Picnic areas, Hiking trails, Dog parks |
| Thetis Heights | A growing residential area, Thetis Heights offers great accessibility to major routes and amenities, making it suitable for visitors who prefer suburban living. | Thetis Lake, Walking trails, Local cafes, Proximity to shopping, Schools and services |
| Westhills | A newer community with modern amenities and community parks. It attracts young families and those looking for a recently developed area with a strong community feel. | Westhills Stadium, Community parks, Walking paths, Shopping facilities, Restaurants |
Understanding Airbnb License Requirements & STR Laws in Langford (2025)
While Langford, British Columbia, Canada currently shows low STR regulations, specific Airbnb license requirements might still exist or change. Always verify the latest short term rental regulations and Airbnb license requirements directly with local government authorities for Langford to ensure full compliance before hosting.
(Source: AirROI data, 2025, finding no licensed listings among those analyzed)
Top Performing Airbnb Properties in Langford (2025)
Benchmark your potential! Explore examples of top-performing Airbnb properties in Langfordbased on Trailing Twelve Month (TTM) revenue. Analyze their characteristics, revenue, occupancy rate, and ADR to understand what drives success in this market.
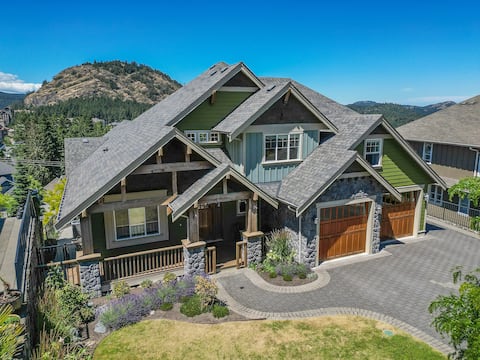
7 Bedroom Estate with Sweeping Mountain Views
Entire Place • 7 bedrooms
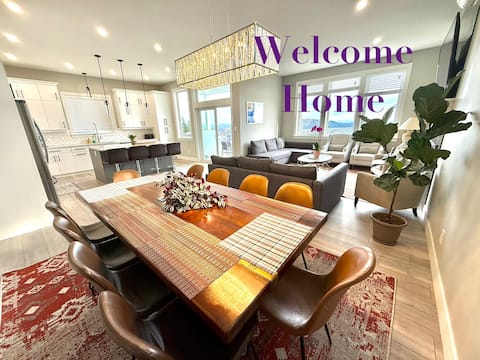
Luxury New Home w/Great View
Entire Place • 6 bedrooms
Vista 18
Entire Place • 5 bedrooms

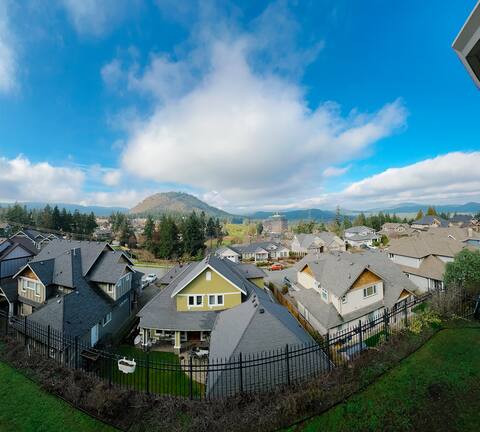
Wonderful Home with Great View
Entire Place • 8 bedrooms

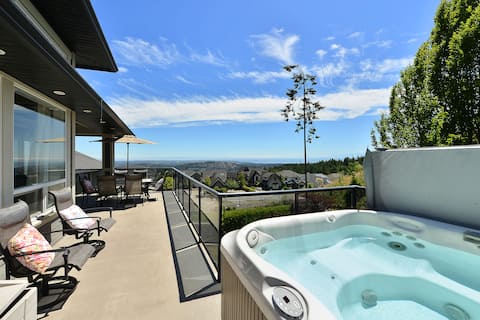
Glen Lake Family Retreat with Hot Tub & Lake View
Entire Place • 5 bedrooms
Spectacular 6 Bedroom Executive Victoria Vacation
Entire Place • 6 bedrooms
Note: Performance varies based on location, size, amenities, seasonality, and management quality. Data reflects the past 12 months.
Top Performing Airbnb Hosts in Langford (2025)
Learn from the best! This table showcases top-performing Airbnb hosts in Langford based on the number of properties managed and estimated total revenue over the past year. Analyze their scale and performance metrics.
| Host Name | Properties | Grossing Revenue | Stay Reviews | Avg Rating |
|---|---|---|---|---|
| Maxwell | 9 | $535,786 | 265 | 4.23/5.0 |
| Emr | 3 | $309,564 | 38 | 4.79/5.0 |
| Marie | 2 | $149,432 | 82 | 4.96/5.0 |
| Ashley | 1 | $132,894 | 17 | 4.88/5.0 |
| Hiranand | 3 | $123,462 | 62 | 4.66/5.0 |
| Susan | 3 | $118,692 | 28 | 3.31/5.0 |
| Angel | 5 | $112,410 | 53 | 3.77/5.0 |
| Michelle | 1 | $104,905 | 28 | 4.93/5.0 |
| Charlotte | 1 | $99,362 | 25 | 4.68/5.0 |
| Mohammed Rizwan | 1 | $96,156 | 35 | 4.74/5.0 |
Analyzing the strategies of top hosts, such as their property selection, pricing, and guest communication, can offer valuable lessons for optimizing your own Airbnb operations in Langford.
Dive Deeper: Advanced Langford STR Market Data (2025)
Ready to unlock more insights? AirROI provides access to advanced metrics and comprehensive Airbnb data for Langford. Explore detailed analytics beyond this report to refine your investment strategy, optimize pricing, and maximize your vacation rental profits.
Explore Advanced MetricsLangford Short-Term Rental Market Composition (2025): Property & Room Types
Room Type Distribution
Property Type Distribution
Market Composition Insights for Langford
- The Langford Airbnb market composition is heavily skewed towards Entire Home/Apt listings, which make up 83% of the 270 active rentals. This indicates strong guest preference for privacy and space.
- Looking at the property type distribution in Langford, House properties are the most common (41.1%), reflecting the local real estate landscape.
- Houses represent a significant 41.1% portion, catering likely to families or larger groups.
- The presence of 5.2% Hotel/Boutique listings indicates integration with traditional hospitality.
- Smaller segments like outdoor/unique (combined 1.5%) offer potential for unique stay experiences.
Langford Airbnb Room Capacity Analysis (2025): Bedroom Distribution
Distribution of Listings by Number of Bedrooms
Room Capacity Insights for Langford
- The dominant room capacity in Langford is 1 bedroom listings, making up 48.5% of the market. This suggests a strong demand for properties suitable for couples or solo travelers.
- Together, 1 bedroom and 2 bedrooms properties represent 71.8% of the active Airbnb listings in Langford, indicating a high concentration in these sizes.
Langford Vacation Rental Guest Capacity Trends (2025)
Distribution of Listings by Guest Capacity
Guest Capacity Insights for Langford
- The most common guest capacity trend in Langford vacation rentals is listings accommodating 4 guests (27.8%). This suggests the primary traveler segment is likely small families or groups.
- Properties designed for 4 guests and 2 guests dominate the Langford STR market, accounting for 54.5% of listings.
- 20.7% of properties accommodate 6+ guests, serving the market segment for larger families or group travel in Langford.
- On average, properties in Langford are equipped to host 3.7 guests.
Langford Airbnb Booking Patterns (2025): Available vs. Booked Days
Available Days Distribution
Booked Days Distribution
Booking Pattern Insights for Langford
- The most common availability pattern in Langford falls within the 91-180 days range, representing 33.7% of listings. This suggests many properties have significant open periods on their calendars.
- Approximately 55.9% of listings show high availability (181+ days open annually), indicating potential for increased bookings or specific owner usage patterns.
- For booked days, the 181-270 days range is most frequent in Langford (34.8%), reflecting common guest stay durations or potential owner blocking patterns.
- A notable 45.9% of properties secure long booking periods (181+ days booked per year), highlighting successful long-term rental strategies or significant owner usage.
Langford Airbnb Minimum Stay Requirements Analysis
Distribution of Listings by Minimum Night Requirement
1 Night
87 listings
36.1% of total
2 Nights
73 listings
30.3% of total
3 Nights
36 listings
14.9% of total
4-6 Nights
9 listings
3.7% of total
7-29 Nights
12 listings
5% of total
30+ Nights
24 listings
10% of total
Key Insights
- The most prevalent minimum stay requirement in Langford is 1 Night, adopted by 36.1% of listings. This highlights the market's preference for shorter, flexible bookings.
- A strong majority (66.4%) of the Langford Airbnb data shows acceptance of very short stays (1-2 nights), indicating a dynamic, high-turnover market.
Recommendations
- Align with the market by considering a 1 Night minimum stay, as 36.1% of Langford hosts use this setting.
- Explore offering discounts for stays of 30+ nights to attract the 10% of the market seeking extended stays.
- Adjust minimum nights based on seasonality – potentially shorter during low season and longer during peak demand periods in Langford.
Langford Airbnb Cancellation Policy Trends Analysis (2025)
Super Strict 60 Days
3 listings
1.3% of total
Flexible
47 listings
20.6% of total
Moderate
87 listings
38.2% of total
Firm
49 listings
21.5% of total
Strict
42 listings
18.4% of total
Cancellation Policy Insights for Langford
- The prevailing Airbnb cancellation policy trend in Langford is Moderate, used by 38.2% of listings.
- There's a relatively balanced mix between guest-friendly (58.8%) and stricter (39.9%) policies, offering choices for different guest needs.
Recommendations for Hosts
- Consider adopting a Moderate policy to align with the 38.2% market standard in Langford.
- Regularly review your cancellation policy against competitors and market demand shifts in Langford.
Langford STR Booking Lead Time Analysis (2025)
Average Booking Lead Time by Month
Booking Lead Time Insights for Langford
- The overall average booking lead time for vacation rentals in Langford is 39 days.
- Guests book furthest in advance for stays during July (average 68 days), likely coinciding with peak travel demand or local events.
- The shortest booking windows occur for stays in February (average 34 days), indicating more last-minute travel plans during this time.
- Seasonally, Summer (59 days avg.) sees the longest lead times, while Winter (38 days avg.) has the shortest, reflecting typical travel planning cycles.
Recommendations for Hosts
- Use the overall average lead time (39 days) as a baseline for your pricing and availability strategy in Langford.
- For July stays, consider implementing length-of-stay discounts or slightly higher rates for bookings made less than 68 days out to capitalize on advance planning.
- Target marketing efforts for the Summer season well in advance (at least 59 days) to capture early planners.
- Monitor your own booking lead times against these Langford averages to identify opportunities for dynamic pricing adjustments.
Popular & Essential Airbnb Amenities in Langford (2025)
Amenity Prevalence
Amenity Insights for Langford
- Essential amenities in Langford that guests expect include: Wifi, Smoke alarm, Heating, Hot water, TV. Lacking these (any) could significantly impact bookings.
- Popular amenities like Kitchen, Essentials, Dishes and silverware are common but not universal. Offering these can provide a competitive edge.
Recommendations for Hosts
- Ensure your listing includes all essential amenities for Langford: Wifi, Smoke alarm, Heating, Hot water, TV.
- Prioritize adding missing essentials: Wifi, Smoke alarm, Heating, Hot water, TV.
- Consider adding popular differentiators like Kitchen or Essentials to increase appeal.
- Highlight unique or less common amenities you offer (e.g., hot tub, dedicated workspace, EV charger) in your listing description and photos.
- Regularly check competitor amenities in Langford to stay competitive.
Langford Airbnb Guest Demographics & Profile Analysis (2025)
Guest Profile Summary for Langford
- The typical guest profile for Airbnb in Langford consists of primarily domestic travelers (71%), often arriving from nearby Vancouver, typically belonging to the Post-2000s (Gen Z/Alpha) group (50%), primarily speaking English or French.
- Domestic travelers account for 70.9% of guests.
- Key international markets include Canada (70.9%) and United States (17.9%).
- Top languages spoken are English (62.7%) followed by French (8.2%).
- A significant demographic segment is the Post-2000s (Gen Z/Alpha) group, representing 50% of guests.
Recommendations for Hosts
- Target domestic marketing efforts towards travelers from Vancouver and Calgary.
- Tailor amenities and listing descriptions to appeal to the dominant Post-2000s (Gen Z/Alpha) demographic (e.g., highlight fast WiFi, smart home features, local guides).
- Highlight unique local experiences or amenities relevant to the primary guest profile.
- Consider seasonal promotions aligned with peak travel times for key origin markets.
Nearby Short-Term Rental Market Comparison
How does the Langford Airbnb market stack up against its neighbors? Compare key performance metrics like average monthly revenue, ADR, and occupancy rates in surrounding areas to understand the broader regional STR landscape.
| Market | Active Properties | Monthly Revenue | Daily Rate | Avg. Occupancy |
|---|---|---|---|---|
| Erlands Point-Kitsap Lake | 11 | $6,325 | $353.76 | 56% |
| Lake Goodwin | 11 | $4,949 | $371.43 | 44% |
| Amanda Park | 10 | $4,780 | $425.06 | 46% |
| Cape George Colony Club | 10 | $4,770 | $257.49 | 59% |
| Allyn | 20 | $4,462 | $415.57 | 36% |
| Sudden Valley | 65 | $4,390 | $286.32 | 53% |
| Olalla | 14 | $4,279 | $288.96 | 53% |
| Orcas Island | 13 | $4,220 | $514.57 | 39% |
| Friday Harbor | 219 | $4,187 | $371.96 | 45% |
| Moclips | 110 | $4,108 | $367.54 | 39% |