Kent Airbnb Market Analysis 2025: Short Term Rental Data & Vacation Rental Statistics in British Columbia, Canada
Is Airbnb profitable in Kent in 2025? Explore comprehensive Airbnb analytics for Kent, British Columbia, Canada to uncover income potential. This 2025 STR market report for Kent, based on AirROI data from April 2024 to March 2025, reveals key trends in the niche market of 57 active listings.
Whether you're considering an Airbnb investment in Kent, optimizing your existing vacation rental, or exploring rental arbitrage opportunities, understanding the Kent Airbnb data is crucial. Navigating the high regulation landscape is key to maximizing your short term rental income potential. Let's dive into the specifics.
Key Kent Airbnb Performance Metrics Overview
Monthly Airbnb Revenue Variations & Income Potential in Kent (2025)
Understanding the monthly revenue variations for Airbnb listings in Kent is key to maximizing your short term rental income potential. Seasonality significantly impacts earnings. Our analysis, based on data from the past 12 months, shows that the peak revenue month for STRs in Kent is typically July, while January often presents the lowest earnings, highlighting opportunities for strategic pricing adjustments during shoulder and low seasons. Explore the typical Airbnb income in Kent across different performance tiers:
- Best-in-class properties (Top 10%) achieve $7,717+ monthly, often utilizing dynamic pricing and superior guest experiences.
- Strong performing properties (Top 25%) earn $4,626 or more, indicating effective management and desirable locations/amenities.
- Typical properties (Median) generate around $2,479 per month, representing the average market performance.
- Entry-level properties (Bottom 25%) see earnings around $1,034, often with potential for optimization.
Average Monthly Airbnb Earnings Trend in Kent
Kent Airbnb Occupancy Rate Trends (2025)
Maximize your bookings by understanding the Kent STR occupancy trends. Seasonal demand shifts significantly influence how often properties are booked. Typically, Augustsees the highest demand (peak season occupancy), while January experiences the lowest (low season). Effective strategies, like adjusting minimum stays or offering promotions, can boost occupancy during slower periods. Here's how different property tiers perform in Kent:
- Best-in-class properties (Top 10%) achieve 68%+ occupancy, indicating high desirability and potentially optimized availability.
- Strong performing properties (Top 25%) maintain 50% or higher occupancy, suggesting good market fit and guest satisfaction.
- Typical properties (Median) have an occupancy rate around 35%.
- Entry-level properties (Bottom 25%) average 17% occupancy, potentially facing higher vacancy.
Average Monthly Occupancy Rate Trend in Kent
Average Daily Rate (ADR) Airbnb Trends in Kent (2025)
Effective short term rental pricing strategy in Kent involves understanding monthly ADR fluctuations. The Average Daily Rate (ADR) for Airbnb in Kent typically peaks in December and dips lowest during April. Leveraging Airbnb dynamic pricing tools or strategies based on this seasonality can significantly boost revenue. Here's a look at the typical nightly rates achieved:
- Best-in-class properties (Top 10%) command rates of $579+ per night, often due to premium features or locations.
- Strong performing properties (Top 25%) achieve nightly rates of $336 or more.
- Typical properties (Median) charge around $184 per night.
- Entry-level properties (Bottom 25%) earn around $116 per night.
Average Daily Rate (ADR) Trend by Month in Kent
Get Live Kent Market Intelligence 👇

Explore Real-time Analytics
Airbnb Seasonality Analysis & Trends in Kent (2025)
Peak Season (July, August, June)
- Revenue averages $4,836 per month
- Occupancy rates average 49.7%
- Daily rates average $260
Shoulder Season
- Revenue averages $3,351 per month
- Occupancy maintains around 35.5%
- Daily rates hold near $261
Low Season (January, February, March)
- Revenue drops to average $2,315 per month
- Occupancy decreases to average 26.4%
- Daily rates adjust to average $274
Seasonality Insights for Kent
- The Airbnb seasonality in Kent shows highly seasonal trends requiring careful strategy. While the sections above show seasonal averages, it's also insightful to look at the extremes:
- During the high season, the absolute peak month showcases Kent's highest earning potential, with monthly revenues capable of climbing to $5,053, occupancy reaching a high of 59.7%, and ADRs peaking at $280.
- Conversely, the slowest single month of the year, typically falling within the low season, marks the market's lowest point. In this month, revenue might dip to $1,861, occupancy could drop to 23.6%, and ADRs may adjust down to $249.
- Understanding both the seasonal averages and these monthly peaks and troughs in revenue, occupancy, and ADR is crucial for maximizing your Airbnb profit potential in Kent.
Seasonal Strategies for Maximizing Profit
- Peak Season: Maximize revenue through premium pricing and potentially longer minimum stays. Ensure high availability.
- Low Season: Offer competitive pricing, special promotions (e.g., extended stay discounts), and flexible cancellation policies. Target off-season travelers like remote workers or budget-conscious guests.
- Shoulder Seasons: Implement dynamic pricing that balances peak and low rates. Target weekend travelers or specific events. Offer slightly more flexible terms than peak season.
- Regularly analyze your own performance against these Kent seasonality benchmarks and adjust your pricing and availability strategy accordingly.
Best Areas for Airbnb Investment in Kent (2025)
Exploring the top neighborhoods for short-term rentals in Kent? This section highlights key areas, outlining why they are attractive for hosts and guests, along with notable local attractions. Consider these locations based on your target guest profile and investment strategy.
| Neighborhood / Area | Why Host Here? (Target Guests & Appeal) | Key Attractions & Landmarks |
|---|---|---|
| Downtown Kent | The bustling heart of Kent with a mix of residential and commercial properties. Close proximity to shops, restaurants, and public transport makes it a desirable location for both tourists and business travelers. | Kent Valley Ice Center, Kent Station, ShoWare Center, Cedar River Trail, Lake Meridian Park |
| Kent East Hill | A residential neighborhood that offers beautiful views and parks. Ideal for families and visitors looking for a quieter stay yet still near urban amenities. | Cedar Downs Dog Park, East Hill Park, Kent Commons, Green River Natural Resources Area, Mill Creek Canyon Earthworks |
| West Hill Kent | Known for its picturesque landscapes and access to natural parks, this area attracts visitors seeking outdoor adventures and relaxation in nature. | Soos Creek Trail, Lake Wilderness Park, Clark Lake, Mason Lake, Mason County Historical Society |
| Kent Valley | An industrial and commercial hub with a variety of businesses and events throughout the year. It draws visitors for conventions and business trips. | Kent Valley Ice Center, Evergreen State Fairgrounds, Kent Farmers Market, Kent Station, ShoWare Center |
| Panther Lake | A serene lakeside community perfect for those seeking nature. Its proximity to water activities makes it a desirable spot for vacationers. | Panther Lake, Lake Meridian, Green River Natural Resources Area, Cedar River Trail, West Fenwick Park |
| Cascade | A scenic neighborhood surrounded by parks and schools, appealing to families and those looking for a community feel with good amenities. | Cascade Park, Cedar River Trail, Sparks Stadium, Alderbrook Park, Kent Sports and Events Center |
| Crestview | A charming neighborhood known for its tight-knit community and local parks, making it an attractive option for visitors looking for a homey experience. | Crestview Park, Mill Creek Canyon Earthworks, Kent Memorial Park, Kent Skate Park, Rose Hill Park |
| Lake Meridian | A beautiful residential area known for its peaceful surroundings and recreational activities, great for families and those seeking a relaxing getaway. | Lake Meridian Park, Meridian Valley Country Club, Green River Natural Resources Area, Cedar River Trail, Sparks Stadium |
Understanding Airbnb License Requirements & STR Laws in Kent (2025)
Yes, Kent, British Columbia, Canada enforces high STR regulations. Obtaining a license and ensuring compliance is almost certainly required according to current 2025 STR laws. Always verify the latest short term rental regulations and Airbnb license requirements directly with local government authorities for Kent to ensure full compliance before hosting.
(Source: AirROI data, 2025, based on 47% licensed listings)
Top Performing Airbnb Properties in Kent (2025)
Benchmark your potential! Explore examples of top-performing Airbnb properties in Kentbased on Trailing Twelve Month (TTM) revenue. Analyze their characteristics, revenue, occupancy rate, and ADR to understand what drives success in this market.

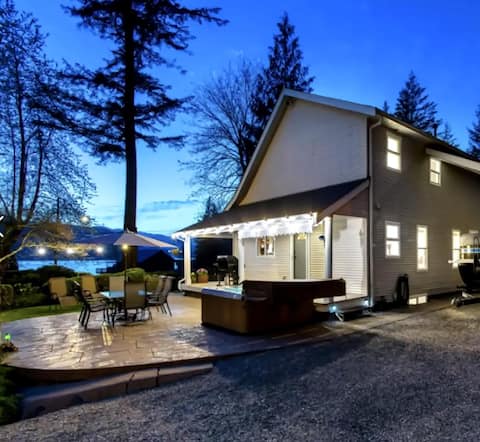
Mountain View Home w/ 4 Bedrooms & Private Hot Tub
Entire Place • 4 bedrooms

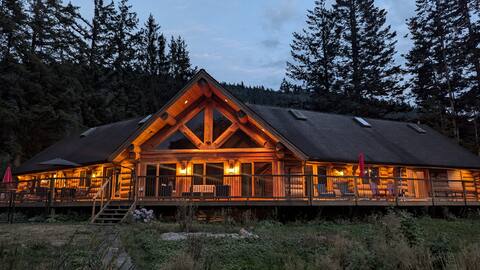
"The Lodge on Harrison Lake" Main Residence
Entire Place • 5 bedrooms
Waterfront Retreat with Hottub on Harrison Lake
Entire Place • 3 bedrooms
Opulent Oaks Chalet
Entire Place • 5 bedrooms

The Overlook | Luxury Lakeside Home with Dock
Entire Place • 3 bedrooms

Waterfront Luxury Home on Harrison Lake
Entire Place • 5 bedrooms
Note: Performance varies based on location, size, amenities, seasonality, and management quality. Data reflects the past 12 months.
Top Performing Airbnb Hosts in Kent (2025)
Learn from the best! This table showcases top-performing Airbnb hosts in Kent based on the number of properties managed and estimated total revenue over the past year. Analyze their scale and performance metrics.
| Host Name | Properties | Grossing Revenue | Stay Reviews | Avg Rating |
|---|---|---|---|---|
| Jason | 8 | $377,796 | 194 | 4.87/5.0 |
| Lodge Team | 9 | $338,877 | 135 | 3.84/5.0 |
| En Ees | 2 | $93,036 | 14 | 2.50/5.0 |
| Akash Alex | 2 | $81,472 | 45 | 4.89/5.0 |
| Mahdi | 1 | $77,820 | 12 | 5.00/5.0 |
| Connor | 1 | $70,363 | 63 | 4.95/5.0 |
| Host #231145950 | 1 | $69,743 | 126 | 4.89/5.0 |
| Alex | 1 | $65,710 | 342 | 4.84/5.0 |
| Warren | 4 | $62,119 | 120 | 4.79/5.0 |
| Dezarae | 1 | $53,392 | 221 | 4.98/5.0 |
Analyzing the strategies of top hosts, such as their property selection, pricing, and guest communication, can offer valuable lessons for optimizing your own Airbnb operations in Kent.
Dive Deeper: Advanced Kent STR Market Data (2025)
Ready to unlock more insights? AirROI provides access to advanced metrics and comprehensive Airbnb data for Kent. Explore detailed analytics beyond this report to refine your investment strategy, optimize pricing, and maximize your vacation rental profits.
Explore Advanced MetricsKent Short-Term Rental Market Composition (2025): Property & Room Types
Room Type Distribution
Property Type Distribution
Market Composition Insights for Kent
- The Kent Airbnb market composition is heavily skewed towards Entire Home/Apt listings, which make up 77.2% of the 57 active rentals. This indicates strong guest preference for privacy and space.
- Looking at the property type distribution in Kent, Outdoor/Unique properties are the most common (36.8%), reflecting the local real estate landscape.
- Houses represent a significant 29.8% portion, catering likely to families or larger groups.
- The presence of 14% Hotel/Boutique listings indicates integration with traditional hospitality.
- Smaller segments like unique stays (combined 3.5%) offer potential for unique stay experiences.
Kent Airbnb Room Capacity Analysis (2025): Bedroom Distribution
Distribution of Listings by Number of Bedrooms
Room Capacity Insights for Kent
- The dominant room capacity in Kent is 1 bedroom listings, making up 40.4% of the market. This suggests a strong demand for properties suitable for couples or solo travelers.
- Together, 1 bedroom and 2 bedrooms properties represent 63.2% of the active Airbnb listings in Kent, indicating a high concentration in these sizes.
- A significant 28.1% of listings offer 3+ bedrooms, catering to larger groups and families seeking more space in Kent.
Kent Vacation Rental Guest Capacity Trends (2025)
Distribution of Listings by Guest Capacity
Guest Capacity Insights for Kent
- The most common guest capacity trend in Kent vacation rentals is listings accommodating 8+ guests (24.6%). This suggests the primary traveler segment is likely larger groups.
- Properties designed for 8+ guests and 2 guests dominate the Kent STR market, accounting for 47.4% of listings.
- 40.4% of properties accommodate 6+ guests, serving the market segment for larger families or group travel in Kent.
- On average, properties in Kent are equipped to host 4.6 guests.
Kent Airbnb Booking Patterns (2025): Available vs. Booked Days
Available Days Distribution
Booked Days Distribution
Booking Pattern Insights for Kent
- The most common availability pattern in Kent falls within the 271-366 days range, representing 49.1% of listings. This suggests many properties have significant open periods on their calendars.
- Approximately 85.9% of listings show high availability (181+ days open annually), indicating potential for increased bookings or specific owner usage patterns.
- For booked days, the 91-180 days range is most frequent in Kent (38.6%), reflecting common guest stay durations or potential owner blocking patterns.
- A notable 15.8% of properties secure long booking periods (181+ days booked per year), highlighting successful long-term rental strategies or significant owner usage.
Kent Airbnb Minimum Stay Requirements Analysis
Distribution of Listings by Minimum Night Requirement
1 Night
31 listings
58.5% of total
2 Nights
15 listings
28.3% of total
3 Nights
1 listings
1.9% of total
4-6 Nights
1 listings
1.9% of total
7-29 Nights
1 listings
1.9% of total
30+ Nights
4 listings
7.5% of total
Key Insights
- The most prevalent minimum stay requirement in Kent is 1 Night, adopted by 58.5% of listings. This highlights the market's preference for shorter, flexible bookings.
- A strong majority (86.8%) of the Kent Airbnb data shows acceptance of very short stays (1-2 nights), indicating a dynamic, high-turnover market.
Recommendations
- Align with the market by considering a 1 Night minimum stay, as 58.5% of Kent hosts use this setting.
- Explore offering discounts for stays of 30+ nights to attract the 7.5% of the market seeking extended stays.
- Adjust minimum nights based on seasonality – potentially shorter during low season and longer during peak demand periods in Kent.
Kent Airbnb Cancellation Policy Trends Analysis (2025)
Flexible
4 listings
7.7% of total
Moderate
10 listings
19.2% of total
Firm
12 listings
23.1% of total
Strict
26 listings
50% of total
Cancellation Policy Insights for Kent
- The prevailing Airbnb cancellation policy trend in Kent is Strict, used by 50% of listings.
- A majority (73.1%) of hosts in Kent utilize Firm or Strict policies, indicating a market where hosts prioritize booking security.
Recommendations for Hosts
- Consider adopting a Strict policy to align with the 50% market standard in Kent.
- With 50% using Strict terms, this is a viable option in Kent, particularly for high-value properties or during peak demand periods.
- Regularly review your cancellation policy against competitors and market demand shifts in Kent.
Kent STR Booking Lead Time Analysis (2025)
Average Booking Lead Time by Month
Booking Lead Time Insights for Kent
- The overall average booking lead time for vacation rentals in Kent is 50 days.
- Guests book furthest in advance for stays during May (average 101 days), likely coinciding with peak travel demand or local events.
- The shortest booking windows occur for stays in January (average 19 days), indicating more last-minute travel plans during this time.
- Seasonally, Summer (74 days avg.) sees the longest lead times, while Winter (34 days avg.) has the shortest, reflecting typical travel planning cycles.
Recommendations for Hosts
- Use the overall average lead time (50 days) as a baseline for your pricing and availability strategy in Kent.
- For May stays, consider implementing length-of-stay discounts or slightly higher rates for bookings made less than 101 days out to capitalize on advance planning.
- Target marketing efforts for the Summer season well in advance (at least 74 days) to capture early planners.
- Monitor your own booking lead times against these Kent averages to identify opportunities for dynamic pricing adjustments.
Popular & Essential Airbnb Amenities in Kent (2025)
Amenity Prevalence
Amenity Insights for Kent
- Essential amenities in Kent that guests expect include: Wifi, Smoke alarm, Heating, Free parking on premises, Hot water. Lacking these (any) could significantly impact bookings.
- Popular amenities like TV, Fire extinguisher, Carbon monoxide alarm are common but not universal. Offering these can provide a competitive edge.
Recommendations for Hosts
- Ensure your listing includes all essential amenities for Kent: Wifi, Smoke alarm, Heating, Free parking on premises, Hot water.
- Prioritize adding missing essentials: Heating, Free parking on premises, Hot water.
- Consider adding popular differentiators like TV or Fire extinguisher to increase appeal.
- Highlight unique or less common amenities you offer (e.g., hot tub, dedicated workspace, EV charger) in your listing description and photos.
- Regularly check competitor amenities in Kent to stay competitive.
Kent Airbnb Guest Demographics & Profile Analysis (2025)
Guest Profile Summary for Kent
- The typical guest profile for Airbnb in Kent consists of primarily domestic travelers (78%), often arriving from nearby Vancouver, typically belonging to the Post-2000s (Gen Z/Alpha) group (50%), primarily speaking English or French.
- Domestic travelers account for 78.4% of guests.
- Key international markets include Canada (78.4%) and United States (13%).
- Top languages spoken are English (66.7%) followed by French (7.7%).
- A significant demographic segment is the Post-2000s (Gen Z/Alpha) group, representing 50% of guests.
Recommendations for Hosts
- Target domestic marketing efforts towards travelers from Vancouver and Surrey.
- Tailor amenities and listing descriptions to appeal to the dominant Post-2000s (Gen Z/Alpha) demographic (e.g., highlight fast WiFi, smart home features, local guides).
- Highlight unique local experiences or amenities relevant to the primary guest profile.
- Consider seasonal promotions aligned with peak travel times for key origin markets.
Nearby Short-Term Rental Market Comparison
How does the Kent Airbnb market stack up against its neighbors? Compare key performance metrics like average monthly revenue, ADR, and occupancy rates in surrounding areas to understand the broader regional STR landscape.
| Market | Active Properties | Monthly Revenue | Daily Rate | Avg. Occupancy |
|---|---|---|---|---|
| Canyon Creek | 10 | $6,420 | $303.37 | 59% |
| Lake Goodwin | 11 | $4,949 | $371.43 | 44% |
| Verlot | 11 | $4,787 | $255.29 | 61% |
| Cape George Colony Club | 10 | $4,770 | $257.49 | 59% |
| Sudden Valley | 65 | $4,390 | $286.32 | 53% |
| Mazama | 31 | $4,302 | $323.03 | 46% |
| Orcas Island | 13 | $4,220 | $514.57 | 39% |
| Eastsound | 260 | $4,048 | $335.49 | 43% |
| Lopez Island | 40 | $4,002 | $343.46 | 41% |
| Oak Harbor | 128 | $3,944 | $279.04 | 49% |