Area D (Texada Island) Airbnb Market Analysis 2025: Short Term Rental Data & Vacation Rental Statistics in British Columbia, Canada
Is Airbnb profitable in Area D (Texada Island) in 2025? Explore comprehensive Airbnb analytics for Area D (Texada Island), British Columbia, Canada to uncover income potential. This 2025 STR market report for Area D (Texada Island), based on AirROI data from April 2024 to March 2025, reveals key trends in the niche market of 18 active listings.
Whether you're considering an Airbnb investment in Area D (Texada Island), optimizing your existing vacation rental, or exploring rental arbitrage opportunities, understanding the Area D (Texada Island) Airbnb data is crucial. Leveraging the low regulation environment is key to maximizing your short term rental income potential. Let's dive into the specifics.
Key Area D (Texada Island) Airbnb Performance Metrics Overview
Monthly Airbnb Revenue Variations & Income Potential in Area D (Texada Island) (2025)
Understanding the monthly revenue variations for Airbnb listings in Area D (Texada Island) is key to maximizing your short term rental income potential. Seasonality significantly impacts earnings. Our analysis, based on data from the past 12 months, shows that the peak revenue month for STRs in Area D (Texada Island) is typically August, while February often presents the lowest earnings, highlighting opportunities for strategic pricing adjustments during shoulder and low seasons. Explore the typical Airbnb income in Area D (Texada Island) across different performance tiers:
- Best-in-class properties (Top 10%) achieve $4,310+ monthly, often utilizing dynamic pricing and superior guest experiences.
- Strong performing properties (Top 25%) earn $2,730 or more, indicating effective management and desirable locations/amenities.
- Typical properties (Median) generate around $1,532 per month, representing the average market performance.
- Entry-level properties (Bottom 25%) see earnings around $908, often with potential for optimization.
Average Monthly Airbnb Earnings Trend in Area D (Texada Island)
Area D (Texada Island) Airbnb Occupancy Rate Trends (2025)
Maximize your bookings by understanding the Area D (Texada Island) STR occupancy trends. Seasonal demand shifts significantly influence how often properties are booked. Typically, Augustsees the highest demand (peak season occupancy), while February experiences the lowest (low season). Effective strategies, like adjusting minimum stays or offering promotions, can boost occupancy during slower periods. Here's how different property tiers perform in Area D (Texada Island):
- Best-in-class properties (Top 10%) achieve 69%+ occupancy, indicating high desirability and potentially optimized availability.
- Strong performing properties (Top 25%) maintain 51% or higher occupancy, suggesting good market fit and guest satisfaction.
- Typical properties (Median) have an occupancy rate around 30%.
- Entry-level properties (Bottom 25%) average 17% occupancy, potentially facing higher vacancy.
Average Monthly Occupancy Rate Trend in Area D (Texada Island)
Average Daily Rate (ADR) Airbnb Trends in Area D (Texada Island) (2025)
Effective short term rental pricing strategy in Area D (Texada Island) involves understanding monthly ADR fluctuations. The Average Daily Rate (ADR) for Airbnb in Area D (Texada Island) typically peaks in November and dips lowest during April. Leveraging Airbnb dynamic pricing tools or strategies based on this seasonality can significantly boost revenue. Here's a look at the typical nightly rates achieved:
- Best-in-class properties (Top 10%) command rates of $240+ per night, often due to premium features or locations.
- Strong performing properties (Top 25%) achieve nightly rates of $223 or more.
- Typical properties (Median) charge around $158 per night.
- Entry-level properties (Bottom 25%) earn around $126 per night.
Average Daily Rate (ADR) Trend by Month in Area D (Texada Island)
Get Live Area D (Texada Island) Market Intelligence 👇
.png)
Explore Real-time Analytics
Airbnb Seasonality Analysis & Trends in Area D (Texada Island) (2025)
Peak Season (August, July, June)
- Revenue averages $3,131 per month
- Occupancy rates average 51.6%
- Daily rates average $169
Shoulder Season
- Revenue averages $1,983 per month
- Occupancy maintains around 36.0%
- Daily rates hold near $166
Low Season (February, March, October)
- Revenue drops to average $1,160 per month
- Occupancy decreases to average 23.3%
- Daily rates adjust to average $164
Seasonality Insights for Area D (Texada Island)
- The Airbnb seasonality in Area D (Texada Island) shows highly seasonal trends requiring careful strategy. While the sections above show seasonal averages, it's also insightful to look at the extremes:
- During the high season, the absolute peak month showcases Area D (Texada Island)'s highest earning potential, with monthly revenues capable of climbing to $3,557, occupancy reaching a high of 59.2%, and ADRs peaking at $173.
- Conversely, the slowest single month of the year, typically falling within the low season, marks the market's lowest point. In this month, revenue might dip to $887, occupancy could drop to 18.8%, and ADRs may adjust down to $160.
- Understanding both the seasonal averages and these monthly peaks and troughs in revenue, occupancy, and ADR is crucial for maximizing your Airbnb profit potential in Area D (Texada Island).
Seasonal Strategies for Maximizing Profit
- Peak Season: Maximize revenue through premium pricing and potentially longer minimum stays. Ensure high availability.
- Low Season: Offer competitive pricing, special promotions (e.g., extended stay discounts), and flexible cancellation policies. Target off-season travelers like remote workers or budget-conscious guests.
- Shoulder Seasons: Implement dynamic pricing that balances peak and low rates. Target weekend travelers or specific events. Offer slightly more flexible terms than peak season.
- Regularly analyze your own performance against these Area D (Texada Island) seasonality benchmarks and adjust your pricing and availability strategy accordingly.
Best Areas for Airbnb Investment in Area D (Texada Island) (2025)
Exploring the top neighborhoods for short-term rentals in Area D (Texada Island)? This section highlights key areas, outlining why they are attractive for hosts and guests, along with notable local attractions. Consider these locations based on your target guest profile and investment strategy.
| Neighborhood / Area | Why Host Here? (Target Guests & Appeal) | Key Attractions & Landmarks |
|---|---|---|
| Van Anda | Quaint village known for its charming waterfront and access to beautiful beaches. Ideal for visitors seeking a serene getaway in nature away from the hustle of city life. | Texada Island Heritage Centre, Lund Harbour, Van Anda Elementary School, Naylor Bay, Alan Lake |
| Gillies Bay | A picturesque community offering beautiful beaches and outdoor recreational opportunities. Great for families and nature enthusiasts looking for a peaceful retreat. | Gillies Bay Beach, Texada Island Golf Club, Backeddy Marine Pub, Abandoned mines, Hiking trails |
| Cottonwood Bay | Offers stunning natural beauty and access to pristine beaches, perfect for relaxation and nature walks. A hidden gem for those looking to escape. | Cottonwood Bay Beach, Hiking areas, Wildlife viewing, Kayaking opportunities, Fishing spots |
| Blubber Bay | Home to the ferry terminal, this area is bustling with access to transport and beautiful coastal views. Suitable for travelers looking to explore the island. | Blubber Bay Beach, Ferry terminal, Scenic views, Sea kayak rentals, Local dining options |
| North Texada | A tranquil region known for its rugged coastlines and scenic vistas. Ideal for outdoor activities and a quiet retreat into nature. | Rugged coastlines, Hiking trails, Fishing, Wildlife photography, Natural parks |
| South Texada | A laid-back area with access to stunning shores and outdoor activities. Excellent for those seeking a getaway with opportunities for exploration. | Remote beaches, Lush forests, Camping sites, Nature trails, Local wildlife |
| Keats Island | A nearby island that's often visited by those staying in Texada. Offers a beautiful escape with its quiet charm and natural beauty. | Keats Island beaches, Hiking paths, Nature reserves, Kayaking, Relaxing atmospheres |
| General Locations | Texada Island's diverse areas offer unique experiences and attractions, perfect for hosting Airbnbs to cater to various types of tourists, from adventure seekers to those just wanting to unwind. | Various local attractions, Outdoor activities, Cultural experiences, Community events, Nature exploration |
Understanding Airbnb License Requirements & STR Laws in Area D (Texada Island) (2025)
While Area D (Texada Island), British Columbia, Canada currently shows low STR regulations, specific Airbnb license requirements might still exist or change. Always verify the latest short term rental regulations and Airbnb license requirements directly with local government authorities for Area D (Texada Island) to ensure full compliance before hosting.
(Source: AirROI data, 2025, finding no licensed listings among those analyzed)
Top Performing Airbnb Properties in Area D (Texada Island) (2025)
Benchmark your potential! Explore examples of top-performing Airbnb properties in Area D (Texada Island)based on Trailing Twelve Month (TTM) revenue. Analyze their characteristics, revenue, occupancy rate, and ADR to understand what drives success in this market.
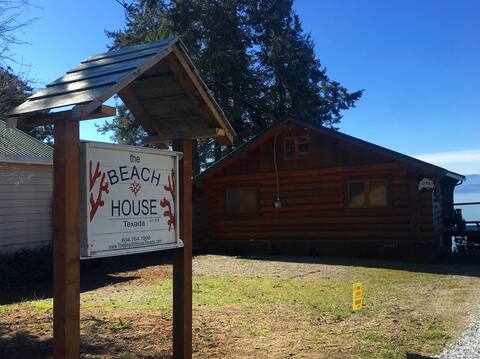
Waterfront standalone cabin-The BeachHouse Texada!
Entire Place • 3 bedrooms

Unique Log Home with Views & Hot Tub. 1 to 6 BR
Entire Place • 6 bedrooms
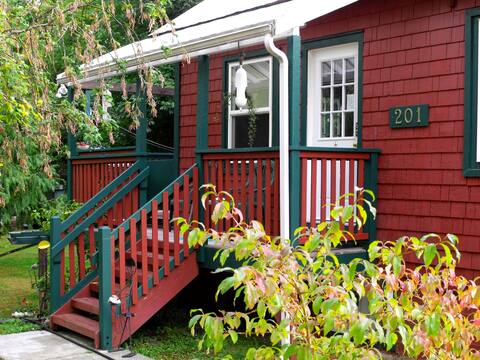
Texada Vacation Rental, Texada Is.
Entire Place • 3 bedrooms

Bayview Village Blue Unit 4812 Alder Avenue
Entire Place • 2 bedrooms

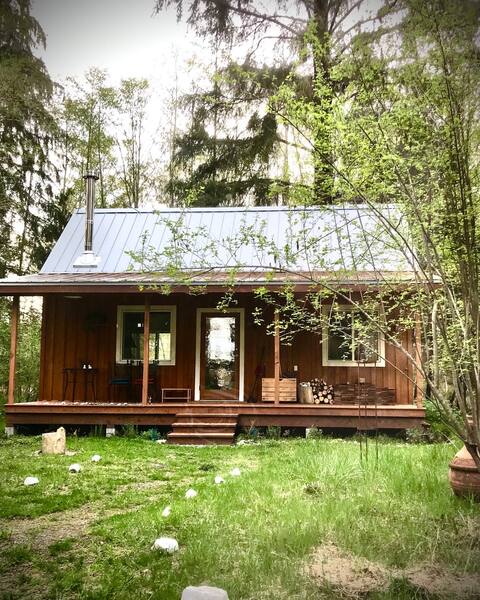
Escape to Seascapes on Texada
Entire Place • 3 bedrooms
H(e)art House Beside the Sea
Entire Place • 2 bedrooms
Note: Performance varies based on location, size, amenities, seasonality, and management quality. Data reflects the past 12 months.
Top Performing Airbnb Hosts in Area D (Texada Island) (2025)
Learn from the best! This table showcases top-performing Airbnb hosts in Area D (Texada Island) based on the number of properties managed and estimated total revenue over the past year. Analyze their scale and performance metrics.
| Host Name | Properties | Grossing Revenue | Stay Reviews | Avg Rating |
|---|---|---|---|---|
| Martin | 4 | $57,375 | 16 | 3.75/5.0 |
| Jonathan | 2 | $47,807 | 151 | 4.72/5.0 |
| Nicole | 1 | $47,214 | 158 | 4.82/5.0 |
| Bob | 1 | $27,662 | 192 | 4.86/5.0 |
| Judy | 1 | $26,070 | 14 | 4.86/5.0 |
| Anita | 1 | $24,363 | 25 | 4.88/5.0 |
| Janice | 1 | $21,551 | 64 | 4.92/5.0 |
| Tara | 1 | $17,723 | 6 | 5.00/5.0 |
| Jason | 1 | $15,329 | 26 | 5.00/5.0 |
| Nic | 1 | $14,984 | 48 | 4.85/5.0 |
Analyzing the strategies of top hosts, such as their property selection, pricing, and guest communication, can offer valuable lessons for optimizing your own Airbnb operations in Area D (Texada Island).
Dive Deeper: Advanced Area D (Texada Island) STR Market Data (2025)
Ready to unlock more insights? AirROI provides access to advanced metrics and comprehensive Airbnb data for Area D (Texada Island). Explore detailed analytics beyond this report to refine your investment strategy, optimize pricing, and maximize your vacation rental profits.
Explore Advanced MetricsArea D (Texada Island) Short-Term Rental Market Composition (2025): Property & Room Types
Room Type Distribution
Property Type Distribution
Market Composition Insights for Area D (Texada Island)
- The Area D (Texada Island) Airbnb market composition is heavily skewed towards Entire Home/Apt listings, which make up 100% of the 18 active rentals. This indicates strong guest preference for privacy and space.
- Looking at the property type distribution in Area D (Texada Island), House properties are the most common (50%), reflecting the local real estate landscape.
- Houses represent a significant 50% portion, catering likely to families or larger groups.
Area D (Texada Island) Airbnb Room Capacity Analysis (2025): Bedroom Distribution
Distribution of Listings by Number of Bedrooms
Room Capacity Insights for Area D (Texada Island)
- The dominant room capacity in Area D (Texada Island) is 3 bedrooms listings, making up 33.3% of the market. This suggests a strong demand for properties suitable for families or small groups.
- Together, 3 bedrooms and 1 bedroom properties represent 61.1% of the active Airbnb listings in Area D (Texada Island), indicating a high concentration in these sizes.
- A significant 38.9% of listings offer 3+ bedrooms, catering to larger groups and families seeking more space in Area D (Texada Island).
Area D (Texada Island) Vacation Rental Guest Capacity Trends (2025)
Distribution of Listings by Guest Capacity
Guest Capacity Insights for Area D (Texada Island)
- The most common guest capacity trend in Area D (Texada Island) vacation rentals is listings accommodating 2 guests (22.2%). This suggests the primary traveler segment is likely couples or solo travelers.
- Properties designed for 2 guests and 6 guests dominate the Area D (Texada Island) STR market, accounting for 44.4% of listings.
- 38.9% of properties accommodate 6+ guests, serving the market segment for larger families or group travel in Area D (Texada Island).
- On average, properties in Area D (Texada Island) are equipped to host 4.7 guests.
Area D (Texada Island) Airbnb Booking Patterns (2025): Available vs. Booked Days
Available Days Distribution
Booked Days Distribution
Booking Pattern Insights for Area D (Texada Island)
- The most common availability pattern in Area D (Texada Island) falls within the 271-366 days range, representing 50% of listings. This suggests many properties have significant open periods on their calendars.
- Approximately 77.8% of listings show high availability (181+ days open annually), indicating potential for increased bookings or specific owner usage patterns.
- For booked days, the 91-180 days range is most frequent in Area D (Texada Island) (38.9%), reflecting common guest stay durations or potential owner blocking patterns.
- A notable 22.2% of properties secure long booking periods (181+ days booked per year), highlighting successful long-term rental strategies or significant owner usage.
Area D (Texada Island) Airbnb Minimum Stay Requirements Analysis
Distribution of Listings by Minimum Night Requirement
1 Night
6 listings
35.3% of total
2 Nights
7 listings
41.2% of total
3 Nights
1 listings
5.9% of total
4-6 Nights
1 listings
5.9% of total
30+ Nights
2 listings
11.8% of total
Key Insights
- The most prevalent minimum stay requirement in Area D (Texada Island) is 2 Nights, adopted by 41.2% of listings. This highlights the market's preference for shorter, flexible bookings.
- A strong majority (76.5%) of the Area D (Texada Island) Airbnb data shows acceptance of very short stays (1-2 nights), indicating a dynamic, high-turnover market.
- A significant segment (11.8%) caters to monthly stays (30+ nights) in Area D (Texada Island), pointing to opportunities in the extended-stay market.
Recommendations
- Align with the market by considering a 2 Nights minimum stay, as 41.2% of Area D (Texada Island) hosts use this setting.
- Explore offering discounts for stays of 30+ nights to attract the 11.8% of the market seeking extended stays.
- Adjust minimum nights based on seasonality – potentially shorter during low season and longer during peak demand periods in Area D (Texada Island).
Area D (Texada Island) Airbnb Cancellation Policy Trends Analysis (2025)
Flexible
6 listings
37.5% of total
Moderate
3 listings
18.8% of total
Firm
7 listings
43.8% of total
Cancellation Policy Insights for Area D (Texada Island)
- The prevailing Airbnb cancellation policy trend in Area D (Texada Island) is Firm, used by 43.8% of listings.
- There's a relatively balanced mix between guest-friendly (56.3%) and stricter (43.8%) policies, offering choices for different guest needs.
Recommendations for Hosts
- Consider adopting a Firm policy to align with the 43.8% market standard in Area D (Texada Island).
- Regularly review your cancellation policy against competitors and market demand shifts in Area D (Texada Island).
Area D (Texada Island) STR Booking Lead Time Analysis (2025)
Average Booking Lead Time by Month
Booking Lead Time Insights for Area D (Texada Island)
- The overall average booking lead time for vacation rentals in Area D (Texada Island) is 50 days.
- Guests book furthest in advance for stays during July (average 114 days), likely coinciding with peak travel demand or local events.
- The shortest booking windows occur for stays in February (average 19 days), indicating more last-minute travel plans during this time.
- Seasonally, Summer (92 days avg.) sees the longest lead times, while Winter (27 days avg.) has the shortest, reflecting typical travel planning cycles.
Recommendations for Hosts
- Use the overall average lead time (50 days) as a baseline for your pricing and availability strategy in Area D (Texada Island).
- For July stays, consider implementing length-of-stay discounts or slightly higher rates for bookings made less than 114 days out to capitalize on advance planning.
- Target marketing efforts for the Summer season well in advance (at least 92 days) to capture early planners.
- Monitor your own booking lead times against these Area D (Texada Island) averages to identify opportunities for dynamic pricing adjustments.
Popular & Essential Airbnb Amenities in Area D (Texada Island) (2025)
Amenity Prevalence
Amenity Insights for Area D (Texada Island)
- Essential amenities in Area D (Texada Island) that guests expect include: Kitchen, Heating, Free parking on premises, Dishes and silverware. Lacking these (any) could significantly impact bookings.
- Popular amenities like Refrigerator, Smoke alarm, Coffee maker are common but not universal. Offering these can provide a competitive edge.
Recommendations for Hosts
- Ensure your listing includes all essential amenities for Area D (Texada Island): Kitchen, Heating, Free parking on premises, Dishes and silverware.
- Consider adding popular differentiators like Refrigerator or Smoke alarm to increase appeal.
- Highlight unique or less common amenities you offer (e.g., hot tub, dedicated workspace, EV charger) in your listing description and photos.
- Regularly check competitor amenities in Area D (Texada Island) to stay competitive.
Area D (Texada Island) Airbnb Guest Demographics & Profile Analysis (2025)
Guest Profile Summary for Area D (Texada Island)
- The typical guest profile for Airbnb in Area D (Texada Island) consists of primarily domestic travelers (94%), often arriving from nearby Vancouver, typically belonging to the Post-2000s (Gen Z/Alpha) group (50%), primarily speaking English or French.
- Domestic travelers account for 94.1% of guests.
- Key international markets include Canada (94.1%) and United States (2.5%).
- Top languages spoken are English (71.9%) followed by French (14%).
- A significant demographic segment is the Post-2000s (Gen Z/Alpha) group, representing 50% of guests.
Recommendations for Hosts
- Target domestic marketing efforts towards travelers from Vancouver and Victoria.
- Tailor amenities and listing descriptions to appeal to the dominant Post-2000s (Gen Z/Alpha) demographic (e.g., highlight fast WiFi, smart home features, local guides).
- Highlight unique local experiences or amenities relevant to the primary guest profile.
- Consider seasonal promotions aligned with peak travel times for key origin markets.
Nearby Short-Term Rental Market Comparison
How does the Area D (Texada Island) Airbnb market stack up against its neighbors? Compare key performance metrics like average monthly revenue, ADR, and occupancy rates in surrounding areas to understand the broader regional STR landscape.
| Market | Active Properties | Monthly Revenue | Daily Rate | Avg. Occupancy |
|---|---|---|---|---|
| Tofino | 331 | $4,937 | $285.11 | 57% |
| Friday Harbor | 219 | $4,187 | $371.96 | 45% |
| Ucluelet | 344 | $3,256 | $221.35 | 51% |
| Beaver | 14 | $3,205 | $245.01 | 54% |
| Area D (Elaho/Garibaldi) | 46 | $3,163 | $248.45 | 48% |
| Sekiu | 35 | $3,138 | $235.66 | 49% |
| Clallam Bay | 11 | $3,072 | $211.28 | 58% |
| Juan de Fuca Electoral Area | 300 | $3,025 | $226.57 | 48% |
| Sequim | 311 | $3,018 | $227.21 | 51% |
| Bowen Island Municipality | 134 | $2,987 | $207.24 | 58% |