Area D (Oyster Bay/Buttle Lake) Airbnb Market Analysis 2025: Short Term Rental Data & Vacation Rental Statistics in British Columbia, Canada
Is Airbnb profitable in Area D (Oyster Bay/Buttle Lake) in 2025? Explore comprehensive Airbnb analytics for Area D (Oyster Bay/Buttle Lake), British Columbia, Canada to uncover income potential. This 2025 STR market report for Area D (Oyster Bay/Buttle Lake), based on AirROI data from April 2024 to March 2025, reveals key trends in the niche market of 37 active listings.
Whether you're considering an Airbnb investment in Area D (Oyster Bay/Buttle Lake), optimizing your existing vacation rental, or exploring rental arbitrage opportunities, understanding the Area D (Oyster Bay/Buttle Lake) Airbnb data is crucial. Leveraging the low regulation environment is key to maximizing your short term rental income potential. Let's dive into the specifics.
Key Area D (Oyster Bay/Buttle Lake) Airbnb Performance Metrics Overview
Monthly Airbnb Revenue Variations & Income Potential in Area D (Oyster Bay/Buttle Lake) (2025)
Understanding the monthly revenue variations for Airbnb listings in Area D (Oyster Bay/Buttle Lake) is key to maximizing your short term rental income potential. Seasonality significantly impacts earnings. Our analysis, based on data from the past 12 months, shows that the peak revenue month for STRs in Area D (Oyster Bay/Buttle Lake) is typically August, while February often presents the lowest earnings, highlighting opportunities for strategic pricing adjustments during shoulder and low seasons. Explore the typical Airbnb income in Area D (Oyster Bay/Buttle Lake) across different performance tiers:
- Best-in-class properties (Top 10%) achieve $5,770+ monthly, often utilizing dynamic pricing and superior guest experiences.
- Strong performing properties (Top 25%) earn $3,645 or more, indicating effective management and desirable locations/amenities.
- Typical properties (Median) generate around $2,384 per month, representing the average market performance.
- Entry-level properties (Bottom 25%) see earnings around $1,304, often with potential for optimization.
Average Monthly Airbnb Earnings Trend in Area D (Oyster Bay/Buttle Lake)
Area D (Oyster Bay/Buttle Lake) Airbnb Occupancy Rate Trends (2025)
Maximize your bookings by understanding the Area D (Oyster Bay/Buttle Lake) STR occupancy trends. Seasonal demand shifts significantly influence how often properties are booked. Typically, Augustsees the highest demand (peak season occupancy), while January experiences the lowest (low season). Effective strategies, like adjusting minimum stays or offering promotions, can boost occupancy during slower periods. Here's how different property tiers perform in Area D (Oyster Bay/Buttle Lake):
- Best-in-class properties (Top 10%) achieve 78%+ occupancy, indicating high desirability and potentially optimized availability.
- Strong performing properties (Top 25%) maintain 68% or higher occupancy, suggesting good market fit and guest satisfaction.
- Typical properties (Median) have an occupancy rate around 53%.
- Entry-level properties (Bottom 25%) average 27% occupancy, potentially facing higher vacancy.
Average Monthly Occupancy Rate Trend in Area D (Oyster Bay/Buttle Lake)
Average Daily Rate (ADR) Airbnb Trends in Area D (Oyster Bay/Buttle Lake) (2025)
Effective short term rental pricing strategy in Area D (Oyster Bay/Buttle Lake) involves understanding monthly ADR fluctuations. The Average Daily Rate (ADR) for Airbnb in Area D (Oyster Bay/Buttle Lake) typically peaks in December and dips lowest during April. Leveraging Airbnb dynamic pricing tools or strategies based on this seasonality can significantly boost revenue. Here's a look at the typical nightly rates achieved:
- Best-in-class properties (Top 10%) command rates of $338+ per night, often due to premium features or locations.
- Strong performing properties (Top 25%) achieve nightly rates of $196 or more.
- Typical properties (Median) charge around $130 per night.
- Entry-level properties (Bottom 25%) earn around $98 per night.
Average Daily Rate (ADR) Trend by Month in Area D (Oyster Bay/Buttle Lake)
Get Live Area D (Oyster Bay/Buttle Lake) Market Intelligence 👇
.png)
Explore Real-time Analytics
Airbnb Seasonality Analysis & Trends in Area D (Oyster Bay/Buttle Lake) (2025)
Peak Season (August, July, September)
- Revenue averages $4,787 per month
- Occupancy rates average 67.2%
- Daily rates average $189
Shoulder Season
- Revenue averages $3,057 per month
- Occupancy maintains around 47.5%
- Daily rates hold near $179
Low Season (January, February, March)
- Revenue drops to average $1,781 per month
- Occupancy decreases to average 34.5%
- Daily rates adjust to average $188
Seasonality Insights for Area D (Oyster Bay/Buttle Lake)
- The Airbnb seasonality in Area D (Oyster Bay/Buttle Lake) shows highly seasonal trends requiring careful strategy. While the sections above show seasonal averages, it's also insightful to look at the extremes:
- During the high season, the absolute peak month showcases Area D (Oyster Bay/Buttle Lake)'s highest earning potential, with monthly revenues capable of climbing to $5,617, occupancy reaching a high of 72.8%, and ADRs peaking at $203.
- Conversely, the slowest single month of the year, typically falling within the low season, marks the market's lowest point. In this month, revenue might dip to $1,560, occupancy could drop to 30.9%, and ADRs may adjust down to $164.
- Understanding both the seasonal averages and these monthly peaks and troughs in revenue, occupancy, and ADR is crucial for maximizing your Airbnb profit potential in Area D (Oyster Bay/Buttle Lake).
Seasonal Strategies for Maximizing Profit
- Peak Season: Maximize revenue through premium pricing and potentially longer minimum stays. Ensure high availability.
- Low Season: Offer competitive pricing, special promotions (e.g., extended stay discounts), and flexible cancellation policies. Target off-season travelers like remote workers or budget-conscious guests.
- Shoulder Seasons: Implement dynamic pricing that balances peak and low rates. Target weekend travelers or specific events. Offer slightly more flexible terms than peak season.
- Regularly analyze your own performance against these Area D (Oyster Bay/Buttle Lake) seasonality benchmarks and adjust your pricing and availability strategy accordingly.
Best Areas for Airbnb Investment in Area D (Oyster Bay/Buttle Lake) (2025)
Exploring the top neighborhoods for short-term rentals in Area D (Oyster Bay/Buttle Lake)? This section highlights key areas, outlining why they are attractive for hosts and guests, along with notable local attractions. Consider these locations based on your target guest profile and investment strategy.
| Neighborhood / Area | Why Host Here? (Target Guests & Appeal) | Key Attractions & Landmarks |
|---|---|---|
| Oyster Bay | Quaint seaside community known for its beautiful waterfront views and outdoor activities. Ideal for families and nature lovers looking to unwind away from the city hustle. | Oyster Bay Provincial Park, Buttle Lake, Kootenay Rockies, local hiking trails, fishing and boating opportunities |
| Buttle Lake | Scenic lake destination offering various water sports and relaxation spots. Perfect for travelers seeking a tranquil environment surrounded by nature. | Buttle Lake Provincial Park, camping sites, fishing spots, swimming areas, hiking trails |
| Strathcona Provincial Park | Home to stunning mountain scenery and diverse wildlife. Great for adventure seekers and outdoor enthusiasts looking for leisure activities. | Elk River Trail, camping grounds, hiking routes, wildlife viewing, backcountry skiing |
| Campbell River | Nearby city known as the 'Salmon Capital of the World'. Offers urban amenities while close to nature, attracting both tourists and locals. | Discovery Fishing Pier, Museum at Campbell River, Cape Mudge Lighthouse, local restaurants, shopping areas |
| Cortes Island | Beautiful island known for its artistic community and scenic views. A peaceful retreat for travelers looking for a unique getaway experience. | Cortes Island Arts and Culture, Manson’s Lagoon, Smelt Bay Provincial Park, local markets, beaches |
| Quadra Island | Small island with rich indigenous culture and stunning coastal views. A perfect spot for those looking to escape to nature. | Rebecca Spit Marine Provincial Park, Hiking trails, local galleries, fishing spots, wildlife watching |
| Sayward | Charming community known for its rich history and proximity to natural landscapes. Attractive for those interested in local culture and outdoor exploration. | Sayward Heritage River Park, local dining, hiking routes, indigenous culture sites, fishing spots |
| Gold River | A small, vibrant community surrounded by beautiful scenery and outdoor adventures. Great for eco-tourism and nature lovers. | Gold River Marina, butte lake community, local shops, approach to Strathcona Park, hiking trails |
Understanding Airbnb License Requirements & STR Laws in Area D (Oyster Bay/Buttle Lake) (2025)
While Area D (Oyster Bay/Buttle Lake), British Columbia, Canada currently shows low STR regulations, specific Airbnb license requirements might still exist or change. Always verify the latest short term rental regulations and Airbnb license requirements directly with local government authorities for Area D (Oyster Bay/Buttle Lake) to ensure full compliance before hosting.
(Source: AirROI data, 2025, finding no licensed listings among those analyzed)
Top Performing Airbnb Properties in Area D (Oyster Bay/Buttle Lake) (2025)
Benchmark your potential! Explore examples of top-performing Airbnb properties in Area D (Oyster Bay/Buttle Lake)based on Trailing Twelve Month (TTM) revenue. Analyze their characteristics, revenue, occupancy rate, and ADR to understand what drives success in this market.
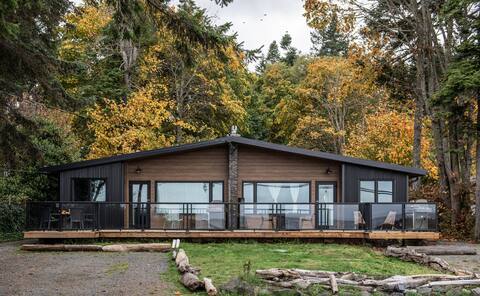
Sea, Sunrises, Sauna | Oceanfront Group Retreat
Entire Place • 6 bedrooms
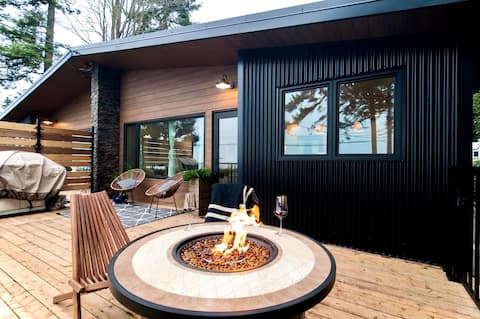
Sea,Sunrises,Sauna | Oceanfront Luxurious Retreat
Entire Place • 3 bedrooms

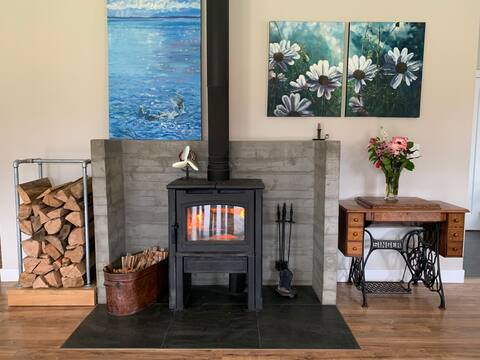
Sea,Sunrises,Sauna | Oceanfront Stylish Retreat
Entire Place • 3 bedrooms

Large Oceanfront House with Hot Tub!
Entire Place • 4 bedrooms
Modern 3bed Farmhouse w Hot Tub
Entire Place • 3 bedrooms

Waterfront West Coast Suite
Entire Place • N/A
Note: Performance varies based on location, size, amenities, seasonality, and management quality. Data reflects the past 12 months.
Top Performing Airbnb Hosts in Area D (Oyster Bay/Buttle Lake) (2025)
Learn from the best! This table showcases top-performing Airbnb hosts in Area D (Oyster Bay/Buttle Lake) based on the number of properties managed and estimated total revenue over the past year. Analyze their scale and performance metrics.
| Host Name | Properties | Grossing Revenue | Stay Reviews | Avg Rating |
|---|---|---|---|---|
| Lina | 3 | $344,286 | 255 | 4.94/5.0 |
| Bastian | 5 | $125,300 | 869 | 4.93/5.0 |
| Matt | 1 | $63,382 | 127 | 4.80/5.0 |
| Kelli | 1 | $48,201 | 119 | 4.95/5.0 |
| Stephanie | 1 | $46,538 | 282 | 4.98/5.0 |
| Allison And George | 2 | $42,885 | 80 | 4.86/5.0 |
| Kelsi | 1 | $41,614 | 49 | 4.94/5.0 |
| Kirstie | 1 | $36,920 | 67 | 4.84/5.0 |
| Desiree | 1 | $33,732 | 37 | 5.00/5.0 |
| Lauren | 1 | $23,454 | 40 | 4.98/5.0 |
Analyzing the strategies of top hosts, such as their property selection, pricing, and guest communication, can offer valuable lessons for optimizing your own Airbnb operations in Area D (Oyster Bay/Buttle Lake).
Dive Deeper: Advanced Area D (Oyster Bay/Buttle Lake) STR Market Data (2025)
Ready to unlock more insights? AirROI provides access to advanced metrics and comprehensive Airbnb data for Area D (Oyster Bay/Buttle Lake). Explore detailed analytics beyond this report to refine your investment strategy, optimize pricing, and maximize your vacation rental profits.
Explore Advanced MetricsArea D (Oyster Bay/Buttle Lake) Short-Term Rental Market Composition (2025): Property & Room Types
Room Type Distribution
Property Type Distribution
Market Composition Insights for Area D (Oyster Bay/Buttle Lake)
- The Area D (Oyster Bay/Buttle Lake) Airbnb market composition is heavily skewed towards Entire Home/Apt listings, which make up 94.6% of the 37 active rentals. This indicates strong guest preference for privacy and space.
- Looking at the property type distribution in Area D (Oyster Bay/Buttle Lake), House properties are the most common (40.5%), reflecting the local real estate landscape.
- Houses represent a significant 40.5% portion, catering likely to families or larger groups.
- The presence of 13.5% Hotel/Boutique listings indicates integration with traditional hospitality.
- Smaller segments like apartment/condo (combined 2.7%) offer potential for unique stay experiences.
Area D (Oyster Bay/Buttle Lake) Airbnb Room Capacity Analysis (2025): Bedroom Distribution
Distribution of Listings by Number of Bedrooms
Room Capacity Insights for Area D (Oyster Bay/Buttle Lake)
- The dominant room capacity in Area D (Oyster Bay/Buttle Lake) is 1 bedroom listings, making up 51.4% of the market. This suggests a strong demand for properties suitable for couples or solo travelers.
- Together, 1 bedroom and 3 bedrooms properties represent 67.6% of the active Airbnb listings in Area D (Oyster Bay/Buttle Lake), indicating a high concentration in these sizes.
- With over half the market (51.4%) consisting of studios or 1-bedroom units, Area D (Oyster Bay/Buttle Lake) is particularly well-suited for individuals or couples.
- A significant 21.6% of listings offer 3+ bedrooms, catering to larger groups and families seeking more space in Area D (Oyster Bay/Buttle Lake).
Area D (Oyster Bay/Buttle Lake) Vacation Rental Guest Capacity Trends (2025)
Distribution of Listings by Guest Capacity
Guest Capacity Insights for Area D (Oyster Bay/Buttle Lake)
- The most common guest capacity trend in Area D (Oyster Bay/Buttle Lake) vacation rentals is listings accommodating 2 guests (45.9%). This suggests the primary traveler segment is likely couples or solo travelers.
- Properties designed for 2 guests and 4 guests dominate the Area D (Oyster Bay/Buttle Lake) STR market, accounting for 67.5% of listings.
- A significant 45.9% of listings cater specifically to 1-2 guests, highlighting strong demand from couples and solo travelers in Area D (Oyster Bay/Buttle Lake).
- 24.3% of properties accommodate 6+ guests, serving the market segment for larger families or group travel in Area D (Oyster Bay/Buttle Lake).
- On average, properties in Area D (Oyster Bay/Buttle Lake) are equipped to host 3.7 guests.
Area D (Oyster Bay/Buttle Lake) Airbnb Booking Patterns (2025): Available vs. Booked Days
Available Days Distribution
Booked Days Distribution
Booking Pattern Insights for Area D (Oyster Bay/Buttle Lake)
- The most common availability pattern in Area D (Oyster Bay/Buttle Lake) falls within the 181-270 days range, representing 43.2% of listings. This suggests many properties have significant open periods on their calendars.
- Approximately 64.8% of listings show high availability (181+ days open annually), indicating potential for increased bookings or specific owner usage patterns.
- For booked days, the 91-180 days range is most frequent in Area D (Oyster Bay/Buttle Lake) (43.2%), reflecting common guest stay durations or potential owner blocking patterns.
- A notable 35.1% of properties secure long booking periods (181+ days booked per year), highlighting successful long-term rental strategies or significant owner usage.
Area D (Oyster Bay/Buttle Lake) Airbnb Minimum Stay Requirements Analysis
Distribution of Listings by Minimum Night Requirement
1 Night
4 listings
11.4% of total
2 Nights
16 listings
45.7% of total
3 Nights
7 listings
20% of total
4-6 Nights
3 listings
8.6% of total
30+ Nights
5 listings
14.3% of total
Key Insights
- The most prevalent minimum stay requirement in Area D (Oyster Bay/Buttle Lake) is 2 Nights, adopted by 45.7% of listings. This highlights the market's preference for shorter, flexible bookings.
- A significant segment (14.3%) caters to monthly stays (30+ nights) in Area D (Oyster Bay/Buttle Lake), pointing to opportunities in the extended-stay market.
Recommendations
- Align with the market by considering a 2 Nights minimum stay, as 45.7% of Area D (Oyster Bay/Buttle Lake) hosts use this setting.
- If feasible, allowing 1-night stays, especially midweek or during low season, could capture last-minute bookings, as only 11.4% currently do.
- A 2-night minimum appears standard (45.7%). Consider this for weekends or peak periods.
- Explore offering discounts for stays of 30+ nights to attract the 14.3% of the market seeking extended stays.
- Adjust minimum nights based on seasonality – potentially shorter during low season and longer during peak demand periods in Area D (Oyster Bay/Buttle Lake).
Area D (Oyster Bay/Buttle Lake) Airbnb Cancellation Policy Trends Analysis (2025)
Flexible
12 listings
33.3% of total
Moderate
9 listings
25% of total
Firm
6 listings
16.7% of total
Strict
9 listings
25% of total
Cancellation Policy Insights for Area D (Oyster Bay/Buttle Lake)
- The prevailing Airbnb cancellation policy trend in Area D (Oyster Bay/Buttle Lake) is Flexible, used by 33.3% of listings.
- There's a relatively balanced mix between guest-friendly (58.3%) and stricter (41.7%) policies, offering choices for different guest needs.
Recommendations for Hosts
- Consider adopting a Flexible policy to align with the 33.3% market standard in Area D (Oyster Bay/Buttle Lake).
- Regularly review your cancellation policy against competitors and market demand shifts in Area D (Oyster Bay/Buttle Lake).
Area D (Oyster Bay/Buttle Lake) STR Booking Lead Time Analysis (2025)
Average Booking Lead Time by Month
Booking Lead Time Insights for Area D (Oyster Bay/Buttle Lake)
- The overall average booking lead time for vacation rentals in Area D (Oyster Bay/Buttle Lake) is 55 days.
- Guests book furthest in advance for stays during June (average 89 days), likely coinciding with peak travel demand or local events.
- The shortest booking windows occur for stays in January (average 21 days), indicating more last-minute travel plans during this time.
- Seasonally, Summer (75 days avg.) sees the longest lead times, while Winter (23 days avg.) has the shortest, reflecting typical travel planning cycles.
Recommendations for Hosts
- Use the overall average lead time (55 days) as a baseline for your pricing and availability strategy in Area D (Oyster Bay/Buttle Lake).
- For June stays, consider implementing length-of-stay discounts or slightly higher rates for bookings made less than 89 days out to capitalize on advance planning.
- Target marketing efforts for the Summer season well in advance (at least 75 days) to capture early planners.
- Monitor your own booking lead times against these Area D (Oyster Bay/Buttle Lake) averages to identify opportunities for dynamic pricing adjustments.
Popular & Essential Airbnb Amenities in Area D (Oyster Bay/Buttle Lake) (2025)
Amenity Prevalence
Amenity Insights for Area D (Oyster Bay/Buttle Lake)
- Essential amenities in Area D (Oyster Bay/Buttle Lake) that guests expect include: Dishes and silverware, Coffee maker, Free parking on premises. Lacking these (any) could significantly impact bookings.
- Popular amenities like Wifi, Smoke alarm, Heating are common but not universal. Offering these can provide a competitive edge.
- Warning: Wifi is not universally provided but is considered essential globally. Ensure reliable Wifi is offered.
Recommendations for Hosts
- Ensure your listing includes all essential amenities for Area D (Oyster Bay/Buttle Lake): Dishes and silverware, Coffee maker, Free parking on premises.
- Prioritize adding missing essentials: Free parking on premises.
- Consider adding popular differentiators like Wifi or Smoke alarm to increase appeal.
- Highlight unique or less common amenities you offer (e.g., hot tub, dedicated workspace, EV charger) in your listing description and photos.
- Regularly check competitor amenities in Area D (Oyster Bay/Buttle Lake) to stay competitive.
Area D (Oyster Bay/Buttle Lake) Airbnb Guest Demographics & Profile Analysis (2025)
Guest Profile Summary for Area D (Oyster Bay/Buttle Lake)
- The typical guest profile for Airbnb in Area D (Oyster Bay/Buttle Lake) consists of primarily domestic travelers (69%), often arriving from nearby Vancouver, typically belonging to the Post-2000s (Gen Z/Alpha) group (50%), primarily speaking English or French.
- Domestic travelers account for 69.1% of guests.
- Key international markets include Canada (69.1%) and United States (16.4%).
- Top languages spoken are English (66.6%) followed by French (12%).
- A significant demographic segment is the Post-2000s (Gen Z/Alpha) group, representing 50% of guests.
Recommendations for Hosts
- Target domestic marketing efforts towards travelers from Vancouver and Victoria.
- Tailor amenities and listing descriptions to appeal to the dominant Post-2000s (Gen Z/Alpha) demographic (e.g., highlight fast WiFi, smart home features, local guides).
- Highlight unique local experiences or amenities relevant to the primary guest profile.
- Consider seasonal promotions aligned with peak travel times for key origin markets.
Nearby Short-Term Rental Market Comparison
How does the Area D (Oyster Bay/Buttle Lake) Airbnb market stack up against its neighbors? Compare key performance metrics like average monthly revenue, ADR, and occupancy rates in surrounding areas to understand the broader regional STR landscape.
| Market | Active Properties | Monthly Revenue | Daily Rate | Avg. Occupancy |
|---|---|---|---|---|
| Tofino | 331 | $4,937 | $285.11 | 57% |
| Ucluelet | 344 | $3,256 | $221.35 | 51% |
| Beaver | 14 | $3,205 | $245.01 | 54% |
| Sekiu | 35 | $3,138 | $235.66 | 49% |
| Clallam Bay | 11 | $3,072 | $211.28 | 58% |
| Juan de Fuca Electoral Area | 300 | $3,025 | $226.57 | 48% |
| Area I (Youbou / Meade Creek) | 47 | $2,942 | $295.81 | 42% |
| Clallam County | 21 | $2,902 | $260.95 | 45% |
| Area C (Long Beach) | 80 | $2,692 | $192.12 | 54% |
| Area D (Sproat Lake) | 47 | $2,669 | $272.99 | 45% |