Area C (Arrowsmith-Benson) Airbnb Market Analysis 2025: Short Term Rental Data & Vacation Rental Statistics in British Columbia, Canada
Is Airbnb profitable in Area C (Arrowsmith-Benson) in 2025? Explore comprehensive Airbnb analytics for Area C (Arrowsmith-Benson), British Columbia, Canada to uncover income potential. This 2025 STR market report for Area C (Arrowsmith-Benson), based on AirROI data from April 2024 to March 2025, reveals key trends in the niche market of 27 active listings.
Whether you're considering an Airbnb investment in Area C (Arrowsmith-Benson), optimizing your existing vacation rental, or exploring rental arbitrage opportunities, understanding the Area C (Arrowsmith-Benson) Airbnb data is crucial. Leveraging the low regulation environment is key to maximizing your short term rental income potential. Let's dive into the specifics.
Key Area C (Arrowsmith-Benson) Airbnb Performance Metrics Overview
Monthly Airbnb Revenue Variations & Income Potential in Area C (Arrowsmith-Benson) (2025)
Understanding the monthly revenue variations for Airbnb listings in Area C (Arrowsmith-Benson) is key to maximizing your short term rental income potential. Seasonality significantly impacts earnings. Our analysis, based on data from the past 12 months, shows that the peak revenue month for STRs in Area C (Arrowsmith-Benson) is typically May, while February often presents the lowest earnings, highlighting opportunities for strategic pricing adjustments during shoulder and low seasons. Explore the typical Airbnb income in Area C (Arrowsmith-Benson) across different performance tiers:
- Best-in-class properties (Top 10%) achieve $4,135+ monthly, often utilizing dynamic pricing and superior guest experiences.
- Strong performing properties (Top 25%) earn $2,310 or more, indicating effective management and desirable locations/amenities.
- Typical properties (Median) generate around $1,272 per month, representing the average market performance.
- Entry-level properties (Bottom 25%) see earnings around $631, often with potential for optimization.
Average Monthly Airbnb Earnings Trend in Area C (Arrowsmith-Benson)
Area C (Arrowsmith-Benson) Airbnb Occupancy Rate Trends (2025)
Maximize your bookings by understanding the Area C (Arrowsmith-Benson) STR occupancy trends. Seasonal demand shifts significantly influence how often properties are booked. Typically, Maysees the highest demand (peak season occupancy), while December experiences the lowest (low season). Effective strategies, like adjusting minimum stays or offering promotions, can boost occupancy during slower periods. Here's how different property tiers perform in Area C (Arrowsmith-Benson):
- Best-in-class properties (Top 10%) achieve 87%+ occupancy, indicating high desirability and potentially optimized availability.
- Strong performing properties (Top 25%) maintain 61% or higher occupancy, suggesting good market fit and guest satisfaction.
- Typical properties (Median) have an occupancy rate around 34%.
- Entry-level properties (Bottom 25%) average 15% occupancy, potentially facing higher vacancy.
Average Monthly Occupancy Rate Trend in Area C (Arrowsmith-Benson)
Average Daily Rate (ADR) Airbnb Trends in Area C (Arrowsmith-Benson) (2025)
Effective short term rental pricing strategy in Area C (Arrowsmith-Benson) involves understanding monthly ADR fluctuations. The Average Daily Rate (ADR) for Airbnb in Area C (Arrowsmith-Benson) typically peaks in July and dips lowest during February. Leveraging Airbnb dynamic pricing tools or strategies based on this seasonality can significantly boost revenue. Here's a look at the typical nightly rates achieved:
- Best-in-class properties (Top 10%) command rates of $215+ per night, often due to premium features or locations.
- Strong performing properties (Top 25%) achieve nightly rates of $136 or more.
- Typical properties (Median) charge around $105 per night.
- Entry-level properties (Bottom 25%) earn around $74 per night.
Average Daily Rate (ADR) Trend by Month in Area C (Arrowsmith-Benson)
Get Live Area C (Arrowsmith-Benson) Market Intelligence 👇
.png)
Explore Real-time Analytics
Airbnb Seasonality Analysis & Trends in Area C (Arrowsmith-Benson) (2025)
Peak Season (May, June, April)
- Revenue averages $2,706 per month
- Occupancy rates average 45.7%
- Daily rates average $148
Shoulder Season
- Revenue averages $1,790 per month
- Occupancy maintains around 41.9%
- Daily rates hold near $138
Low Season (January, February, March)
- Revenue drops to average $996 per month
- Occupancy decreases to average 38.4%
- Daily rates adjust to average $117
Seasonality Insights for Area C (Arrowsmith-Benson)
- The Airbnb seasonality in Area C (Arrowsmith-Benson) shows highly seasonal trends requiring careful strategy. While the sections above show seasonal averages, it's also insightful to look at the extremes:
- During the high season, the absolute peak month showcases Area C (Arrowsmith-Benson)'s highest earning potential, with monthly revenues capable of climbing to $2,984, occupancy reaching a high of 50.4%, and ADRs peaking at $153.
- Conversely, the slowest single month of the year, typically falling within the low season, marks the market's lowest point. In this month, revenue might dip to $863, occupancy could drop to 34.7%, and ADRs may adjust down to $115.
- Understanding both the seasonal averages and these monthly peaks and troughs in revenue, occupancy, and ADR is crucial for maximizing your Airbnb profit potential in Area C (Arrowsmith-Benson).
Seasonal Strategies for Maximizing Profit
- Peak Season: Maximize revenue through premium pricing and potentially longer minimum stays. Ensure high availability.
- Low Season: Offer competitive pricing, special promotions (e.g., extended stay discounts), and flexible cancellation policies. Target off-season travelers like remote workers or budget-conscious guests.
- Shoulder Seasons: Implement dynamic pricing that balances peak and low rates. Target weekend travelers or specific events. Offer slightly more flexible terms than peak season.
- Regularly analyze your own performance against these Area C (Arrowsmith-Benson) seasonality benchmarks and adjust your pricing and availability strategy accordingly.
Best Areas for Airbnb Investment in Area C (Arrowsmith-Benson) (2025)
Exploring the top neighborhoods for short-term rentals in Area C (Arrowsmith-Benson)? This section highlights key areas, outlining why they are attractive for hosts and guests, along with notable local attractions. Consider these locations based on your target guest profile and investment strategy.
| Neighborhood / Area | Why Host Here? (Target Guests & Appeal) | Key Attractions & Landmarks |
|---|---|---|
| Parksville | A beach town known for its beautiful coastline and warm weather. It attracts tourists looking for a relaxing getaway with access to the beach and outdoor activities. | Parksville Beach, Qualicum Beach, Rathtrevor Beach Provincial Park, North Island Wildlife Recovery Centre, Coombs Old Country Market |
| Qualicum Beach | A picturesque small town known for its sandy shores and charming downtown. It's ideal for families and retirees, providing a peaceful escape with nature and community events. | Qualicum Beach, Milner Gardens & Woodland, Qualicum Beach Museum, Little Qualicum Falls Provincial Park, Heritage Forest |
| Nanaimo | A vibrant city with a rich cultural scene and outdoor adventures. Suitable for tourists who appreciate urban amenities coupled with stunning natural landscapes. | Nanaimo Harbourfront Walkway, Newcastle Island, Diver Lake Park, Nanaimo Museum, Woodgrove Centre |
| Ladysmith | A charming town with a historic waterfront and great community vibes. It’s ideal for guests who are looking for a quaint stay with easy access to both nature and town amenities. | Ladysmith Maritime Society, Transfer Beach Park, Ladysmith Heritage Centre, Cowichan Valley, Holland Creek Trail |
| Cowichan Valley | Known for its wineries and agriculture, it attracts visitors who are into local food and drink as well as outdoor activities, providing a unique tourism experience. | Cowichan River, Bayview Farm, Duncan's Farmer's Market, Winery tours, Kinsol Trestle |
| Duncan | A city known as the 'City of Totems', offering rich indigenous culture and history. Great for travelers interested in art, history, and community-centric activities. | Cowichan Valley Museum, B.C. Forest Discovery Centre, Duncan Farmers' Market, Bloomfield Park, Quw'utsun’ Cultural Centre |
| Chemainus | Famous for its murals and arts community, Chemainus offers a cultural experience along with beautiful coastal views, attracting creative visitors. | Chemainus Murals, Chemainus Theatre, Kinsmen Park, Somenos Marsh Wildlife Society, View Royal Inn |
| Salt Spring Island | The largest of the Gulf Islands, known for its vibrant arts community and stunning landscapes. Attracts visitors looking for a peaceful retreat in nature with artisanal shops and local markets. | Salt Spring Island Vineyards & Winery, Ganges Village, Ruckle Provincial Park, Salt Spring Island Cheese Company, Mount Maxwell Provincial Park |
Understanding Airbnb License Requirements & STR Laws in Area C (Arrowsmith-Benson) (2025)
While Area C (Arrowsmith-Benson), British Columbia, Canada currently shows low STR regulations, specific Airbnb license requirements might still exist or change. Always verify the latest short term rental regulations and Airbnb license requirements directly with local government authorities for Area C (Arrowsmith-Benson) to ensure full compliance before hosting.
(Source: AirROI data, 2025, finding no licensed listings among those analyzed)
Top Performing Airbnb Properties in Area C (Arrowsmith-Benson) (2025)
Benchmark your potential! Explore examples of top-performing Airbnb properties in Area C (Arrowsmith-Benson)based on Trailing Twelve Month (TTM) revenue. Analyze their characteristics, revenue, occupancy rate, and ADR to understand what drives success in this market.
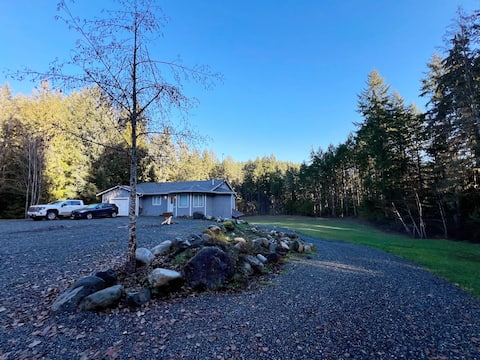
Nature Lovers’ Paradise
Entire Place • 6 bedrooms

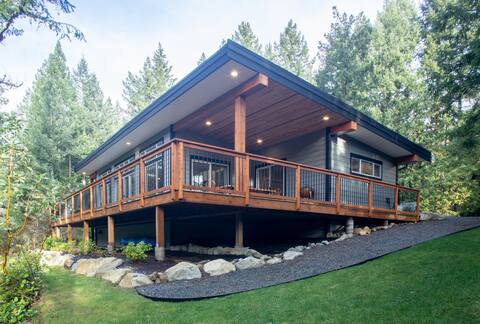
Log House on Vancouver Island
Entire Place • 4 bedrooms
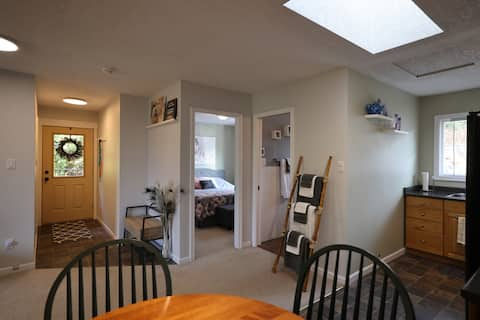
The Bunkie - Nanaimo's forest retreat
Entire Place • 2 bedrooms

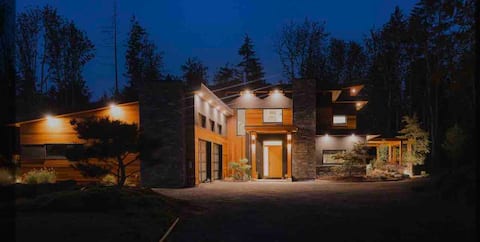
Escape from the city
Entire Place • 3 bedrooms
Millstone Acres Hobby Farm
Entire Place • 2 bedrooms
Luxe Passive Garden Suite | Serene & Sustainable
Entire Place • 1 bedroom
Note: Performance varies based on location, size, amenities, seasonality, and management quality. Data reflects the past 12 months.
Top Performing Airbnb Hosts in Area C (Arrowsmith-Benson) (2025)
Learn from the best! This table showcases top-performing Airbnb hosts in Area C (Arrowsmith-Benson) based on the number of properties managed and estimated total revenue over the past year. Analyze their scale and performance metrics.
| Host Name | Properties | Grossing Revenue | Stay Reviews | Avg Rating |
|---|---|---|---|---|
| Host #442545560 | 1 | $70,064 | 6 | 4.50/5.0 |
| Host #351339386 | 1 | $42,341 | 39 | 4.92/5.0 |
| Bryan | 1 | $38,149 | 105 | 4.99/5.0 |
| Ember | 2 | $31,070 | 120 | 4.35/5.0 |
| Carolyn | 8 | $26,748 | 51 | 3.54/5.0 |
| Host #247717189 | 1 | $21,822 | 12 | 4.83/5.0 |
| Host #534383064 | 1 | $19,828 | 11 | 5.00/5.0 |
| Host #3046166 | 1 | $17,612 | 157 | 4.91/5.0 |
| Julene | 1 | $16,249 | 99 | 4.75/5.0 |
| Deborah | 1 | $14,435 | 319 | 4.89/5.0 |
Analyzing the strategies of top hosts, such as their property selection, pricing, and guest communication, can offer valuable lessons for optimizing your own Airbnb operations in Area C (Arrowsmith-Benson).
Dive Deeper: Advanced Area C (Arrowsmith-Benson) STR Market Data (2025)
Ready to unlock more insights? AirROI provides access to advanced metrics and comprehensive Airbnb data for Area C (Arrowsmith-Benson). Explore detailed analytics beyond this report to refine your investment strategy, optimize pricing, and maximize your vacation rental profits.
Explore Advanced MetricsArea C (Arrowsmith-Benson) Short-Term Rental Market Composition (2025): Property & Room Types
Room Type Distribution
Property Type Distribution
Market Composition Insights for Area C (Arrowsmith-Benson)
- The Area C (Arrowsmith-Benson) Airbnb market composition is heavily skewed towards Entire Home/Apt listings, which make up 92.6% of the 27 active rentals. This indicates strong guest preference for privacy and space.
- Looking at the property type distribution in Area C (Arrowsmith-Benson), Outdoor/Unique properties are the most common (51.9%), reflecting the local real estate landscape.
- Houses represent a significant 18.5% portion, catering likely to families or larger groups.
- The presence of 7.4% Hotel/Boutique listings indicates integration with traditional hospitality.
Area C (Arrowsmith-Benson) Airbnb Room Capacity Analysis (2025): Bedroom Distribution
Distribution of Listings by Number of Bedrooms
Room Capacity Insights for Area C (Arrowsmith-Benson)
- The dominant room capacity in Area C (Arrowsmith-Benson) is 1 bedroom listings, making up 48.1% of the market. This suggests a strong demand for properties suitable for couples or solo travelers.
- Together, 1 bedroom and 2 bedrooms properties represent 70.3% of the active Airbnb listings in Area C (Arrowsmith-Benson), indicating a high concentration in these sizes.
Area C (Arrowsmith-Benson) Vacation Rental Guest Capacity Trends (2025)
Distribution of Listings by Guest Capacity
Guest Capacity Insights for Area C (Arrowsmith-Benson)
- The most common guest capacity trend in Area C (Arrowsmith-Benson) vacation rentals is listings accommodating 4 guests (29.6%). This suggests the primary traveler segment is likely small families or groups.
- Properties designed for 4 guests and 2 guests dominate the Area C (Arrowsmith-Benson) STR market, accounting for 55.5% of listings.
- 25.9% of properties accommodate 6+ guests, serving the market segment for larger families or group travel in Area C (Arrowsmith-Benson).
- On average, properties in Area C (Arrowsmith-Benson) are equipped to host 4.0 guests.
Area C (Arrowsmith-Benson) Airbnb Booking Patterns (2025): Available vs. Booked Days
Available Days Distribution
Booked Days Distribution
Booking Pattern Insights for Area C (Arrowsmith-Benson)
- The most common availability pattern in Area C (Arrowsmith-Benson) falls within the 271-366 days range, representing 51.9% of listings. This suggests many properties have significant open periods on their calendars.
- Approximately 81.5% of listings show high availability (181+ days open annually), indicating potential for increased bookings or specific owner usage patterns.
- For booked days, the 1-30 days range is most frequent in Area C (Arrowsmith-Benson) (29.6%), reflecting common guest stay durations or potential owner blocking patterns.
- A notable 22.2% of properties secure long booking periods (181+ days booked per year), highlighting successful long-term rental strategies or significant owner usage.
Area C (Arrowsmith-Benson) Airbnb Minimum Stay Requirements Analysis
Distribution of Listings by Minimum Night Requirement
1 Night
10 listings
47.6% of total
2 Nights
6 listings
28.6% of total
3 Nights
4 listings
19% of total
4-6 Nights
1 listings
4.8% of total
Key Insights
- The most prevalent minimum stay requirement in Area C (Arrowsmith-Benson) is 1 Night, adopted by 47.6% of listings. This highlights the market's preference for shorter, flexible bookings.
- A strong majority (76.2%) of the Area C (Arrowsmith-Benson) Airbnb data shows acceptance of very short stays (1-2 nights), indicating a dynamic, high-turnover market.
Recommendations
- Align with the market by considering a 1 Night minimum stay, as 47.6% of Area C (Arrowsmith-Benson) hosts use this setting.
- Adjust minimum nights based on seasonality – potentially shorter during low season and longer during peak demand periods in Area C (Arrowsmith-Benson).
Area C (Arrowsmith-Benson) Airbnb Cancellation Policy Trends Analysis (2025)
Flexible
8 listings
40% of total
Moderate
7 listings
35% of total
Firm
2 listings
10% of total
Strict
3 listings
15% of total
Cancellation Policy Insights for Area C (Arrowsmith-Benson)
- The prevailing Airbnb cancellation policy trend in Area C (Arrowsmith-Benson) is Flexible, used by 40% of listings.
- The market strongly favors guest-friendly terms, with 75.0% of listings offering Flexible or Moderate policies. This suggests guests in Area C (Arrowsmith-Benson) may expect booking flexibility.
Recommendations for Hosts
- Consider adopting a Flexible policy to align with the 40% market standard in Area C (Arrowsmith-Benson).
- Regularly review your cancellation policy against competitors and market demand shifts in Area C (Arrowsmith-Benson).
Area C (Arrowsmith-Benson) STR Booking Lead Time Analysis (2025)
Average Booking Lead Time by Month
Booking Lead Time Insights for Area C (Arrowsmith-Benson)
- The overall average booking lead time for vacation rentals in Area C (Arrowsmith-Benson) is 38 days.
- Guests book furthest in advance for stays during September (average 125 days), likely coinciding with peak travel demand or local events.
- The shortest booking windows occur for stays in January (average 34 days), indicating more last-minute travel plans during this time.
- Seasonally, Fall (91 days avg.) sees the longest lead times, while Winter (42 days avg.) has the shortest, reflecting typical travel planning cycles.
Recommendations for Hosts
- Use the overall average lead time (38 days) as a baseline for your pricing and availability strategy in Area C (Arrowsmith-Benson).
- For September stays, consider implementing length-of-stay discounts or slightly higher rates for bookings made less than 125 days out to capitalize on advance planning.
- Target marketing efforts for the Fall season well in advance (at least 91 days) to capture early planners.
- Monitor your own booking lead times against these Area C (Arrowsmith-Benson) averages to identify opportunities for dynamic pricing adjustments.
Popular & Essential Airbnb Amenities in Area C (Arrowsmith-Benson) (2025)
Amenity Prevalence
Amenity Insights for Area C (Arrowsmith-Benson)
- Essential amenities in Area C (Arrowsmith-Benson) that guests expect include: Heating, Wifi, Free parking on premises. Lacking these (any) could significantly impact bookings.
- Popular amenities like Smoke alarm, Hot water, Essentials are common but not universal. Offering these can provide a competitive edge.
Recommendations for Hosts
- Ensure your listing includes all essential amenities for Area C (Arrowsmith-Benson): Heating, Wifi, Free parking on premises.
- Prioritize adding missing essentials: Free parking on premises.
- Consider adding popular differentiators like Smoke alarm or Hot water to increase appeal.
- Highlight unique or less common amenities you offer (e.g., hot tub, dedicated workspace, EV charger) in your listing description and photos.
- Regularly check competitor amenities in Area C (Arrowsmith-Benson) to stay competitive.
Area C (Arrowsmith-Benson) Airbnb Guest Demographics & Profile Analysis (2025)
Guest Profile Summary for Area C (Arrowsmith-Benson)
- The typical guest profile for Airbnb in Area C (Arrowsmith-Benson) consists of primarily domestic travelers (70%), often arriving from nearby Vancouver, typically belonging to the Post-2000s (Gen Z/Alpha) group (50%), primarily speaking English or French.
- Domestic travelers account for 70.2% of guests.
- Key international markets include Canada (70.2%) and United States (14.1%).
- Top languages spoken are English (58.6%) followed by French (12.6%).
- A significant demographic segment is the Post-2000s (Gen Z/Alpha) group, representing 50% of guests.
Recommendations for Hosts
- Target domestic marketing efforts towards travelers from Vancouver and Victoria.
- Tailor amenities and listing descriptions to appeal to the dominant Post-2000s (Gen Z/Alpha) demographic (e.g., highlight fast WiFi, smart home features, local guides).
- Highlight unique local experiences or amenities relevant to the primary guest profile.
- Consider seasonal promotions aligned with peak travel times for key origin markets.
Nearby Short-Term Rental Market Comparison
How does the Area C (Arrowsmith-Benson) Airbnb market stack up against its neighbors? Compare key performance metrics like average monthly revenue, ADR, and occupancy rates in surrounding areas to understand the broader regional STR landscape.
| Market | Active Properties | Monthly Revenue | Daily Rate | Avg. Occupancy |
|---|---|---|---|---|
| Lake Goodwin | 11 | $4,949 | $371.43 | 44% |
| Cape George Colony Club | 10 | $4,770 | $257.49 | 59% |
| Sudden Valley | 65 | $4,390 | $286.32 | 53% |
| Orcas Island | 13 | $4,220 | $514.57 | 39% |
| Friday Harbor | 219 | $4,187 | $371.96 | 45% |
| Eastsound | 260 | $4,048 | $335.49 | 43% |
| Lopez Island | 40 | $4,002 | $343.46 | 41% |
| Oak Harbor | 128 | $3,944 | $279.04 | 49% |
| Warm Beach | 14 | $3,769 | $282.16 | 44% |
| Greenbank | 42 | $3,729 | $322.97 | 43% |