Area B (Discovery Islands/Mainland Inlets) Airbnb Market Analysis 2025: Short Term Rental Data & Vacation Rental Statistics in British Columbia, Canada
Is Airbnb profitable in Area B (Discovery Islands/Mainland Inlets) in 2025? Explore comprehensive Airbnb analytics for Area B (Discovery Islands/Mainland Inlets), British Columbia, Canada to uncover income potential. This 2025 STR market report for Area B (Discovery Islands/Mainland Inlets), based on AirROI data from April 2024 to March 2025, reveals key trends in the niche market of 73 active listings.
Whether you're considering an Airbnb investment in Area B (Discovery Islands/Mainland Inlets), optimizing your existing vacation rental, or exploring rental arbitrage opportunities, understanding the Area B (Discovery Islands/Mainland Inlets) Airbnb data is crucial. Leveraging the low regulation environment is key to maximizing your short term rental income potential. Let's dive into the specifics.
Key Area B (Discovery Islands/Mainland Inlets) Airbnb Performance Metrics Overview
Monthly Airbnb Revenue Variations & Income Potential in Area B (Discovery Islands/Mainland Inlets) (2025)
Understanding the monthly revenue variations for Airbnb listings in Area B (Discovery Islands/Mainland Inlets) is key to maximizing your short term rental income potential. Seasonality significantly impacts earnings. Our analysis, based on data from the past 12 months, shows that the peak revenue month for STRs in Area B (Discovery Islands/Mainland Inlets) is typically July, while February often presents the lowest earnings, highlighting opportunities for strategic pricing adjustments during shoulder and low seasons. Explore the typical Airbnb income in Area B (Discovery Islands/Mainland Inlets) across different performance tiers:
- Best-in-class properties (Top 10%) achieve $5,470+ monthly, often utilizing dynamic pricing and superior guest experiences.
- Strong performing properties (Top 25%) earn $3,639 or more, indicating effective management and desirable locations/amenities.
- Typical properties (Median) generate around $2,067 per month, representing the average market performance.
- Entry-level properties (Bottom 25%) see earnings around $1,081, often with potential for optimization.
Average Monthly Airbnb Earnings Trend in Area B (Discovery Islands/Mainland Inlets)
Area B (Discovery Islands/Mainland Inlets) Airbnb Occupancy Rate Trends (2025)
Maximize your bookings by understanding the Area B (Discovery Islands/Mainland Inlets) STR occupancy trends. Seasonal demand shifts significantly influence how often properties are booked. Typically, Augustsees the highest demand (peak season occupancy), while February experiences the lowest (low season). Effective strategies, like adjusting minimum stays or offering promotions, can boost occupancy during slower periods. Here's how different property tiers perform in Area B (Discovery Islands/Mainland Inlets):
- Best-in-class properties (Top 10%) achieve 79%+ occupancy, indicating high desirability and potentially optimized availability.
- Strong performing properties (Top 25%) maintain 60% or higher occupancy, suggesting good market fit and guest satisfaction.
- Typical properties (Median) have an occupancy rate around 40%.
- Entry-level properties (Bottom 25%) average 24% occupancy, potentially facing higher vacancy.
Average Monthly Occupancy Rate Trend in Area B (Discovery Islands/Mainland Inlets)
Average Daily Rate (ADR) Airbnb Trends in Area B (Discovery Islands/Mainland Inlets) (2025)
Effective short term rental pricing strategy in Area B (Discovery Islands/Mainland Inlets) involves understanding monthly ADR fluctuations. The Average Daily Rate (ADR) for Airbnb in Area B (Discovery Islands/Mainland Inlets) typically peaks in July and dips lowest during February. Leveraging Airbnb dynamic pricing tools or strategies based on this seasonality can significantly boost revenue. Here's a look at the typical nightly rates achieved:
- Best-in-class properties (Top 10%) command rates of $444+ per night, often due to premium features or locations.
- Strong performing properties (Top 25%) achieve nightly rates of $257 or more.
- Typical properties (Median) charge around $152 per night.
- Entry-level properties (Bottom 25%) earn around $106 per night.
Average Daily Rate (ADR) Trend by Month in Area B (Discovery Islands/Mainland Inlets)
Get Live Area B (Discovery Islands/Mainland Inlets) Market Intelligence 👇
.png)
Explore Real-time Analytics
Airbnb Seasonality Analysis & Trends in Area B (Discovery Islands/Mainland Inlets) (2025)
Peak Season (July, August, June)
- Revenue averages $4,278 per month
- Occupancy rates average 62.6%
- Daily rates average $259
Shoulder Season
- Revenue averages $2,522 per month
- Occupancy maintains around 39.1%
- Daily rates hold near $238
Low Season (January, February, March)
- Revenue drops to average $1,692 per month
- Occupancy decreases to average 30.8%
- Daily rates adjust to average $207
Seasonality Insights for Area B (Discovery Islands/Mainland Inlets)
- The Airbnb seasonality in Area B (Discovery Islands/Mainland Inlets) shows highly seasonal trends requiring careful strategy. While the sections above show seasonal averages, it's also insightful to look at the extremes:
- During the high season, the absolute peak month showcases Area B (Discovery Islands/Mainland Inlets)'s highest earning potential, with monthly revenues capable of climbing to $4,852, occupancy reaching a high of 72.8%, and ADRs peaking at $260.
- Conversely, the slowest single month of the year, typically falling within the low season, marks the market's lowest point. In this month, revenue might dip to $1,402, occupancy could drop to 27.2%, and ADRs may adjust down to $206.
- Understanding both the seasonal averages and these monthly peaks and troughs in revenue, occupancy, and ADR is crucial for maximizing your Airbnb profit potential in Area B (Discovery Islands/Mainland Inlets).
Seasonal Strategies for Maximizing Profit
- Peak Season: Maximize revenue through premium pricing and potentially longer minimum stays. Ensure high availability.
- Low Season: Offer competitive pricing, special promotions (e.g., extended stay discounts), and flexible cancellation policies. Target off-season travelers like remote workers or budget-conscious guests.
- Shoulder Seasons: Implement dynamic pricing that balances peak and low rates. Target weekend travelers or specific events. Offer slightly more flexible terms than peak season.
- Regularly analyze your own performance against these Area B (Discovery Islands/Mainland Inlets) seasonality benchmarks and adjust your pricing and availability strategy accordingly.
Best Areas for Airbnb Investment in Area B (Discovery Islands/Mainland Inlets) (2025)
Exploring the top neighborhoods for short-term rentals in Area B (Discovery Islands/Mainland Inlets)? This section highlights key areas, outlining why they are attractive for hosts and guests, along with notable local attractions. Consider these locations based on your target guest profile and investment strategy.
| Neighborhood / Area | Why Host Here? (Target Guests & Appeal) | Key Attractions & Landmarks |
|---|---|---|
| Campbell River | Known as the gateway to the Discovery Islands, Campbell River is famous for its waterfront activities, including fishing, kayaking, and whale watching. Offers a mix of outdoor adventure and urban amenities, making it attractive for diverse travelers. | Strathcona Provincial Park, Cape Mudge Lighthouse, Discovery Passage, Tyee Marina, Quadra Island |
| Quadra Island | A serene and scenic island located just off the coast of Campbell River. Quadra Island offers beautiful nature trails, beaches, and a welcoming community, appealing to those seeking relaxation and outdoor experiences. | Rebecca Spit Marine Provincial Park, Heriot Bay, Quadra Island Distillery, Nuyumbalees Cultural Centre, Chatham Point |
| Nanaimo | A vibrant city on Vancouver Island with excellent dining, shopping, and outdoor experiences. Known for its beautiful harbor and proximity to numerous parks and recreation areas. | Nanaimo Harbourfront Walkway, Newcastle Island, Duke Point, Maffeo Sutton Park, Nanaimo Museum |
| Sechelt | Located on the Sunshine Coast, Sechelt is perfect for travelers looking for a peaceful retreat. Known for its beaches, hiking, and arts community, attracting both tourists and art lovers. | Sechelt Inlet, Porpoise Bay Provincial Park, Sunshine Coast Art Centre, Chater Lake, Lighthouse Park |
| Gibsons | A picturesque coastal community also located on the Sunshine Coast. Known for its seafood cuisine, local arts scene, and access to beautiful beaches, attracting visitors looking for relaxation and nature. | Gibsons Marina, Langdale Ferry Terminal, Gibsons Landing, Soames Hill Nature Trail, Armours Beach |
| Pender Harbour | A scenic and tranquil destination known for its beautiful bays and outdoor recreational opportunities. Ideal for water sports enthusiasts and those seeking a peaceful environment and nature. | Pender Harbour, Francis Point Provincial Park, Pender Harbour Aquatic Centre, Mundell Park, Garden Bay |
| Sunshine Coast | The Sunshine Coast is a popular retreat known for its stunning landscapes and vibrant artist community. Ideal for tourists looking for a blend of relaxation and artistic culture with access to nature. | Skookumchuk Narrows Provincial Park, Smuggler Cove Marine Provincial Park, Sunshine Coast Trail, Gibsons Public Market, Sechelt Marsh |
Understanding Airbnb License Requirements & STR Laws in Area B (Discovery Islands/Mainland Inlets) (2025)
While Area B (Discovery Islands/Mainland Inlets), British Columbia, Canada currently shows low STR regulations, specific Airbnb license requirements might still exist or change. Always verify the latest short term rental regulations and Airbnb license requirements directly with local government authorities for Area B (Discovery Islands/Mainland Inlets) to ensure full compliance before hosting.
(Source: AirROI data, 2025, finding no licensed listings among those analyzed)
Top Performing Airbnb Properties in Area B (Discovery Islands/Mainland Inlets) (2025)
Benchmark your potential! Explore examples of top-performing Airbnb properties in Area B (Discovery Islands/Mainland Inlets)based on Trailing Twelve Month (TTM) revenue. Analyze their characteristics, revenue, occupancy rate, and ADR to understand what drives success in this market.
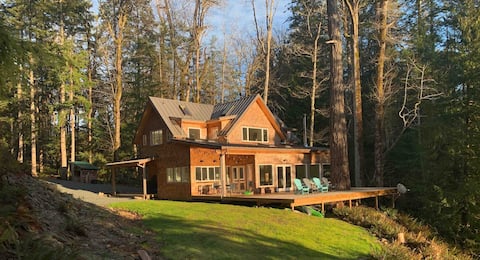
The Bay House - Quadra Island
Entire Place • 4 bedrooms

Topcliff Cottage Oceanview + HotTub & Beach Access
Entire Place • 5 bedrooms
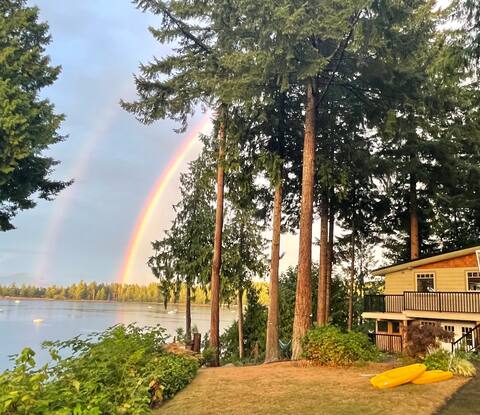
Quadra Island Waterfront Home at Rebecca Spit
Entire Place • 7 bedrooms
Oceanside Retreat - Expansive High Bank Views!
Entire Place • 2 bedrooms

Loftus House
Entire Place • 3 bedrooms

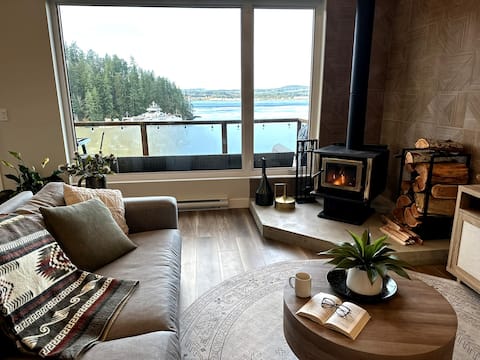
The April Point Harbour House.
Entire Place • 2 bedrooms
Note: Performance varies based on location, size, amenities, seasonality, and management quality. Data reflects the past 12 months.
Top Performing Airbnb Hosts in Area B (Discovery Islands/Mainland Inlets) (2025)
Learn from the best! This table showcases top-performing Airbnb hosts in Area B (Discovery Islands/Mainland Inlets) based on the number of properties managed and estimated total revenue over the past year. Analyze their scale and performance metrics.
| Host Name | Properties | Grossing Revenue | Stay Reviews | Avg Rating |
|---|---|---|---|---|
| Gowlland | 5 | $127,445 | 191 | 4.69/5.0 |
| Melissa | 2 | $102,896 | 144 | 5.00/5.0 |
| Nadia & Delano | 1 | $101,602 | 9 | 5.00/5.0 |
| Deborah | 1 | $97,419 | 75 | 4.88/5.0 |
| Patricia | 3 | $91,265 | 108 | 4.97/5.0 |
| Cynthia | 3 | $81,241 | 212 | 4.99/5.0 |
| Rosanne | 2 | $75,610 | 16 | 2.50/5.0 |
| Michael | 1 | $72,177 | 144 | 4.92/5.0 |
| Host #2916486 | 2 | $62,565 | 279 | 4.99/5.0 |
| Cindy | 1 | $60,651 | 18 | 5.00/5.0 |
Analyzing the strategies of top hosts, such as their property selection, pricing, and guest communication, can offer valuable lessons for optimizing your own Airbnb operations in Area B (Discovery Islands/Mainland Inlets).
Dive Deeper: Advanced Area B (Discovery Islands/Mainland Inlets) STR Market Data (2025)
Ready to unlock more insights? AirROI provides access to advanced metrics and comprehensive Airbnb data for Area B (Discovery Islands/Mainland Inlets). Explore detailed analytics beyond this report to refine your investment strategy, optimize pricing, and maximize your vacation rental profits.
Explore Advanced MetricsArea B (Discovery Islands/Mainland Inlets) Short-Term Rental Market Composition (2025): Property & Room Types
Room Type Distribution
Property Type Distribution
Market Composition Insights for Area B (Discovery Islands/Mainland Inlets)
- The Area B (Discovery Islands/Mainland Inlets) Airbnb market composition is heavily skewed towards Entire Home/Apt listings, which make up 98.6% of the 73 active rentals. This indicates strong guest preference for privacy and space.
- Looking at the property type distribution in Area B (Discovery Islands/Mainland Inlets), House properties are the most common (50.7%), reflecting the local real estate landscape.
- Houses represent a significant 50.7% portion, catering likely to families or larger groups.
- The presence of 8.2% Hotel/Boutique listings indicates integration with traditional hospitality.
- Smaller segments like apartment/condo, unique stays (combined 4.1%) offer potential for unique stay experiences.
Area B (Discovery Islands/Mainland Inlets) Airbnb Room Capacity Analysis (2025): Bedroom Distribution
Distribution of Listings by Number of Bedrooms
Room Capacity Insights for Area B (Discovery Islands/Mainland Inlets)
- The dominant room capacity in Area B (Discovery Islands/Mainland Inlets) is 1 bedroom listings, making up 37% of the market. This suggests a strong demand for properties suitable for couples or solo travelers.
- Together, 1 bedroom and 2 bedrooms properties represent 69.9% of the active Airbnb listings in Area B (Discovery Islands/Mainland Inlets), indicating a high concentration in these sizes.
Area B (Discovery Islands/Mainland Inlets) Vacation Rental Guest Capacity Trends (2025)
Distribution of Listings by Guest Capacity
Guest Capacity Insights for Area B (Discovery Islands/Mainland Inlets)
- The most common guest capacity trend in Area B (Discovery Islands/Mainland Inlets) vacation rentals is listings accommodating 2 guests (39.7%). This suggests the primary traveler segment is likely couples or solo travelers.
- Properties designed for 2 guests and 4 guests dominate the Area B (Discovery Islands/Mainland Inlets) STR market, accounting for 63.0% of listings.
- 27.5% of properties accommodate 6+ guests, serving the market segment for larger families or group travel in Area B (Discovery Islands/Mainland Inlets).
- On average, properties in Area B (Discovery Islands/Mainland Inlets) are equipped to host 4.1 guests.
Area B (Discovery Islands/Mainland Inlets) Airbnb Booking Patterns (2025): Available vs. Booked Days
Available Days Distribution
Booked Days Distribution
Booking Pattern Insights for Area B (Discovery Islands/Mainland Inlets)
- The most common availability pattern in Area B (Discovery Islands/Mainland Inlets) falls within the 181-270 days range, representing 45.2% of listings. This suggests many properties have significant open periods on their calendars.
- Approximately 80.8% of listings show high availability (181+ days open annually), indicating potential for increased bookings or specific owner usage patterns.
- For booked days, the 91-180 days range is most frequent in Area B (Discovery Islands/Mainland Inlets) (43.8%), reflecting common guest stay durations or potential owner blocking patterns.
- A notable 23.3% of properties secure long booking periods (181+ days booked per year), highlighting successful long-term rental strategies or significant owner usage.
Area B (Discovery Islands/Mainland Inlets) Airbnb Minimum Stay Requirements Analysis
Distribution of Listings by Minimum Night Requirement
1 Night
8 listings
11.8% of total
2 Nights
29 listings
42.6% of total
3 Nights
16 listings
23.5% of total
4-6 Nights
4 listings
5.9% of total
7-29 Nights
3 listings
4.4% of total
30+ Nights
8 listings
11.8% of total
Key Insights
- The most prevalent minimum stay requirement in Area B (Discovery Islands/Mainland Inlets) is 2 Nights, adopted by 42.6% of listings. This highlights the market's preference for shorter, flexible bookings.
- A significant segment (11.8%) caters to monthly stays (30+ nights) in Area B (Discovery Islands/Mainland Inlets), pointing to opportunities in the extended-stay market.
Recommendations
- Align with the market by considering a 2 Nights minimum stay, as 42.6% of Area B (Discovery Islands/Mainland Inlets) hosts use this setting.
- If feasible, allowing 1-night stays, especially midweek or during low season, could capture last-minute bookings, as only 11.8% currently do.
- A 2-night minimum appears standard (42.6%). Consider this for weekends or peak periods.
- Explore offering discounts for stays of 30+ nights to attract the 11.8% of the market seeking extended stays.
- Adjust minimum nights based on seasonality – potentially shorter during low season and longer during peak demand periods in Area B (Discovery Islands/Mainland Inlets).
Area B (Discovery Islands/Mainland Inlets) Airbnb Cancellation Policy Trends Analysis (2025)
Flexible
9 listings
13% of total
Moderate
22 listings
31.9% of total
Firm
25 listings
36.2% of total
Strict
13 listings
18.8% of total
Cancellation Policy Insights for Area B (Discovery Islands/Mainland Inlets)
- The prevailing Airbnb cancellation policy trend in Area B (Discovery Islands/Mainland Inlets) is Firm, used by 36.2% of listings.
- A majority (55.0%) of hosts in Area B (Discovery Islands/Mainland Inlets) utilize Firm or Strict policies, indicating a market where hosts prioritize booking security.
Recommendations for Hosts
- Consider adopting a Firm policy to align with the 36.2% market standard in Area B (Discovery Islands/Mainland Inlets).
- Regularly review your cancellation policy against competitors and market demand shifts in Area B (Discovery Islands/Mainland Inlets).
Area B (Discovery Islands/Mainland Inlets) STR Booking Lead Time Analysis (2025)
Average Booking Lead Time by Month
Booking Lead Time Insights for Area B (Discovery Islands/Mainland Inlets)
- The overall average booking lead time for vacation rentals in Area B (Discovery Islands/Mainland Inlets) is 78 days.
- Guests book furthest in advance for stays during July (average 148 days), likely coinciding with peak travel demand or local events.
- The shortest booking windows occur for stays in January (average 41 days), indicating more last-minute travel plans during this time.
- Seasonally, Summer (124 days avg.) sees the longest lead times, while Winter (48 days avg.) has the shortest, reflecting typical travel planning cycles.
Recommendations for Hosts
- Use the overall average lead time (78 days) as a baseline for your pricing and availability strategy in Area B (Discovery Islands/Mainland Inlets).
- For July stays, consider implementing length-of-stay discounts or slightly higher rates for bookings made less than 148 days out to capitalize on advance planning.
- Target marketing efforts for the Summer season well in advance (at least 124 days) to capture early planners.
- Monitor your own booking lead times against these Area B (Discovery Islands/Mainland Inlets) averages to identify opportunities for dynamic pricing adjustments.
Popular & Essential Airbnb Amenities in Area B (Discovery Islands/Mainland Inlets) (2025)
Amenity Prevalence
Amenity Insights for Area B (Discovery Islands/Mainland Inlets)
- Essential amenities in Area B (Discovery Islands/Mainland Inlets) that guests expect include: Wifi, Heating. Lacking these (any) could significantly impact bookings.
- Popular amenities like Kitchen, Smoke alarm, Essentials are common but not universal. Offering these can provide a competitive edge.
Recommendations for Hosts
- Ensure your listing includes all essential amenities for Area B (Discovery Islands/Mainland Inlets): Wifi, Heating.
- Prioritize adding missing essentials: Wifi, Heating.
- Consider adding popular differentiators like Kitchen or Smoke alarm to increase appeal.
- Highlight unique or less common amenities you offer (e.g., hot tub, dedicated workspace, EV charger) in your listing description and photos.
- Regularly check competitor amenities in Area B (Discovery Islands/Mainland Inlets) to stay competitive.
Area B (Discovery Islands/Mainland Inlets) Airbnb Guest Demographics & Profile Analysis (2025)
Guest Profile Summary for Area B (Discovery Islands/Mainland Inlets)
- The typical guest profile for Airbnb in Area B (Discovery Islands/Mainland Inlets) consists of primarily domestic travelers (81%), often arriving from nearby Vancouver, typically belonging to the Post-2000s (Gen Z/Alpha) group (50%), primarily speaking English or French.
- Domestic travelers account for 80.5% of guests.
- Key international markets include Canada (80.5%) and United States (10.3%).
- Top languages spoken are English (64.2%) followed by French (13.2%).
- A significant demographic segment is the Post-2000s (Gen Z/Alpha) group, representing 50% of guests.
Recommendations for Hosts
- Target domestic marketing efforts towards travelers from Vancouver and Victoria.
- Tailor amenities and listing descriptions to appeal to the dominant Post-2000s (Gen Z/Alpha) demographic (e.g., highlight fast WiFi, smart home features, local guides).
- Highlight unique local experiences or amenities relevant to the primary guest profile.
- Consider seasonal promotions aligned with peak travel times for key origin markets.
Nearby Short-Term Rental Market Comparison
How does the Area B (Discovery Islands/Mainland Inlets) Airbnb market stack up against its neighbors? Compare key performance metrics like average monthly revenue, ADR, and occupancy rates in surrounding areas to understand the broader regional STR landscape.
| Market | Active Properties | Monthly Revenue | Daily Rate | Avg. Occupancy |
|---|---|---|---|---|
| Tofino | 331 | $4,937 | $285.11 | 57% |
| Area D (Sproat Lake) | 47 | $2,669 | $272.99 | 45% |
| Area C (Puntledge/Black Creek) | 219 | $2,431 | $211.20 | 48% |
| Area D (Oyster Bay/Buttle Lake) | 37 | $2,413 | $172.67 | 52% |
| Area H (Lighthouse Country) | 107 | $2,410 | $187.27 | 53% |
| Parksville | 156 | $2,164 | $174.86 | 48% |
| Area A (Baynes Sound) | 146 | $2,023 | $186.43 | 49% |
| Area A (Egmont/Pender Harbour) | 114 | $2,013 | $219.56 | 41% |
| Area B (Lazo North) | 79 | $2,003 | $158.19 | 54% |
| Area E (Beaver Creek) | 10 | $1,960 | $157.83 | 43% |