Area A (Cassidy/Cedar) Airbnb Market Analysis 2025: Short Term Rental Data & Vacation Rental Statistics in British Columbia, Canada
Is Airbnb profitable in Area A (Cassidy/Cedar) in 2025? Explore comprehensive Airbnb analytics for Area A (Cassidy/Cedar), British Columbia, Canada to uncover income potential. This 2025 STR market report for Area A (Cassidy/Cedar), based on AirROI data from April 2024 to March 2025, reveals key trends in the niche market of 33 active listings.
Whether you're considering an Airbnb investment in Area A (Cassidy/Cedar), optimizing your existing vacation rental, or exploring rental arbitrage opportunities, understanding the Area A (Cassidy/Cedar) Airbnb data is crucial. Leveraging the low regulation environment is key to maximizing your short term rental income potential. Let's dive into the specifics.
Key Area A (Cassidy/Cedar) Airbnb Performance Metrics Overview
Monthly Airbnb Revenue Variations & Income Potential in Area A (Cassidy/Cedar) (2025)
Understanding the monthly revenue variations for Airbnb listings in Area A (Cassidy/Cedar) is key to maximizing your short term rental income potential. Seasonality significantly impacts earnings. Our analysis, based on data from the past 12 months, shows that the peak revenue month for STRs in Area A (Cassidy/Cedar) is typically August, while January often presents the lowest earnings, highlighting opportunities for strategic pricing adjustments during shoulder and low seasons. Explore the typical Airbnb income in Area A (Cassidy/Cedar) across different performance tiers:
- Best-in-class properties (Top 10%) achieve $4,005+ monthly, often utilizing dynamic pricing and superior guest experiences.
- Strong performing properties (Top 25%) earn $2,626 or more, indicating effective management and desirable locations/amenities.
- Typical properties (Median) generate around $1,623 per month, representing the average market performance.
- Entry-level properties (Bottom 25%) see earnings around $930, often with potential for optimization.
Average Monthly Airbnb Earnings Trend in Area A (Cassidy/Cedar)
Area A (Cassidy/Cedar) Airbnb Occupancy Rate Trends (2025)
Maximize your bookings by understanding the Area A (Cassidy/Cedar) STR occupancy trends. Seasonal demand shifts significantly influence how often properties are booked. Typically, Augustsees the highest demand (peak season occupancy), while January experiences the lowest (low season). Effective strategies, like adjusting minimum stays or offering promotions, can boost occupancy during slower periods. Here's how different property tiers perform in Area A (Cassidy/Cedar):
- Best-in-class properties (Top 10%) achieve 80%+ occupancy, indicating high desirability and potentially optimized availability.
- Strong performing properties (Top 25%) maintain 65% or higher occupancy, suggesting good market fit and guest satisfaction.
- Typical properties (Median) have an occupancy rate around 41%.
- Entry-level properties (Bottom 25%) average 22% occupancy, potentially facing higher vacancy.
Average Monthly Occupancy Rate Trend in Area A (Cassidy/Cedar)
Average Daily Rate (ADR) Airbnb Trends in Area A (Cassidy/Cedar) (2025)
Effective short term rental pricing strategy in Area A (Cassidy/Cedar) involves understanding monthly ADR fluctuations. The Average Daily Rate (ADR) for Airbnb in Area A (Cassidy/Cedar) typically peaks in August and dips lowest during November. Leveraging Airbnb dynamic pricing tools or strategies based on this seasonality can significantly boost revenue. Here's a look at the typical nightly rates achieved:
- Best-in-class properties (Top 10%) command rates of $224+ per night, often due to premium features or locations.
- Strong performing properties (Top 25%) achieve nightly rates of $165 or more.
- Typical properties (Median) charge around $109 per night.
- Entry-level properties (Bottom 25%) earn around $79 per night.
Average Daily Rate (ADR) Trend by Month in Area A (Cassidy/Cedar)
Get Live Area A (Cassidy/Cedar) Market Intelligence 👇
.png)
Explore Real-time Analytics
Airbnb Seasonality Analysis & Trends in Area A (Cassidy/Cedar) (2025)
Peak Season (August, July, May)
- Revenue averages $2,912 per month
- Occupancy rates average 54.4%
- Daily rates average $155
Shoulder Season
- Revenue averages $1,890 per month
- Occupancy maintains around 42.6%
- Daily rates hold near $144
Low Season (January, November, December)
- Revenue drops to average $1,348 per month
- Occupancy decreases to average 35.7%
- Daily rates adjust to average $129
Seasonality Insights for Area A (Cassidy/Cedar)
- The Airbnb seasonality in Area A (Cassidy/Cedar) shows highly seasonal trends requiring careful strategy. While the sections above show seasonal averages, it's also insightful to look at the extremes:
- During the high season, the absolute peak month showcases Area A (Cassidy/Cedar)'s highest earning potential, with monthly revenues capable of climbing to $3,323, occupancy reaching a high of 63.3%, and ADRs peaking at $158.
- Conversely, the slowest single month of the year, typically falling within the low season, marks the market's lowest point. In this month, revenue might dip to $1,180, occupancy could drop to 28.3%, and ADRs may adjust down to $126.
- Understanding both the seasonal averages and these monthly peaks and troughs in revenue, occupancy, and ADR is crucial for maximizing your Airbnb profit potential in Area A (Cassidy/Cedar).
Seasonal Strategies for Maximizing Profit
- Peak Season: Maximize revenue through premium pricing and potentially longer minimum stays. Ensure high availability.
- Low Season: Offer competitive pricing, special promotions (e.g., extended stay discounts), and flexible cancellation policies. Target off-season travelers like remote workers or budget-conscious guests.
- Shoulder Seasons: Implement dynamic pricing that balances peak and low rates. Target weekend travelers or specific events. Offer slightly more flexible terms than peak season.
- Regularly analyze your own performance against these Area A (Cassidy/Cedar) seasonality benchmarks and adjust your pricing and availability strategy accordingly.
Best Areas for Airbnb Investment in Area A (Cassidy/Cedar) (2025)
Exploring the top neighborhoods for short-term rentals in Area A (Cassidy/Cedar)? This section highlights key areas, outlining why they are attractive for hosts and guests, along with notable local attractions. Consider these locations based on your target guest profile and investment strategy.
| Neighborhood / Area | Why Host Here? (Target Guests & Appeal) | Key Attractions & Landmarks |
|---|---|---|
| Cassidy | Quiet rural community known for its lush landscapes and proximity to outdoor activities. Great for guests looking for a peaceful countryside escape while still being close to urban amenities in Nanaimo. | Duncan River, Butterfly Gardens, Maple Bay Marina, Cowichan Valley Wine Tour, Local farms and markets |
| Cedar | Charming suburban area with a close-knit community feel and beautiful parks. Ideal for travelers seeking outdoor recreation including hiking and biking trails. | Cedar Creek Park, Cedar By-the-Sea Park, Vancouver Island University, Local beaches, Cedar Farmers Market |
| Nanaimo Downtown | Vibrant waterfront city with shops, restaurants, and cultural attractions. Attracts tourists due to its scenic harbor and ferry connections to Vancouver. | Nanaimo Harbour, Dinghy Dock Pub, Nanaimo Museum, Newcastle Island, The waterfront walkway |
| Parksville | Famous for its warm beaches and oceanfront parks, making it a top destination for families and beachgoers. | Parksville Beach, Englishman River Regional Park, Rathtrevor Beach Provincial Park, Local festivals and events, Beach volleyball courts |
| Qualicum Beach | Beautiful seaside village known for its sandy shores and vibrant local arts scene. Popular with visitors looking for a quaint coastal experience. | Qualicum Beach Heritage Forest, Milner Gardens & Woodlands, Qualicum Beach Farmers Market, Beach access points, Summer art fairs |
| Cowichan Bay | Picturesque seaside village with a rich marine heritage, great for eco-tourism and seafood lovers. | Cowichan Bay Maritime Centre, Kayaking and boating opportunities, Local restaurants featuring seafood, Cowichan Estuary Nature Centre, Wildlife viewing |
| Ladysmith | Historic town with a charming waterfront, offering outdoor activities and a close-knit community environment. Attractive for travelers seeking local culture. | Ladysmith Waterfront Gallery, Transfer Beach Park, Local boutiques and shops, Chemainus murals nearby, Hiking trails in surrounding areas |
| Duncan | Known as the heart of Cowichan Valley, with rich Indigenous culture and history. Ideal for guests interested in cultural experiences and outdoor adventures. | World's Largest Totem Pole, Cowichan Valley Museum, Local wineries and breweries, Cowichan River, Historic downtown shops |
Understanding Airbnb License Requirements & STR Laws in Area A (Cassidy/Cedar) (2025)
While Area A (Cassidy/Cedar), British Columbia, Canada currently shows low STR regulations, specific Airbnb license requirements might still exist or change. Always verify the latest short term rental regulations and Airbnb license requirements directly with local government authorities for Area A (Cassidy/Cedar) to ensure full compliance before hosting.
(Source: AirROI data, 2025, finding no licensed listings among those analyzed)
Top Performing Airbnb Properties in Area A (Cassidy/Cedar) (2025)
Benchmark your potential! Explore examples of top-performing Airbnb properties in Area A (Cassidy/Cedar)based on Trailing Twelve Month (TTM) revenue. Analyze their characteristics, revenue, occupancy rate, and ADR to understand what drives success in this market.

Sea La Vie Garden House
Entire Place • 4 bedrooms
Coal House: 2 Bedroom Guesthouse with Hot Tub
Entire Place • 2 bedrooms

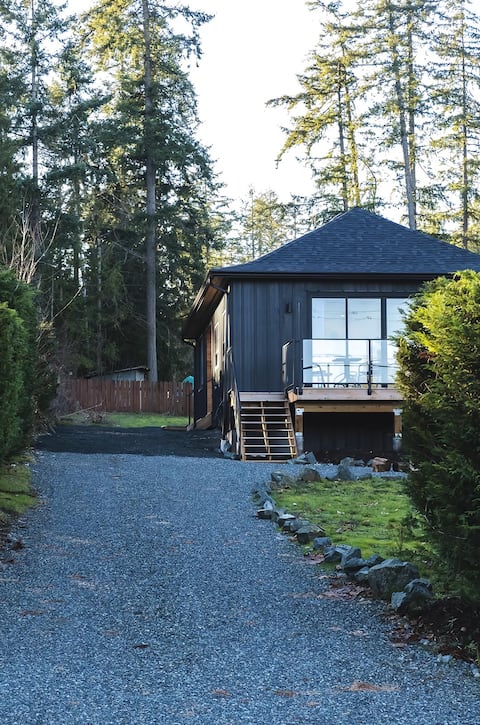
Panoramic Ocean View Escape
Entire Place • 2 bedrooms

Upper Suite Riverfront Property
Entire Place • 3 bedrooms
Linda's lakeside cottage
Entire Place • 2 bedrooms

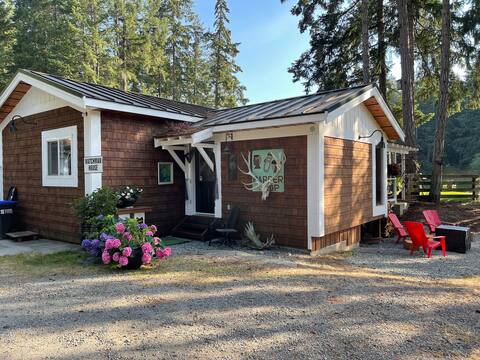
Cozy Garden Cabin in Cedar
Entire Place • 1 bedroom
Note: Performance varies based on location, size, amenities, seasonality, and management quality. Data reflects the past 12 months.
Top Performing Airbnb Hosts in Area A (Cassidy/Cedar) (2025)
Learn from the best! This table showcases top-performing Airbnb hosts in Area A (Cassidy/Cedar) based on the number of properties managed and estimated total revenue over the past year. Analyze their scale and performance metrics.
| Host Name | Properties | Grossing Revenue | Stay Reviews | Avg Rating |
|---|---|---|---|---|
| Nancy | 3 | $81,192 | 50 | 4.77/5.0 |
| Stephanie | 1 | $43,279 | 116 | 5.00/5.0 |
| Kitty | 1 | $42,725 | 81 | 4.98/5.0 |
| Lori | 1 | $42,491 | 136 | 4.93/5.0 |
| Linda | 1 | $42,166 | 49 | 4.94/5.0 |
| Scarlett | 1 | $25,030 | 176 | 4.94/5.0 |
| Bernadette | 3 | $24,794 | 122 | 4.88/5.0 |
| Lauren | 1 | $21,776 | 172 | 4.95/5.0 |
| Alan & Gillian | 1 | $21,317 | 835 | 4.84/5.0 |
| Kathleen | 1 | $21,310 | 26 | 4.92/5.0 |
Analyzing the strategies of top hosts, such as their property selection, pricing, and guest communication, can offer valuable lessons for optimizing your own Airbnb operations in Area A (Cassidy/Cedar).
Dive Deeper: Advanced Area A (Cassidy/Cedar) STR Market Data (2025)
Ready to unlock more insights? AirROI provides access to advanced metrics and comprehensive Airbnb data for Area A (Cassidy/Cedar). Explore detailed analytics beyond this report to refine your investment strategy, optimize pricing, and maximize your vacation rental profits.
Explore Advanced MetricsArea A (Cassidy/Cedar) Short-Term Rental Market Composition (2025): Property & Room Types
Room Type Distribution
Property Type Distribution
Market Composition Insights for Area A (Cassidy/Cedar)
- The Area A (Cassidy/Cedar) Airbnb market composition is heavily skewed towards Entire Home/Apt listings, which make up 93.9% of the 33 active rentals. This indicates strong guest preference for privacy and space.
- Looking at the property type distribution in Area A (Cassidy/Cedar), House properties are the most common (33.3%), reflecting the local real estate landscape.
- Houses represent a significant 33.3% portion, catering likely to families or larger groups.
- The presence of 18.2% Hotel/Boutique listings indicates integration with traditional hospitality.
Area A (Cassidy/Cedar) Airbnb Room Capacity Analysis (2025): Bedroom Distribution
Distribution of Listings by Number of Bedrooms
Room Capacity Insights for Area A (Cassidy/Cedar)
- The dominant room capacity in Area A (Cassidy/Cedar) is 1 bedroom listings, making up 48.5% of the market. This suggests a strong demand for properties suitable for couples or solo travelers.
- Together, 1 bedroom and 2 bedrooms properties represent 78.8% of the active Airbnb listings in Area A (Cassidy/Cedar), indicating a high concentration in these sizes.
Area A (Cassidy/Cedar) Vacation Rental Guest Capacity Trends (2025)
Distribution of Listings by Guest Capacity
Guest Capacity Insights for Area A (Cassidy/Cedar)
- The most common guest capacity trend in Area A (Cassidy/Cedar) vacation rentals is listings accommodating 2 guests (36.4%). This suggests the primary traveler segment is likely couples or solo travelers.
- Properties designed for 2 guests and 4 guests dominate the Area A (Cassidy/Cedar) STR market, accounting for 63.7% of listings.
- 24.2% of properties accommodate 6+ guests, serving the market segment for larger families or group travel in Area A (Cassidy/Cedar).
- On average, properties in Area A (Cassidy/Cedar) are equipped to host 3.8 guests.
Area A (Cassidy/Cedar) Airbnb Booking Patterns (2025): Available vs. Booked Days
Available Days Distribution
Booked Days Distribution
Booking Pattern Insights for Area A (Cassidy/Cedar)
- The most common availability pattern in Area A (Cassidy/Cedar) falls within the 271-366 days range, representing 39.4% of listings. This suggests many properties have significant open periods on their calendars.
- Approximately 63.6% of listings show high availability (181+ days open annually), indicating potential for increased bookings or specific owner usage patterns.
- For booked days, the 91-180 days range is most frequent in Area A (Cassidy/Cedar) (27.3%), reflecting common guest stay durations or potential owner blocking patterns.
- A notable 36.3% of properties secure long booking periods (181+ days booked per year), highlighting successful long-term rental strategies or significant owner usage.
Area A (Cassidy/Cedar) Airbnb Minimum Stay Requirements Analysis
Distribution of Listings by Minimum Night Requirement
1 Night
6 listings
20.7% of total
2 Nights
12 listings
41.4% of total
3 Nights
4 listings
13.8% of total
4-6 Nights
2 listings
6.9% of total
30+ Nights
5 listings
17.2% of total
Key Insights
- The most prevalent minimum stay requirement in Area A (Cassidy/Cedar) is 2 Nights, adopted by 41.4% of listings. This highlights the market's preference for shorter, flexible bookings.
- A strong majority (62.1%) of the Area A (Cassidy/Cedar) Airbnb data shows acceptance of very short stays (1-2 nights), indicating a dynamic, high-turnover market.
- A significant segment (17.2%) caters to monthly stays (30+ nights) in Area A (Cassidy/Cedar), pointing to opportunities in the extended-stay market.
Recommendations
- Align with the market by considering a 2 Nights minimum stay, as 41.4% of Area A (Cassidy/Cedar) hosts use this setting.
- If feasible, allowing 1-night stays, especially midweek or during low season, could capture last-minute bookings, as only 20.7% currently do.
- Explore offering discounts for stays of 30+ nights to attract the 17.2% of the market seeking extended stays.
- Adjust minimum nights based on seasonality – potentially shorter during low season and longer during peak demand periods in Area A (Cassidy/Cedar).
Area A (Cassidy/Cedar) Airbnb Cancellation Policy Trends Analysis (2025)
Super Strict 60 Days
1 listings
3.4% of total
Flexible
8 listings
27.6% of total
Moderate
6 listings
20.7% of total
Firm
11 listings
37.9% of total
Strict
3 listings
10.3% of total
Cancellation Policy Insights for Area A (Cassidy/Cedar)
- The prevailing Airbnb cancellation policy trend in Area A (Cassidy/Cedar) is Firm, used by 37.9% of listings.
- There's a relatively balanced mix between guest-friendly (48.3%) and stricter (48.2%) policies, offering choices for different guest needs.
Recommendations for Hosts
- Consider adopting a Firm policy to align with the 37.9% market standard in Area A (Cassidy/Cedar).
- Using a Strict policy might deter some guests, as only 10.3% of listings use it. Evaluate if potential revenue protection outweighs possible lower booking rates.
- Regularly review your cancellation policy against competitors and market demand shifts in Area A (Cassidy/Cedar).
Area A (Cassidy/Cedar) STR Booking Lead Time Analysis (2025)
Average Booking Lead Time by Month
Booking Lead Time Insights for Area A (Cassidy/Cedar)
- The overall average booking lead time for vacation rentals in Area A (Cassidy/Cedar) is 40 days.
- Guests book furthest in advance for stays during July (average 63 days), likely coinciding with peak travel demand or local events.
- The shortest booking windows occur for stays in February (average 22 days), indicating more last-minute travel plans during this time.
- Seasonally, Summer (60 days avg.) sees the longest lead times, while Winter (33 days avg.) has the shortest, reflecting typical travel planning cycles.
Recommendations for Hosts
- Use the overall average lead time (40 days) as a baseline for your pricing and availability strategy in Area A (Cassidy/Cedar).
- For July stays, consider implementing length-of-stay discounts or slightly higher rates for bookings made less than 63 days out to capitalize on advance planning.
- Target marketing efforts for the Summer season well in advance (at least 60 days) to capture early planners.
- Monitor your own booking lead times against these Area A (Cassidy/Cedar) averages to identify opportunities for dynamic pricing adjustments.
Popular & Essential Airbnb Amenities in Area A (Cassidy/Cedar) (2025)
Amenity Prevalence
Amenity Insights for Area A (Cassidy/Cedar)
- Essential amenities in Area A (Cassidy/Cedar) that guests expect include: Free parking on premises. Lacking these (this) could significantly impact bookings.
- Popular amenities like Dishes and silverware, Heating, Refrigerator are common but not universal. Offering these can provide a competitive edge.
Recommendations for Hosts
- Ensure your listing includes all essential amenities for Area A (Cassidy/Cedar): Free parking on premises.
- Prioritize adding missing essentials: Free parking on premises.
- Consider adding popular differentiators like Dishes and silverware or Heating to increase appeal.
- Highlight unique or less common amenities you offer (e.g., hot tub, dedicated workspace, EV charger) in your listing description and photos.
- Regularly check competitor amenities in Area A (Cassidy/Cedar) to stay competitive.
Area A (Cassidy/Cedar) Airbnb Guest Demographics & Profile Analysis (2025)
Guest Profile Summary for Area A (Cassidy/Cedar)
- The typical guest profile for Airbnb in Area A (Cassidy/Cedar) consists of primarily domestic travelers (74%), often arriving from nearby Vancouver, typically belonging to the Post-2000s (Gen Z/Alpha) group (50%), primarily speaking English or French.
- Domestic travelers account for 73.7% of guests.
- Key international markets include Canada (73.7%) and United States (13.8%).
- Top languages spoken are English (62.2%) followed by French (10.3%).
- A significant demographic segment is the Post-2000s (Gen Z/Alpha) group, representing 50% of guests.
Recommendations for Hosts
- Target domestic marketing efforts towards travelers from Vancouver and Victoria.
- Tailor amenities and listing descriptions to appeal to the dominant Post-2000s (Gen Z/Alpha) demographic (e.g., highlight fast WiFi, smart home features, local guides).
- Highlight unique local experiences or amenities relevant to the primary guest profile.
- Consider seasonal promotions aligned with peak travel times for key origin markets.
Nearby Short-Term Rental Market Comparison
How does the Area A (Cassidy/Cedar) Airbnb market stack up against its neighbors? Compare key performance metrics like average monthly revenue, ADR, and occupancy rates in surrounding areas to understand the broader regional STR landscape.
| Market | Active Properties | Monthly Revenue | Daily Rate | Avg. Occupancy |
|---|---|---|---|---|
| Lake Goodwin | 11 | $4,949 | $371.43 | 44% |
| Cape George Colony Club | 10 | $4,770 | $257.49 | 59% |
| Sudden Valley | 65 | $4,390 | $286.32 | 53% |
| Orcas Island | 13 | $4,220 | $514.57 | 39% |
| Friday Harbor | 219 | $4,187 | $371.96 | 45% |
| Eastsound | 260 | $4,048 | $335.49 | 43% |
| Lopez Island | 40 | $4,002 | $343.46 | 41% |
| Oak Harbor | 128 | $3,944 | $279.04 | 49% |
| Warm Beach | 14 | $3,769 | $282.16 | 44% |
| Greenbank | 42 | $3,729 | $322.97 | 43% |