Town of Cardston Airbnb Market Analysis 2025: Short Term Rental Data & Vacation Rental Statistics in Alberta, Canada
Is Airbnb profitable in Town of Cardston in 2025? Explore comprehensive Airbnb analytics for Town of Cardston, Alberta, Canada to uncover income potential. This 2025 STR market report for Town of Cardston, based on AirROI data from April 2024 to March 2025, reveals key trends in the niche market of 17 active listings.
Whether you're considering an Airbnb investment in Town of Cardston, optimizing your existing vacation rental, or exploring rental arbitrage opportunities, understanding the Town of Cardston Airbnb data is crucial. Leveraging the low regulation environment is key to maximizing your short term rental income potential. Let's dive into the specifics.
Key Town of Cardston Airbnb Performance Metrics Overview
Monthly Airbnb Revenue Variations & Income Potential in Town of Cardston (2025)
Understanding the monthly revenue variations for Airbnb listings in Town of Cardston is key to maximizing your short term rental income potential. Seasonality significantly impacts earnings. Our analysis, based on data from the past 12 months, shows that the peak revenue month for STRs in Town of Cardston is typically August, while January often presents the lowest earnings, highlighting opportunities for strategic pricing adjustments during shoulder and low seasons. Explore the typical Airbnb income in Town of Cardston across different performance tiers:
- Best-in-class properties (Top 10%) achieve $4,739+ monthly, often utilizing dynamic pricing and superior guest experiences.
- Strong performing properties (Top 25%) earn $3,276 or more, indicating effective management and desirable locations/amenities.
- Typical properties (Median) generate around $2,027 per month, representing the average market performance.
- Entry-level properties (Bottom 25%) see earnings around $1,327, often with potential for optimization.
Average Monthly Airbnb Earnings Trend in Town of Cardston
Town of Cardston Airbnb Occupancy Rate Trends (2025)
Maximize your bookings by understanding the Town of Cardston STR occupancy trends. Seasonal demand shifts significantly influence how often properties are booked. Typically, Augustsees the highest demand (peak season occupancy), while January experiences the lowest (low season). Effective strategies, like adjusting minimum stays or offering promotions, can boost occupancy during slower periods. Here's how different property tiers perform in Town of Cardston:
- Best-in-class properties (Top 10%) achieve 70%+ occupancy, indicating high desirability and potentially optimized availability.
- Strong performing properties (Top 25%) maintain 58% or higher occupancy, suggesting good market fit and guest satisfaction.
- Typical properties (Median) have an occupancy rate around 41%.
- Entry-level properties (Bottom 25%) average 27% occupancy, potentially facing higher vacancy.
Average Monthly Occupancy Rate Trend in Town of Cardston
Average Daily Rate (ADR) Airbnb Trends in Town of Cardston (2025)
Effective short term rental pricing strategy in Town of Cardston involves understanding monthly ADR fluctuations. The Average Daily Rate (ADR) for Airbnb in Town of Cardston typically peaks in December and dips lowest during October. Leveraging Airbnb dynamic pricing tools or strategies based on this seasonality can significantly boost revenue. Here's a look at the typical nightly rates achieved:
- Best-in-class properties (Top 10%) command rates of $301+ per night, often due to premium features or locations.
- Strong performing properties (Top 25%) achieve nightly rates of $223 or more.
- Typical properties (Median) charge around $127 per night.
- Entry-level properties (Bottom 25%) earn around $99 per night.
Average Daily Rate (ADR) Trend by Month in Town of Cardston
Get Live Town of Cardston Market Intelligence 👇

Explore Real-time Analytics
Airbnb Seasonality Analysis & Trends in Town of Cardston (2025)
Peak Season (August, July, June)
- Revenue averages $4,165 per month
- Occupancy rates average 68.6%
- Daily rates average $167
Shoulder Season
- Revenue averages $2,285 per month
- Occupancy maintains around 41.4%
- Daily rates hold near $163
Low Season (January, February, March)
- Revenue drops to average $1,026 per month
- Occupancy decreases to average 25.0%
- Daily rates adjust to average $172
Seasonality Insights for Town of Cardston
- The Airbnb seasonality in Town of Cardston shows highly seasonal trends requiring careful strategy. While the sections above show seasonal averages, it's also insightful to look at the extremes:
- During the high season, the absolute peak month showcases Town of Cardston's highest earning potential, with monthly revenues capable of climbing to $4,691, occupancy reaching a high of 80.0%, and ADRs peaking at $179.
- Conversely, the slowest single month of the year, typically falling within the low season, marks the market's lowest point. In this month, revenue might dip to $585, occupancy could drop to 13.7%, and ADRs may adjust down to $156.
- Understanding both the seasonal averages and these monthly peaks and troughs in revenue, occupancy, and ADR is crucial for maximizing your Airbnb profit potential in Town of Cardston.
Seasonal Strategies for Maximizing Profit
- Peak Season: Maximize revenue through premium pricing and potentially longer minimum stays. Ensure high availability.
- Low Season: Offer competitive pricing, special promotions (e.g., extended stay discounts), and flexible cancellation policies. Target off-season travelers like remote workers or budget-conscious guests.
- Shoulder Seasons: Implement dynamic pricing that balances peak and low rates. Target weekend travelers or specific events. Offer slightly more flexible terms than peak season.
- Regularly analyze your own performance against these Town of Cardston seasonality benchmarks and adjust your pricing and availability strategy accordingly.
Best Areas for Airbnb Investment in Town of Cardston (2025)
Exploring the top neighborhoods for short-term rentals in Town of Cardston? This section highlights key areas, outlining why they are attractive for hosts and guests, along with notable local attractions. Consider these locations based on your target guest profile and investment strategy.
| Neighborhood / Area | Why Host Here? (Target Guests & Appeal) | Key Attractions & Landmarks |
|---|---|---|
| Cardston Historical District | This area is rich in history with beautiful, well-preserved buildings from the early 20th century. Ideal for guests interested in the history and culture of Cardston. | Cardston Alberta Temple, Remington Carriage Museum, Cardston and District Community Heritage Board, Historic Cardston Main Street, Cardston Library |
| Willow Creek | Located near the picturesque Willow Creek, this area offers beautiful views and outdoor activities. Perfect for nature lovers and those seeking tranquility. | Willow Creek, Picnic areas, Outdoor walking trails, Bird watching, Fishing spots |
| Chief Mountain Region | A gateway to stunning scenery and outdoor adventures. Popular with hikers, campers, and those looking to explore the nearby Waterton Lakes National Park. | Waterton Lakes National Park, Chief Mountain, Hiking trails, Wildlife viewing, Camping sites |
| Cardston Lake | A serene lake setting, great for water activities, relaxation, and family gatherings. Inviting for visitors looking for a peaceful retreat. | Cardston Lake, Swimming and boating, Parks and picnic areas, Fishing, Nature walks |
| Downtown Cardston | The heart of the town filled with local shops, cafes, and restaurants. Great for visitors who want to enjoy local cuisine and socialize. | Local restaurants, Cardston Arts Festival, Shopping boutiques, Coffee shops, Community events |
| Kenyon Park | A family-friendly area with parks and recreational facilities, ideal for families traveling with children or anyone looking for community interaction. | Kenyon Park playground, Sports fields, Walking paths, Community events, Picnic spaces |
| Alberta Bear Ranch | A unique attraction allowing visitors to see bears up close. Appeals to tourists seeking a unique experience and wildlife enthusiasts. | Alberta Bear Ranch, Wildlife encounters, Guided tours, Educational programs, Photography opportunities |
| St. Mary's River | A beautiful area for those who enjoy river activities such as kayaking, fishing, and scenic walks. Perfect for nature-focused travelers. | St. Mary's River, Kayaking opportunities, Fishing spots, Scenic trails, Wildlife observation |
Understanding Airbnb License Requirements & STR Laws in Town of Cardston (2025)
While Town of Cardston, Alberta, Canada currently shows low STR regulations, specific Airbnb license requirements might still exist or change. Always verify the latest short term rental regulations and Airbnb license requirements directly with local government authorities for Town of Cardston to ensure full compliance before hosting.
(Source: AirROI data, 2025, finding no licensed listings among those analyzed)
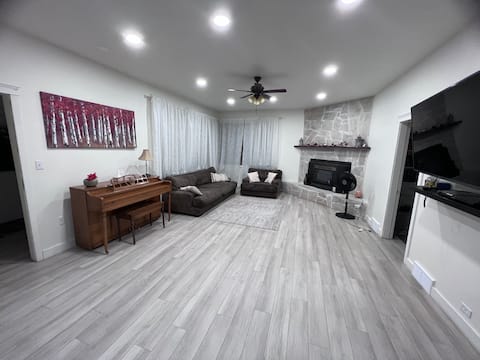
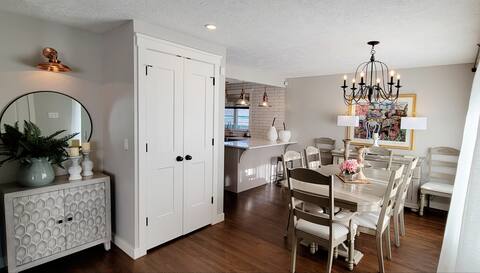
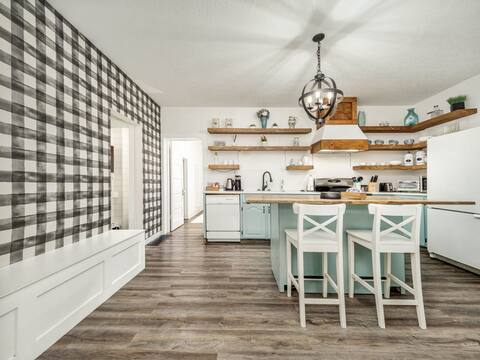
Top Performing Airbnb Properties in Town of Cardston (2025)
Benchmark your potential! Explore examples of top-performing Airbnb properties in Town of Cardstonbased on Trailing Twelve Month (TTM) revenue. Analyze their characteristics, revenue, occupancy rate, and ADR to understand what drives success in this market.

Light Haven
Entire Place • 7 bedrooms

Cheerful 3 Bedroom Main Floor Private Suite Near W
Entire Place • 3 bedrooms
Full house in Cardston with attached private suite
Entire Place • 4 bedrooms
Spacious, newly renovated home, in Cardston, AB
Entire Place • 5 bedrooms
3 Bedroom Century Home Near Waterton & US Border
Entire Place • 3 bedrooms
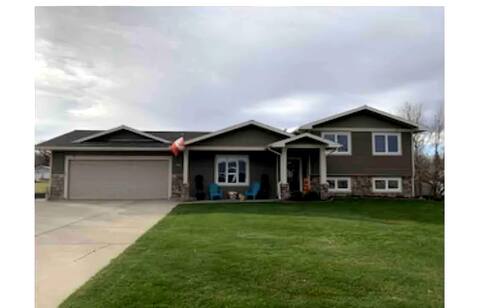
Cardston Hilltop House, fully renovated 4 bedroom
Entire Place • 4 bedrooms
Note: Performance varies based on location, size, amenities, seasonality, and management quality. Data reflects the past 12 months.
Top Performing Airbnb Hosts in Town of Cardston (2025)
Learn from the best! This table showcases top-performing Airbnb hosts in Town of Cardston based on the number of properties managed and estimated total revenue over the past year. Analyze their scale and performance metrics.
| Host Name | Properties | Grossing Revenue | Stay Reviews | Avg Rating |
|---|---|---|---|---|
| Leslie | 2 | $67,877 | 157 | 4.76/5.0 |
| Diane M | 1 | $52,371 | 14 | 5.00/5.0 |
| Dawnette | 2 | $44,705 | 98 | 4.97/5.0 |
| Derek And Meg | 1 | $36,139 | 15 | 4.60/5.0 |
| Paul | 2 | $32,926 | 61 | 4.79/5.0 |
| Gail And George | 1 | $31,135 | 37 | 4.97/5.0 |
| Colin | 1 | $29,170 | 40 | 4.98/5.0 |
| Shelley | 1 | $21,885 | 13 | 4.92/5.0 |
| Minerva | 1 | $21,400 | 41 | 4.85/5.0 |
| Lisa Marie | 1 | $19,939 | 24 | 5.00/5.0 |
Analyzing the strategies of top hosts, such as their property selection, pricing, and guest communication, can offer valuable lessons for optimizing your own Airbnb operations in Town of Cardston.
Dive Deeper: Advanced Town of Cardston STR Market Data (2025)
Ready to unlock more insights? AirROI provides access to advanced metrics and comprehensive Airbnb data for Town of Cardston. Explore detailed analytics beyond this report to refine your investment strategy, optimize pricing, and maximize your vacation rental profits.
Explore Advanced MetricsTown of Cardston Short-Term Rental Market Composition (2025): Property & Room Types
Room Type Distribution
Property Type Distribution
Market Composition Insights for Town of Cardston
- The Town of Cardston Airbnb market composition is heavily skewed towards Entire Home/Apt listings, which make up 100% of the 17 active rentals. This indicates strong guest preference for privacy and space.
- Looking at the property type distribution in Town of Cardston, House properties are the most common (64.7%), reflecting the local real estate landscape.
- Houses represent a significant 64.7% portion, catering likely to families or larger groups.
- The presence of 5.9% Hotel/Boutique listings indicates integration with traditional hospitality.
Town of Cardston Airbnb Room Capacity Analysis (2025): Bedroom Distribution
Distribution of Listings by Number of Bedrooms
Room Capacity Insights for Town of Cardston
- The dominant room capacity in Town of Cardston is 3 bedrooms listings, making up 29.4% of the market. This suggests a strong demand for properties suitable for families or small groups.
- Together, 3 bedrooms and 5+ bedrooms properties represent 52.9% of the active Airbnb listings in Town of Cardston, indicating a high concentration in these sizes.
- A significant 70.5% of listings offer 3+ bedrooms, catering to larger groups and families seeking more space in Town of Cardston.
Town of Cardston Vacation Rental Guest Capacity Trends (2025)
Distribution of Listings by Guest Capacity
Guest Capacity Insights for Town of Cardston
- The most common guest capacity trend in Town of Cardston vacation rentals is listings accommodating 8+ guests (52.9%). This suggests the primary traveler segment is likely larger groups.
- Properties designed for 8+ guests and 6 guests dominate the Town of Cardston STR market, accounting for 88.2% of listings.
- 94.1% of properties accommodate 6+ guests, serving the market segment for larger families or group travel in Town of Cardston.
- On average, properties in Town of Cardston are equipped to host 7.0 guests.
Town of Cardston Airbnb Booking Patterns (2025): Available vs. Booked Days
Available Days Distribution
Booked Days Distribution
Booking Pattern Insights for Town of Cardston
- The most common availability pattern in Town of Cardston falls within the 181-270 days range, representing 52.9% of listings. This suggests many properties have significant open periods on their calendars.
- Approximately 70.5% of listings show high availability (181+ days open annually), indicating potential for increased bookings or specific owner usage patterns.
- For booked days, the 91-180 days range is most frequent in Town of Cardston (52.9%), reflecting common guest stay durations or potential owner blocking patterns.
- A notable 29.4% of properties secure long booking periods (181+ days booked per year), highlighting successful long-term rental strategies or significant owner usage.
Town of Cardston Airbnb Minimum Stay Requirements Analysis
Distribution of Listings by Minimum Night Requirement
1 Night
6 listings
35.3% of total
2 Nights
10 listings
58.8% of total
3 Nights
1 listings
5.9% of total
Key Insights
- The most prevalent minimum stay requirement in Town of Cardston is 2 Nights, adopted by 58.8% of listings. This highlights the market's preference for shorter, flexible bookings.
- A strong majority (94.1%) of the Town of Cardston Airbnb data shows acceptance of very short stays (1-2 nights), indicating a dynamic, high-turnover market.
Recommendations
- Align with the market by considering a 2 Nights minimum stay, as 58.8% of Town of Cardston hosts use this setting.
- Adjust minimum nights based on seasonality – potentially shorter during low season and longer during peak demand periods in Town of Cardston.
Town of Cardston Airbnb Cancellation Policy Trends Analysis (2025)
Flexible
6 listings
35.3% of total
Moderate
4 listings
23.5% of total
Firm
7 listings
41.2% of total
Cancellation Policy Insights for Town of Cardston
- The prevailing Airbnb cancellation policy trend in Town of Cardston is Firm, used by 41.2% of listings.
- There's a relatively balanced mix between guest-friendly (58.8%) and stricter (41.2%) policies, offering choices for different guest needs.
Recommendations for Hosts
- Consider adopting a Firm policy to align with the 41.2% market standard in Town of Cardston.
- Regularly review your cancellation policy against competitors and market demand shifts in Town of Cardston.
Town of Cardston STR Booking Lead Time Analysis (2025)
Average Booking Lead Time by Month
Booking Lead Time Insights for Town of Cardston
- The overall average booking lead time for vacation rentals in Town of Cardston is 47 days.
- Guests book furthest in advance for stays during July (average 107 days), likely coinciding with peak travel demand or local events.
- The shortest booking windows occur for stays in January (average 17 days), indicating more last-minute travel plans during this time.
- Seasonally, Summer (80 days avg.) sees the longest lead times, while Winter (29 days avg.) has the shortest, reflecting typical travel planning cycles.
Recommendations for Hosts
- Use the overall average lead time (47 days) as a baseline for your pricing and availability strategy in Town of Cardston.
- For July stays, consider implementing length-of-stay discounts or slightly higher rates for bookings made less than 107 days out to capitalize on advance planning.
- Target marketing efforts for the Summer season well in advance (at least 80 days) to capture early planners.
- Monitor your own booking lead times against these Town of Cardston averages to identify opportunities for dynamic pricing adjustments.
Popular & Essential Airbnb Amenities in Town of Cardston (2025)
Amenity Prevalence
Amenity Insights for Town of Cardston
- Essential amenities in Town of Cardston that guests expect include: Private entrance, Refrigerator, Wifi, Bed linens, TV, Microwave. Lacking these (any) could significantly impact bookings.
- Popular amenities like Coffee maker, Dishes and silverware, Smoke alarm are common but not universal. Offering these can provide a competitive edge.
Recommendations for Hosts
- Ensure your listing includes all essential amenities for Town of Cardston: Private entrance, Refrigerator, Wifi, Bed linens, TV, Microwave.
- Consider adding popular differentiators like Coffee maker or Dishes and silverware to increase appeal.
- Highlight unique or less common amenities you offer (e.g., hot tub, dedicated workspace, EV charger) in your listing description and photos.
- Regularly check competitor amenities in Town of Cardston to stay competitive.
Town of Cardston Airbnb Guest Demographics & Profile Analysis (2025)
Guest Profile Summary for Town of Cardston
- The typical guest profile for Airbnb in Town of Cardston consists of a mix of domestic (47%) and international guests, with top international origins including United States, typically belonging to the Post-2000s (Gen Z/Alpha) group (50%), primarily speaking English or Hindi.
- Domestic travelers account for 47.4% of guests.
- Key international markets include Canada (47.4%) and United States (46.5%).
- Top languages spoken are English (63.1%) followed by Hindi (5.6%).
- A significant demographic segment is the Post-2000s (Gen Z/Alpha) group, representing 50% of guests.
Recommendations for Hosts
- Balance marketing efforts between domestic and international channels based on the guest mix.
- Tailor amenities and listing descriptions to appeal to the dominant Post-2000s (Gen Z/Alpha) demographic (e.g., highlight fast WiFi, smart home features, local guides).
- Highlight unique local experiences or amenities relevant to the primary guest profile.
- Consider seasonal promotions aligned with peak travel times for key origin markets.
Nearby Short-Term Rental Market Comparison
How does the Town of Cardston Airbnb market stack up against its neighbors? Compare key performance metrics like average monthly revenue, ADR, and occupancy rates in surrounding areas to understand the broader regional STR landscape.
| Market | Active Properties | Monthly Revenue | Daily Rate | Avg. Occupancy |
|---|---|---|---|---|
| West Glacier | 75 | $4,444 | $391.91 | 57% |
| Whitefish | 958 | $3,651 | $397.84 | 42% |
| Glacier County | 12 | $3,518 | $298.24 | 65% |
| Babb | 56 | $3,336 | $268.84 | 65% |
| Foothills County | 10 | $3,078 | $214.25 | 47% |
| Bragg Creek | 49 | $3,030 | $196.73 | 58% |
| Somers | 71 | $2,961 | $349.64 | 46% |
| Martin City | 45 | $2,922 | $233.28 | 57% |
| Columbia Falls | 501 | $2,795 | $273.43 | 52% |
| Kalispell | 506 | $2,792 | $256.27 | 51% |