Rosebud Airbnb Market Analysis 2025: Short Term Rental Data & Vacation Rental Statistics in Alberta, Canada
Is Airbnb profitable in Rosebud in 2025? Explore comprehensive Airbnb analytics for Rosebud, Alberta, Canada to uncover income potential. This 2025 STR market report for Rosebud, based on AirROI data from April 2024 to March 2025, reveals key trends in the niche market of 17 active listings.
Whether you're considering an Airbnb investment in Rosebud, optimizing your existing vacation rental, or exploring rental arbitrage opportunities, understanding the Rosebud Airbnb data is crucial. Leveraging the low regulation environment is key to maximizing your short term rental income potential. Let's dive into the specifics.
Key Rosebud Airbnb Performance Metrics Overview
Monthly Airbnb Revenue Variations & Income Potential in Rosebud (2025)
Understanding the monthly revenue variations for Airbnb listings in Rosebud is key to maximizing your short term rental income potential. Seasonality significantly impacts earnings. Our analysis, based on data from the past 12 months, shows that the peak revenue month for STRs in Rosebud is typically August, while March often presents the lowest earnings, highlighting opportunities for strategic pricing adjustments during shoulder and low seasons. Explore the typical Airbnb income in Rosebud across different performance tiers:
- Best-in-class properties (Top 10%) achieve $4,442+ monthly, often utilizing dynamic pricing and superior guest experiences.
- Strong performing properties (Top 25%) earn $2,654 or more, indicating effective management and desirable locations/amenities.
- Typical properties (Median) generate around $1,218 per month, representing the average market performance.
- Entry-level properties (Bottom 25%) see earnings around $717, often with potential for optimization.
Average Monthly Airbnb Earnings Trend in Rosebud
Rosebud Airbnb Occupancy Rate Trends (2025)
Maximize your bookings by understanding the Rosebud STR occupancy trends. Seasonal demand shifts significantly influence how often properties are booked. Typically, Septembersees the highest demand (peak season occupancy), while March experiences the lowest (low season). Effective strategies, like adjusting minimum stays or offering promotions, can boost occupancy during slower periods. Here's how different property tiers perform in Rosebud:
- Best-in-class properties (Top 10%) achieve 69%+ occupancy, indicating high desirability and potentially optimized availability.
- Strong performing properties (Top 25%) maintain 55% or higher occupancy, suggesting good market fit and guest satisfaction.
- Typical properties (Median) have an occupancy rate around 36%.
- Entry-level properties (Bottom 25%) average 19% occupancy, potentially facing higher vacancy.
Average Monthly Occupancy Rate Trend in Rosebud
Average Daily Rate (ADR) Airbnb Trends in Rosebud (2025)
Effective short term rental pricing strategy in Rosebud involves understanding monthly ADR fluctuations. The Average Daily Rate (ADR) for Airbnb in Rosebud typically peaks in September and dips lowest during March. Leveraging Airbnb dynamic pricing tools or strategies based on this seasonality can significantly boost revenue. Here's a look at the typical nightly rates achieved:
- Best-in-class properties (Top 10%) command rates of $250+ per night, often due to premium features or locations.
- Strong performing properties (Top 25%) achieve nightly rates of $186 or more.
- Typical properties (Median) charge around $134 per night.
- Entry-level properties (Bottom 25%) earn around $85 per night.
Average Daily Rate (ADR) Trend by Month in Rosebud
Get Live Rosebud Market Intelligence 👇

Explore Real-time Analytics
Airbnb Seasonality Analysis & Trends in Rosebud (2025)
Peak Season (August, June, July)
- Revenue averages $2,665 per month
- Occupancy rates average 48.5%
- Daily rates average $154
Shoulder Season
- Revenue averages $2,056 per month
- Occupancy maintains around 40.5%
- Daily rates hold near $141
Low Season (January, February, March)
- Revenue drops to average $1,015 per month
- Occupancy decreases to average 23.3%
- Daily rates adjust to average $123
Seasonality Insights for Rosebud
- The Airbnb seasonality in Rosebud shows highly seasonal trends requiring careful strategy. While the sections above show seasonal averages, it's also insightful to look at the extremes:
- During the high season, the absolute peak month showcases Rosebud's highest earning potential, with monthly revenues capable of climbing to $2,719, occupancy reaching a high of 57.2%, and ADRs peaking at $156.
- Conversely, the slowest single month of the year, typically falling within the low season, marks the market's lowest point. In this month, revenue might dip to $906, occupancy could drop to 18.4%, and ADRs may adjust down to $122.
- Understanding both the seasonal averages and these monthly peaks and troughs in revenue, occupancy, and ADR is crucial for maximizing your Airbnb profit potential in Rosebud.
Seasonal Strategies for Maximizing Profit
- Peak Season: Maximize revenue through premium pricing and potentially longer minimum stays. Ensure high availability.
- Low Season: Offer competitive pricing, special promotions (e.g., extended stay discounts), and flexible cancellation policies. Target off-season travelers like remote workers or budget-conscious guests.
- Shoulder Seasons: Implement dynamic pricing that balances peak and low rates. Target weekend travelers or specific events. Offer slightly more flexible terms than peak season.
- Regularly analyze your own performance against these Rosebud seasonality benchmarks and adjust your pricing and availability strategy accordingly.
Best Areas for Airbnb Investment in Rosebud (2025)
Exploring the top neighborhoods for short-term rentals in Rosebud? This section highlights key areas, outlining why they are attractive for hosts and guests, along with notable local attractions. Consider these locations based on your target guest profile and investment strategy.
| Neighborhood / Area | Why Host Here? (Target Guests & Appeal) | Key Attractions & Landmarks |
|---|---|---|
| Rosebud Village | Charming small town atmosphere with a strong sense of community and culture. Ideal for guests looking to escape urban life and experience local arts and crafts. | Rosebud Theatre, Artisans of Rosebud, Walking trails, Local cafes, Seasonal festivals |
| Scenic River Valley | Stunning natural landscapes along the river, perfect for outdoor enthusiasts. A great draw for visitors looking to hike, fish, or simply enjoy nature. | Red Deer River, Hiking and biking trails, Fishing spots, Picnic areas, Wildlife viewing |
| Cultural Heritage Area | Rich in history and culture, appealing to those interested in learning about Alberta's heritage. Hosts various cultural events throughout the year. | Historic sites, Cultural museums, Local artisan shops, Festivals celebrating local culture |
| Golf Course Area | Home to beautiful golf courses attracting golfing enthusiasts during the summer months. Appeals to families and groups looking for recreational activities. | Rosebud Country Club, Beautiful landscapes, Family-friendly amenities, Golf tournaments, Dining options |
| Local Artisan Market | A hub for local arts and crafts, drawing visitors who appreciate handmade goods and unique finds. Great for guests looking to take home a piece of local craftsmanship. | Artisan shops, Farmers market, Craft workshops, Live music during events, Food trucks |
| Wildlife Observation Zone | Safe and ideal spot for wildlife watching, particularly for families and nature lovers. Guests seeking to connect with nature will find this area appealing. | Wildlife viewing areas, Guided tours, Birdwatching spots, Photography opportunities |
| Equestrian Adventures | Perfect for guests interested in horseback riding and country experiences. Provides unique opportunities for those looking to explore the area on horseback. | Horse riding trails, Ranch experiences, Events at local stables, Horseback riding tours |
| Winter Sports Hub | Perfect for winter sports enthusiasts with opportunities for skiing and snowboarding in nearby locations. Attracts adventurers during the winter season. | Skiing locations nearby, Snowshoeing trails, Cross-country skiing, Winter festivals |
Understanding Airbnb License Requirements & STR Laws in Rosebud (2025)
While Rosebud, Alberta, Canada currently shows low STR regulations, specific Airbnb license requirements might still exist or change. Always verify the latest short term rental regulations and Airbnb license requirements directly with local government authorities for Rosebud to ensure full compliance before hosting.
(Source: AirROI data, 2025, finding no licensed listings among those analyzed)
Top Performing Airbnb Properties in Rosebud (2025)
Benchmark your potential! Explore examples of top-performing Airbnb properties in Rosebudbased on Trailing Twelve Month (TTM) revenue. Analyze their characteristics, revenue, occupancy rate, and ADR to understand what drives success in this market.
Entire Windmill
Entire Place • 2 bedrooms
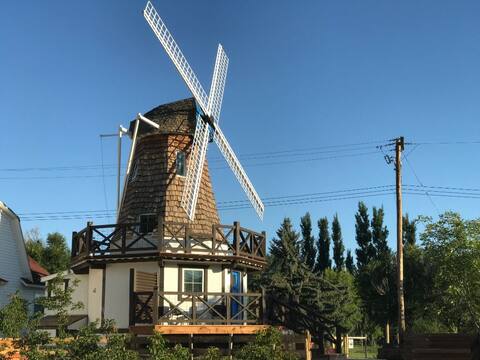
The Windmill
Entire Place • 1 bedroom
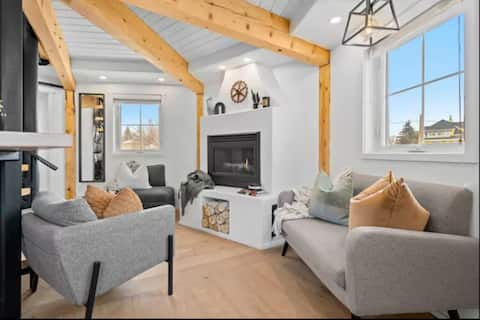
The Farmhouse
Entire Place • 2 bedrooms

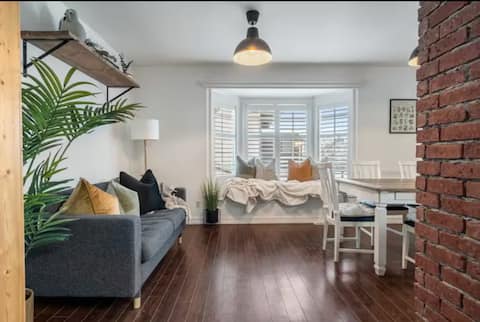
Riverside Rest
Entire Place • 2 bedrooms

The Firehall
Entire Place • 1 bedroom
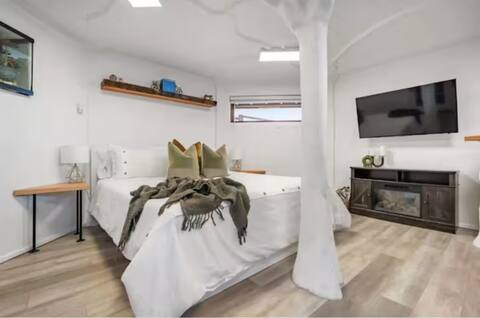
Windmill Studio
Entire Place • 1 bedroom
Note: Performance varies based on location, size, amenities, seasonality, and management quality. Data reflects the past 12 months.
Top Performing Airbnb Hosts in Rosebud (2025)
Learn from the best! This table showcases top-performing Airbnb hosts in Rosebud based on the number of properties managed and estimated total revenue over the past year. Analyze their scale and performance metrics.
| Host Name | Properties | Grossing Revenue | Stay Reviews | Avg Rating |
|---|---|---|---|---|
| Travis | 5 | $172,227 | 799 | 4.79/5.0 |
| Carol | 3 | $51,154 | 358 | 4.94/5.0 |
| Valerie | 5 | $34,096 | 85 | 4.71/5.0 |
| Cheryl | 1 | $12,689 | 209 | 4.98/5.0 |
| Renita | 1 | $8,073 | 129 | 4.89/5.0 |
| Randall | 1 | $778 | 154 | 4.97/5.0 |
| Host #351506498 | 1 | $505 | 11 | 4.73/5.0 |
Analyzing the strategies of top hosts, such as their property selection, pricing, and guest communication, can offer valuable lessons for optimizing your own Airbnb operations in Rosebud.
Dive Deeper: Advanced Rosebud STR Market Data (2025)
Ready to unlock more insights? AirROI provides access to advanced metrics and comprehensive Airbnb data for Rosebud. Explore detailed analytics beyond this report to refine your investment strategy, optimize pricing, and maximize your vacation rental profits.
Explore Advanced MetricsRosebud Short-Term Rental Market Composition (2025): Property & Room Types
Room Type Distribution
Property Type Distribution
Market Composition Insights for Rosebud
- The Rosebud Airbnb market composition is heavily skewed towards Entire Home/Apt listings, which make up 64.7% of the 17 active rentals. This indicates strong guest preference for privacy and space.
- However, a notable 35.3% share for Private Rooms suggests opportunities for budget-conscious travelers or hosts renting out spare rooms.
- Looking at the property type distribution in Rosebud, Others properties are the most common (58.8%), reflecting the local real estate landscape.
- Houses represent a significant 17.6% portion, catering likely to families or larger groups.
- The presence of 5.9% Hotel/Boutique listings indicates integration with traditional hospitality.
Rosebud Airbnb Room Capacity Analysis (2025): Bedroom Distribution
Distribution of Listings by Number of Bedrooms
Room Capacity Insights for Rosebud
- The dominant room capacity in Rosebud is 2 bedrooms listings, making up 35.3% of the market. This suggests a strong demand for properties suitable for couples or solo travelers.
- Together, 2 bedrooms and 1 bedroom properties represent 64.7% of the active Airbnb listings in Rosebud, indicating a high concentration in these sizes.
- Listings with 3+ bedrooms (5.9%) represent a smaller niche, potentially indicating an underserved market for larger group accommodations in Rosebud.
Rosebud Vacation Rental Guest Capacity Trends (2025)
Distribution of Listings by Guest Capacity
Guest Capacity Insights for Rosebud
- The most common guest capacity trend in Rosebud vacation rentals is listings accommodating 6 guests (17.6%). This suggests the primary traveler segment is likely larger groups.
- Properties designed for 6 guests and 4 guests dominate the Rosebud STR market, accounting for 35.2% of listings.
- 23.5% of properties accommodate 6+ guests, serving the market segment for larger families or group travel in Rosebud.
- On average, properties in Rosebud are equipped to host 3.1 guests.
Rosebud Airbnb Booking Patterns (2025): Available vs. Booked Days
Available Days Distribution
Booked Days Distribution
Booking Pattern Insights for Rosebud
- The most common availability pattern in Rosebud falls within the 271-366 days range, representing 41.2% of listings. This suggests many properties have significant open periods on their calendars.
- Approximately 76.5% of listings show high availability (181+ days open annually), indicating potential for increased bookings or specific owner usage patterns.
- For booked days, the 91-180 days range is most frequent in Rosebud (41.2%), reflecting common guest stay durations or potential owner blocking patterns.
- A notable 23.5% of properties secure long booking periods (181+ days booked per year), highlighting successful long-term rental strategies or significant owner usage.
Rosebud Airbnb Minimum Stay Requirements Analysis
Distribution of Listings by Minimum Night Requirement
1 Night
12 listings
75% of total
2 Nights
4 listings
25% of total
Key Insights
- The most prevalent minimum stay requirement in Rosebud is 1 Night, adopted by 75% of listings. This highlights the market's preference for shorter, flexible bookings.
- A strong majority (100.0%) of the Rosebud Airbnb data shows acceptance of very short stays (1-2 nights), indicating a dynamic, high-turnover market.
Recommendations
- Align with the market by considering a 1 Night minimum stay, as 75% of Rosebud hosts use this setting.
- Adjust minimum nights based on seasonality – potentially shorter during low season and longer during peak demand periods in Rosebud.
Rosebud Airbnb Cancellation Policy Trends Analysis (2025)
Flexible
2 listings
11.8% of total
Moderate
10 listings
58.8% of total
Strict
5 listings
29.4% of total
Cancellation Policy Insights for Rosebud
- The prevailing Airbnb cancellation policy trend in Rosebud is Moderate, used by 58.8% of listings.
- The market strongly favors guest-friendly terms, with 70.6% of listings offering Flexible or Moderate policies. This suggests guests in Rosebud may expect booking flexibility.
Recommendations for Hosts
- Consider adopting a Moderate policy to align with the 58.8% market standard in Rosebud.
- Regularly review your cancellation policy against competitors and market demand shifts in Rosebud.
Rosebud STR Booking Lead Time Analysis (2025)
Average Booking Lead Time by Month
Booking Lead Time Insights for Rosebud
- The overall average booking lead time for vacation rentals in Rosebud is 54 days.
- Guests book furthest in advance for stays during October (average 95 days), likely coinciding with peak travel demand or local events.
- The shortest booking windows occur for stays in February (average 12 days), indicating more last-minute travel plans during this time.
- Seasonally, Spring (66 days avg.) sees the longest lead times, while Winter (32 days avg.) has the shortest, reflecting typical travel planning cycles.
Recommendations for Hosts
- Use the overall average lead time (54 days) as a baseline for your pricing and availability strategy in Rosebud.
- For October stays, consider implementing length-of-stay discounts or slightly higher rates for bookings made less than 95 days out to capitalize on advance planning.
- During February, focus on last-minute booking availability and promotions, as guests book with very short notice (12 days avg.).
- Target marketing efforts for the Spring season well in advance (at least 66 days) to capture early planners.
- Monitor your own booking lead times against these Rosebud averages to identify opportunities for dynamic pricing adjustments.
Popular & Essential Airbnb Amenities in Rosebud (2025)
Amenity Prevalence
Amenity Insights for Rosebud
- Essential amenities in Rosebud that guests expect include: Wifi, Smoke alarm. Lacking these (any) could significantly impact bookings.
- Popular amenities like Free parking on premises, Carbon monoxide alarm, Dishes and silverware are common but not universal. Offering these can provide a competitive edge.
Recommendations for Hosts
- Ensure your listing includes all essential amenities for Rosebud: Wifi, Smoke alarm.
- Consider adding popular differentiators like Free parking on premises or Carbon monoxide alarm to increase appeal.
- Highlight unique or less common amenities you offer (e.g., hot tub, dedicated workspace, EV charger) in your listing description and photos.
- Regularly check competitor amenities in Rosebud to stay competitive.
Rosebud Airbnb Guest Demographics & Profile Analysis (2025)
Guest Profile Summary for Rosebud
- The typical guest profile for Airbnb in Rosebud consists of primarily domestic travelers (89%), often arriving from nearby Edmonton, typically belonging to the Post-2000s (Gen Z/Alpha) group (50%), primarily speaking English or French.
- Domestic travelers account for 89.0% of guests.
- Key international markets include Canada (89%) and United States (4.9%).
- Top languages spoken are English (75.6%) followed by French (6.4%).
- A significant demographic segment is the Post-2000s (Gen Z/Alpha) group, representing 50% of guests.
Recommendations for Hosts
- Target domestic marketing efforts towards travelers from Edmonton and Calgary.
- Tailor amenities and listing descriptions to appeal to the dominant Post-2000s (Gen Z/Alpha) demographic (e.g., highlight fast WiFi, smart home features, local guides).
- Highlight unique local experiences or amenities relevant to the primary guest profile.
- Consider seasonal promotions aligned with peak travel times for key origin markets.
Nearby Short-Term Rental Market Comparison
How does the Rosebud Airbnb market stack up against its neighbors? Compare key performance metrics like average monthly revenue, ADR, and occupancy rates in surrounding areas to understand the broader regional STR landscape.
| Market | Active Properties | Monthly Revenue | Daily Rate | Avg. Occupancy |
|---|---|---|---|---|
| Chestermere | 45 | $2,013 | $195.70 | 43% |
| Drumheller | 101 | $1,593 | $153.89 | 43% |
| Red Deer County | 36 | $1,413 | $149.03 | 43% |
| De Winton | 11 | $1,248 | $174.95 | 42% |
| Red Deer | 161 | $1,107 | $99.51 | 48% |
| Stettler | 12 | $1,098 | $89.29 | 44% |
| Okotoks | 34 | $834 | $78.19 | 46% |