Rocky Mountain House Airbnb Market Analysis 2025: Short Term Rental Data & Vacation Rental Statistics in Alberta, Canada
Is Airbnb profitable in Rocky Mountain House in 2025? Explore comprehensive Airbnb analytics for Rocky Mountain House, Alberta, Canada to uncover income potential. This 2025 STR market report for Rocky Mountain House, based on AirROI data from April 2024 to March 2025, reveals key trends in the niche market of 23 active listings.
Whether you're considering an Airbnb investment in Rocky Mountain House, optimizing your existing vacation rental, or exploring rental arbitrage opportunities, understanding the Rocky Mountain House Airbnb data is crucial. Leveraging the low regulation environment is key to maximizing your short term rental income potential. Let's dive into the specifics.
Key Rocky Mountain House Airbnb Performance Metrics Overview
Monthly Airbnb Revenue Variations & Income Potential in Rocky Mountain House (2025)
Understanding the monthly revenue variations for Airbnb listings in Rocky Mountain House is key to maximizing your short term rental income potential. Seasonality significantly impacts earnings. Our analysis, based on data from the past 12 months, shows that the peak revenue month for STRs in Rocky Mountain House is typically August, while March often presents the lowest earnings, highlighting opportunities for strategic pricing adjustments during shoulder and low seasons. Explore the typical Airbnb income in Rocky Mountain House across different performance tiers:
- Best-in-class properties (Top 10%) achieve $2,966+ monthly, often utilizing dynamic pricing and superior guest experiences.
- Strong performing properties (Top 25%) earn $2,030 or more, indicating effective management and desirable locations/amenities.
- Typical properties (Median) generate around $1,302 per month, representing the average market performance.
- Entry-level properties (Bottom 25%) see earnings around $659, often with potential for optimization.
Average Monthly Airbnb Earnings Trend in Rocky Mountain House
Rocky Mountain House Airbnb Occupancy Rate Trends (2025)
Maximize your bookings by understanding the Rocky Mountain House STR occupancy trends. Seasonal demand shifts significantly influence how often properties are booked. Typically, Augustsees the highest demand (peak season occupancy), while March experiences the lowest (low season). Effective strategies, like adjusting minimum stays or offering promotions, can boost occupancy during slower periods. Here's how different property tiers perform in Rocky Mountain House:
- Best-in-class properties (Top 10%) achieve 82%+ occupancy, indicating high desirability and potentially optimized availability.
- Strong performing properties (Top 25%) maintain 63% or higher occupancy, suggesting good market fit and guest satisfaction.
- Typical properties (Median) have an occupancy rate around 44%.
- Entry-level properties (Bottom 25%) average 21% occupancy, potentially facing higher vacancy.
Average Monthly Occupancy Rate Trend in Rocky Mountain House
Average Daily Rate (ADR) Airbnb Trends in Rocky Mountain House (2025)
Effective short term rental pricing strategy in Rocky Mountain House involves understanding monthly ADR fluctuations. The Average Daily Rate (ADR) for Airbnb in Rocky Mountain House typically peaks in November and dips lowest during April. Leveraging Airbnb dynamic pricing tools or strategies based on this seasonality can significantly boost revenue. Here's a look at the typical nightly rates achieved:
- Best-in-class properties (Top 10%) command rates of $142+ per night, often due to premium features or locations.
- Strong performing properties (Top 25%) achieve nightly rates of $111 or more.
- Typical properties (Median) charge around $87 per night.
- Entry-level properties (Bottom 25%) earn around $70 per night.
Average Daily Rate (ADR) Trend by Month in Rocky Mountain House
Get Live Rocky Mountain House Market Intelligence 👇
Explore Real-time Analytics
Airbnb Seasonality Analysis & Trends in Rocky Mountain House (2025)
Peak Season (August, July, September)
- Revenue averages $2,139 per month
- Occupancy rates average 61.6%
- Daily rates average $95
Shoulder Season
- Revenue averages $1,373 per month
- Occupancy maintains around 41.3%
- Daily rates hold near $96
Low Season (January, March, December)
- Revenue drops to average $966 per month
- Occupancy decreases to average 36.6%
- Daily rates adjust to average $100
Seasonality Insights for Rocky Mountain House
- The Airbnb seasonality in Rocky Mountain House shows highly seasonal trends requiring careful strategy. While the sections above show seasonal averages, it's also insightful to look at the extremes:
- During the high season, the absolute peak month showcases Rocky Mountain House's highest earning potential, with monthly revenues capable of climbing to $2,222, occupancy reaching a high of 63.3%, and ADRs peaking at $107.
- Conversely, the slowest single month of the year, typically falling within the low season, marks the market's lowest point. In this month, revenue might dip to $889, occupancy could drop to 35.3%, and ADRs may adjust down to $92.
- Understanding both the seasonal averages and these monthly peaks and troughs in revenue, occupancy, and ADR is crucial for maximizing your Airbnb profit potential in Rocky Mountain House.
Seasonal Strategies for Maximizing Profit
- Peak Season: Maximize revenue through premium pricing and potentially longer minimum stays. Ensure high availability.
- Low Season: Offer competitive pricing, special promotions (e.g., extended stay discounts), and flexible cancellation policies. Target off-season travelers like remote workers or budget-conscious guests.
- Shoulder Seasons: Implement dynamic pricing that balances peak and low rates. Target weekend travelers or specific events. Offer slightly more flexible terms than peak season.
- Regularly analyze your own performance against these Rocky Mountain House seasonality benchmarks and adjust your pricing and availability strategy accordingly.
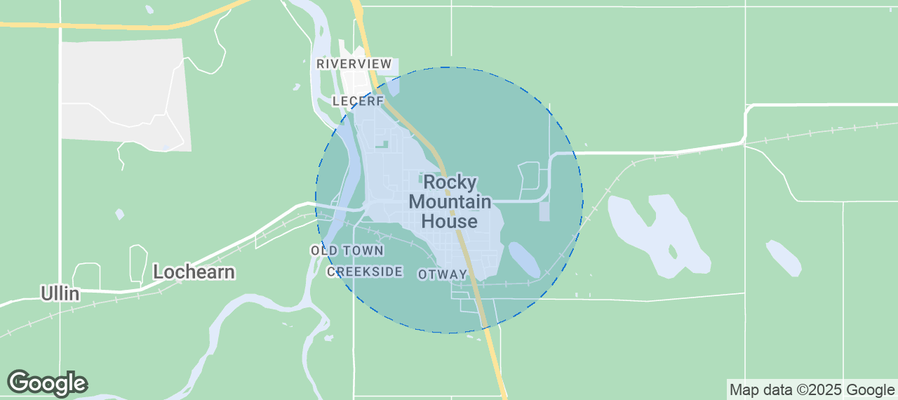
Best Areas for Airbnb Investment in Rocky Mountain House (2025)
Exploring the top neighborhoods for short-term rentals in Rocky Mountain House? This section highlights key areas, outlining why they are attractive for hosts and guests, along with notable local attractions. Consider these locations based on your target guest profile and investment strategy.
| Neighborhood / Area | Why Host Here? (Target Guests & Appeal) | Key Attractions & Landmarks |
|---|---|---|
| Downtown Rocky Mountain House | The heart of the town with access to local markets, restaurants, and shops. Ideal for visitors looking to explore the vibrant community and enjoy local events. | Rocky Mountain House Museum, Local Farmers' Market, Rocky Mountain House Park, Restaurants and Cafes, Shopping District |
| Pine Lake | A beautiful lake area popular for relaxation, water activities, and nature walks. Perfect for families and travelers seeking outdoor recreational opportunities. | Pine Lake Provincial Park, Beach and Water Sports, Camping Sites, Nature Trails, Fishing |
| Sundance Ski Area | Snowy retreat known for winter sports and outdoor activities. Attracts winter sports enthusiasts and nature lovers year-round. | Skiing and Snowboarding, Snowshoeing Trails, Cabin Rentals, Winter Festivals |
| Bighorn Backcountry | Stunning mountainous region great for hiking, camping, and adventure sports. Appeals to tourists seeking wilderness experiences and natural beauty. | Hiking Trails, Mountain Biking, Scenic Viewpoints, Campsites |
| David Thompson Highway | Scenic route offering breathtaking views and access to various outdoor activities. Popular among travelers exploring the Alberta Rockies and surrounding areas. | Scenic Drives, Lookout Points, Access to National Parks, Wildlife Viewing |
| Crescent Falls | Stunning falls located in the Rockies, ideal for visitors looking for picturesque views and photo opportunities. Great for day trips and outdoor exploration. | Crescent Falls Viewpoint, Hiking Trails, Wildlife Spotting, Camping |
| North Saskatchewan River | A beautiful river area offering opportunities for fishing, kayaking, and tranquil nature experiences. Attracts nature lovers and outdoor enthusiasts. | Fishing Spots, Kayaking, Picnic Areas, Scenic Walking Paths |
| Rocky Mountain House National Historic Site | A site of historical significance with rich cultural heritage. Great for educational tourism and history buffs. | Interpretive Center, Historical Buildings, Guided Tours, Pioneer Park |
Understanding Airbnb License Requirements & STR Laws in Rocky Mountain House (2025)
While Rocky Mountain House, Alberta, Canada currently shows low STR regulations, specific Airbnb license requirements might still exist or change. Always verify the latest short term rental regulations and Airbnb license requirements directly with local government authorities for Rocky Mountain House to ensure full compliance before hosting.
(Source: AirROI data, 2025, finding no licensed listings among those analyzed)
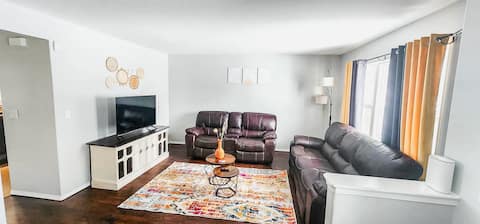
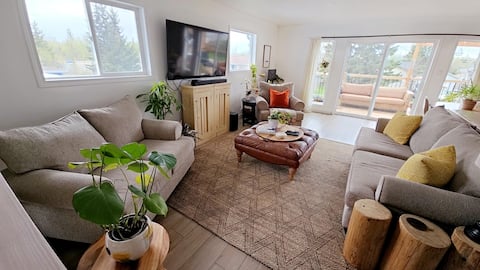
Top Performing Airbnb Properties in Rocky Mountain House (2025)
Benchmark your potential! Explore examples of top-performing Airbnb properties in Rocky Mountain Housebased on Trailing Twelve Month (TTM) revenue. Analyze their characteristics, revenue, occupancy rate, and ADR to understand what drives success in this market.

Unique country stay, horse and dog friendly.
Entire Place • N/A

-<* Discounted Executive Suite w/ Office Area *>-
Entire Place • 3 bedrooms
"Rocky Mountain House" Haven!
Entire Place • 3 bedrooms

Home Away From Home
Entire Place • 1 bedroom
4BR 2.5Bath Rocky Mountain Home
Entire Place • 4 bedrooms
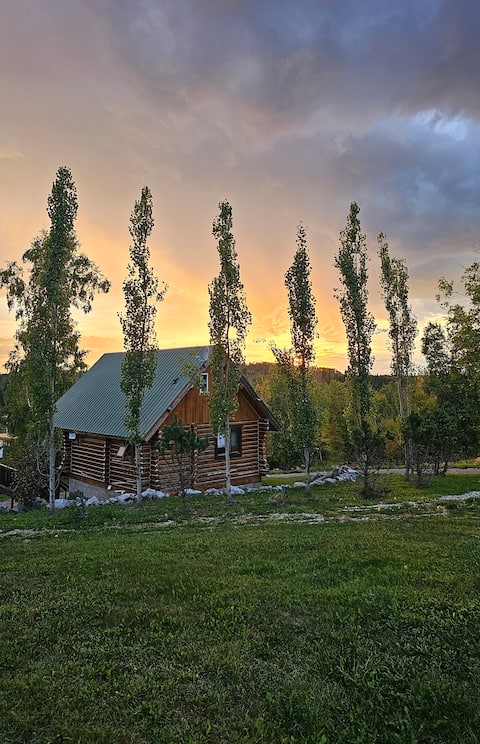
Chip's Cabin
Entire Place • 1 bedroom
Note: Performance varies based on location, size, amenities, seasonality, and management quality. Data reflects the past 12 months.
Top Performing Airbnb Hosts in Rocky Mountain House (2025)
Learn from the best! This table showcases top-performing Airbnb hosts in Rocky Mountain House based on the number of properties managed and estimated total revenue over the past year. Analyze their scale and performance metrics.
| Host Name | Properties | Grossing Revenue | Stay Reviews | Avg Rating |
|---|---|---|---|---|
| Scott | 3 | $38,982 | 116 | 4.91/5.0 |
| Andrea | 1 | $28,577 | 148 | 4.99/5.0 |
| Ken | 1 | $28,492 | 48 | 4.90/5.0 |
| Tasha | 1 | $28,052 | 12 | 4.92/5.0 |
| Kathy And Marty | 2 | $25,746 | 78 | 4.99/5.0 |
| Dawn | 1 | $24,046 | 24 | 5.00/5.0 |
| Alyssa | 2 | $23,079 | 91 | 4.91/5.0 |
| Host #111287801 | 1 | $21,702 | 3 | 5.00/5.0 |
| Nathalie Marie | 1 | $16,100 | 13 | 4.77/5.0 |
| Gerry | 1 | $14,032 | 56 | 4.95/5.0 |
Analyzing the strategies of top hosts, such as their property selection, pricing, and guest communication, can offer valuable lessons for optimizing your own Airbnb operations in Rocky Mountain House.
Dive Deeper: Advanced Rocky Mountain House STR Market Data (2025)
Ready to unlock more insights? AirROI provides access to advanced metrics and comprehensive Airbnb data for Rocky Mountain House. Explore detailed analytics beyond this report to refine your investment strategy, optimize pricing, and maximize your vacation rental profits.
Explore Advanced MetricsRocky Mountain House Short-Term Rental Market Composition (2025): Property & Room Types
Room Type Distribution
Property Type Distribution
Market Composition Insights for Rocky Mountain House
- The Rocky Mountain House Airbnb market composition is heavily skewed towards Entire Home/Apt listings, which make up 82.6% of the 23 active rentals. This indicates strong guest preference for privacy and space.
- Looking at the property type distribution in Rocky Mountain House, Outdoor/Unique properties are the most common (39.1%), reflecting the local real estate landscape.
- Houses represent a significant 34.8% portion, catering likely to families or larger groups.
- Smaller segments like hotel/boutique, apartment/condo (combined 8.6%) offer potential for unique stay experiences.
Rocky Mountain House Airbnb Room Capacity Analysis (2025): Bedroom Distribution
Distribution of Listings by Number of Bedrooms
Room Capacity Insights for Rocky Mountain House
- The dominant room capacity in Rocky Mountain House is 1 bedroom listings, making up 43.5% of the market. This suggests a strong demand for properties suitable for couples or solo travelers.
- Together, 1 bedroom and 3 bedrooms properties represent 56.5% of the active Airbnb listings in Rocky Mountain House, indicating a high concentration in these sizes.
Rocky Mountain House Vacation Rental Guest Capacity Trends (2025)
Distribution of Listings by Guest Capacity
Guest Capacity Insights for Rocky Mountain House
- The most common guest capacity trend in Rocky Mountain House vacation rentals is listings accommodating 2 guests (34.8%). This suggests the primary traveler segment is likely couples or solo travelers.
- Properties designed for 2 guests and 6 guests dominate the Rocky Mountain House STR market, accounting for 52.2% of listings.
- 21.7% of properties accommodate 6+ guests, serving the market segment for larger families or group travel in Rocky Mountain House.
- On average, properties in Rocky Mountain House are equipped to host 3.2 guests.
Rocky Mountain House Airbnb Booking Patterns (2025): Available vs. Booked Days
Available Days Distribution
Booked Days Distribution
Booking Pattern Insights for Rocky Mountain House
- The most common availability pattern in Rocky Mountain House falls within the 181-270 days range, representing 47.8% of listings. This suggests many properties have significant open periods on their calendars.
- Approximately 73.9% of listings show high availability (181+ days open annually), indicating potential for increased bookings or specific owner usage patterns.
- For booked days, the 91-180 days range is most frequent in Rocky Mountain House (52.2%), reflecting common guest stay durations or potential owner blocking patterns.
- A notable 26.0% of properties secure long booking periods (181+ days booked per year), highlighting successful long-term rental strategies or significant owner usage.
Rocky Mountain House Airbnb Minimum Stay Requirements Analysis
Distribution of Listings by Minimum Night Requirement
1 Night
12 listings
57.1% of total
2 Nights
7 listings
33.3% of total
30+ Nights
2 listings
9.5% of total
Key Insights
- The most prevalent minimum stay requirement in Rocky Mountain House is 1 Night, adopted by 57.1% of listings. This highlights the market's preference for shorter, flexible bookings.
- A strong majority (90.4%) of the Rocky Mountain House Airbnb data shows acceptance of very short stays (1-2 nights), indicating a dynamic, high-turnover market.
Recommendations
- Align with the market by considering a 1 Night minimum stay, as 57.1% of Rocky Mountain House hosts use this setting.
- Explore offering discounts for stays of 30+ nights to attract the 9.5% of the market seeking extended stays.
- Adjust minimum nights based on seasonality – potentially shorter during low season and longer during peak demand periods in Rocky Mountain House.
Rocky Mountain House Airbnb Cancellation Policy Trends Analysis (2025)
Flexible
8 listings
38.1% of total
Moderate
5 listings
23.8% of total
Firm
2 listings
9.5% of total
Strict
6 listings
28.6% of total
Cancellation Policy Insights for Rocky Mountain House
- The prevailing Airbnb cancellation policy trend in Rocky Mountain House is Flexible, used by 38.1% of listings.
- There's a relatively balanced mix between guest-friendly (61.9%) and stricter (38.1%) policies, offering choices for different guest needs.
Recommendations for Hosts
- Consider adopting a Flexible policy to align with the 38.1% market standard in Rocky Mountain House.
- Regularly review your cancellation policy against competitors and market demand shifts in Rocky Mountain House.
Rocky Mountain House STR Booking Lead Time Analysis (2025)
Average Booking Lead Time by Month
Booking Lead Time Insights for Rocky Mountain House
- The overall average booking lead time for vacation rentals in Rocky Mountain House is 41 days.
- Guests book furthest in advance for stays during December (average 68 days), likely coinciding with peak travel demand or local events.
- The shortest booking windows occur for stays in February (average 10 days), indicating more last-minute travel plans during this time.
- Seasonally, Summer (56 days avg.) sees the longest lead times, while Spring (41 days avg.) has the shortest, reflecting typical travel planning cycles.
Recommendations for Hosts
- Use the overall average lead time (41 days) as a baseline for your pricing and availability strategy in Rocky Mountain House.
- For December stays, consider implementing length-of-stay discounts or slightly higher rates for bookings made less than 68 days out to capitalize on advance planning.
- During February, focus on last-minute booking availability and promotions, as guests book with very short notice (10 days avg.).
- Target marketing efforts for the Summer season well in advance (at least 56 days) to capture early planners.
- Monitor your own booking lead times against these Rocky Mountain House averages to identify opportunities for dynamic pricing adjustments.
Popular & Essential Airbnb Amenities in Rocky Mountain House (2025)
Amenity Prevalence
Amenity Insights for Rocky Mountain House
- Popular amenities like Free parking on premises, Smoke alarm, Heating are common but not universal. Offering these can provide a competitive edge.
Recommendations for Hosts
- Consider adding popular differentiators like Free parking on premises or Smoke alarm to increase appeal.
- Highlight unique or less common amenities you offer (e.g., hot tub, dedicated workspace, EV charger) in your listing description and photos.
- Regularly check competitor amenities in Rocky Mountain House to stay competitive.
Rocky Mountain House Airbnb Guest Demographics & Profile Analysis (2025)
Guest Profile Summary for Rocky Mountain House
- The typical guest profile for Airbnb in Rocky Mountain House consists of primarily domestic travelers (88%), often arriving from nearby Edmonton, typically belonging to the Post-2000s (Gen Z/Alpha) group (50%), primarily speaking English or French.
- Domestic travelers account for 87.6% of guests.
- Key international markets include Canada (87.6%) and United States (4.7%).
- Top languages spoken are English (65.1%) followed by French (11%).
- A significant demographic segment is the Post-2000s (Gen Z/Alpha) group, representing 50% of guests.
Recommendations for Hosts
- Target domestic marketing efforts towards travelers from Edmonton and Calgary.
- Tailor amenities and listing descriptions to appeal to the dominant Post-2000s (Gen Z/Alpha) demographic (e.g., highlight fast WiFi, smart home features, local guides).
- Highlight unique local experiences or amenities relevant to the primary guest profile.
- Consider seasonal promotions aligned with peak travel times for key origin markets.
Nearby Short-Term Rental Market Comparison
How does the Rocky Mountain House Airbnb market stack up against its neighbors? Compare key performance metrics like average monthly revenue, ADR, and occupancy rates in surrounding areas to understand the broader regional STR landscape.
| Market | Active Properties | Monthly Revenue | Daily Rate | Avg. Occupancy |
|---|---|---|---|---|
| Banff | 141 | $5,227 | $401.85 | 48% |
| Canmore | 1,639 | $5,212 | $282.42 | 60% |
| Harvie Heights | 151 | $4,469 | $232.40 | 64% |
| Dead Man's Flats | 126 | $4,035 | $286.14 | 55% |
| Rocky View County | 20 | $2,377 | $238.71 | 40% |
| Sundre | 12 | $2,271 | $175.05 | 38% |
| Town of Sylvan Lake | 143 | $2,210 | $190.48 | 52% |
| Chestermere | 45 | $2,013 | $195.70 | 43% |
| Town of Cochrane | 110 | $1,986 | $148.59 | 52% |
| Sherwood Park | 50 | $1,741 | $147.66 | 49% |