Pincher Creek Airbnb Market Analysis 2025: Short Term Rental Data & Vacation Rental Statistics in Alberta, Canada
Is Airbnb profitable in Pincher Creek in 2025? Explore comprehensive Airbnb analytics for Pincher Creek, Alberta, Canada to uncover income potential. This 2025 STR market report for Pincher Creek, based on AirROI data from April 2024 to March 2025, reveals key trends in the niche market of 35 active listings.
Whether you're considering an Airbnb investment in Pincher Creek, optimizing your existing vacation rental, or exploring rental arbitrage opportunities, understanding the Pincher Creek Airbnb data is crucial. Leveraging the low regulation environment is key to maximizing your short term rental income potential. Let's dive into the specifics.
Key Pincher Creek Airbnb Performance Metrics Overview
Monthly Airbnb Revenue Variations & Income Potential in Pincher Creek (2025)
Understanding the monthly revenue variations for Airbnb listings in Pincher Creek is key to maximizing your short term rental income potential. Seasonality significantly impacts earnings. Our analysis, based on data from the past 12 months, shows that the peak revenue month for STRs in Pincher Creek is typically August, while January often presents the lowest earnings, highlighting opportunities for strategic pricing adjustments during shoulder and low seasons. Explore the typical Airbnb income in Pincher Creek across different performance tiers:
- Best-in-class properties (Top 10%) achieve $4,641+ monthly, often utilizing dynamic pricing and superior guest experiences.
- Strong performing properties (Top 25%) earn $3,123 or more, indicating effective management and desirable locations/amenities.
- Typical properties (Median) generate around $1,958 per month, representing the average market performance.
- Entry-level properties (Bottom 25%) see earnings around $1,283, often with potential for optimization.
Average Monthly Airbnb Earnings Trend in Pincher Creek
Pincher Creek Airbnb Occupancy Rate Trends (2025)
Maximize your bookings by understanding the Pincher Creek STR occupancy trends. Seasonal demand shifts significantly influence how often properties are booked. Typically, Augustsees the highest demand (peak season occupancy), while January experiences the lowest (low season). Effective strategies, like adjusting minimum stays or offering promotions, can boost occupancy during slower periods. Here's how different property tiers perform in Pincher Creek:
- Best-in-class properties (Top 10%) achieve 82%+ occupancy, indicating high desirability and potentially optimized availability.
- Strong performing properties (Top 25%) maintain 70% or higher occupancy, suggesting good market fit and guest satisfaction.
- Typical properties (Median) have an occupancy rate around 50%.
- Entry-level properties (Bottom 25%) average 28% occupancy, potentially facing higher vacancy.
Average Monthly Occupancy Rate Trend in Pincher Creek
Average Daily Rate (ADR) Airbnb Trends in Pincher Creek (2025)
Effective short term rental pricing strategy in Pincher Creek involves understanding monthly ADR fluctuations. The Average Daily Rate (ADR) for Airbnb in Pincher Creek typically peaks in July and dips lowest during March. Leveraging Airbnb dynamic pricing tools or strategies based on this seasonality can significantly boost revenue. Here's a look at the typical nightly rates achieved:
- Best-in-class properties (Top 10%) command rates of $288+ per night, often due to premium features or locations.
- Strong performing properties (Top 25%) achieve nightly rates of $229 or more.
- Typical properties (Median) charge around $136 per night.
- Entry-level properties (Bottom 25%) earn around $91 per night.
Average Daily Rate (ADR) Trend by Month in Pincher Creek
Get Live Pincher Creek Market Intelligence 👇

Explore Real-time Analytics
Airbnb Seasonality Analysis & Trends in Pincher Creek (2025)
Peak Season (August, July, September)
- Revenue averages $3,505 per month
- Occupancy rates average 70.3%
- Daily rates average $172
Shoulder Season
- Revenue averages $2,344 per month
- Occupancy maintains around 45.6%
- Daily rates hold near $163
Low Season (January, February, March)
- Revenue drops to average $1,511 per month
- Occupancy decreases to average 36.6%
- Daily rates adjust to average $148
Seasonality Insights for Pincher Creek
- The Airbnb seasonality in Pincher Creek shows highly seasonal trends requiring careful strategy. While the sections above show seasonal averages, it's also insightful to look at the extremes:
- During the high season, the absolute peak month showcases Pincher Creek's highest earning potential, with monthly revenues capable of climbing to $3,744, occupancy reaching a high of 74.6%, and ADRs peaking at $174.
- Conversely, the slowest single month of the year, typically falling within the low season, marks the market's lowest point. In this month, revenue might dip to $1,393, occupancy could drop to 31.9%, and ADRs may adjust down to $146.
- Understanding both the seasonal averages and these monthly peaks and troughs in revenue, occupancy, and ADR is crucial for maximizing your Airbnb profit potential in Pincher Creek.
Seasonal Strategies for Maximizing Profit
- Peak Season: Maximize revenue through premium pricing and potentially longer minimum stays. Ensure high availability.
- Low Season: Offer competitive pricing, special promotions (e.g., extended stay discounts), and flexible cancellation policies. Target off-season travelers like remote workers or budget-conscious guests.
- Shoulder Seasons: Implement dynamic pricing that balances peak and low rates. Target weekend travelers or specific events. Offer slightly more flexible terms than peak season.
- Regularly analyze your own performance against these Pincher Creek seasonality benchmarks and adjust your pricing and availability strategy accordingly.
Best Areas for Airbnb Investment in Pincher Creek (2025)
Exploring the top neighborhoods for short-term rentals in Pincher Creek? This section highlights key areas, outlining why they are attractive for hosts and guests, along with notable local attractions. Consider these locations based on your target guest profile and investment strategy.
| Neighborhood / Area | Why Host Here? (Target Guests & Appeal) | Key Attractions & Landmarks |
|---|---|---|
| Crowsnest Pass | A picturesque area with stunning mountain views, ideal for outdoor enthusiasts. Popular for hiking, biking, and skiing, attracting tourists year-round. | Crowsnest Mountain, Castle Mountain Resort, Frank Slide, Kananaskis Country, Crowsnest Pass Golf Club |
| Waterton Lakes National Park | A UNESCO World Heritage site known for its breathtaking landscapes and diverse wildlife. A prime destination for nature lovers and those seeking adventure. | Waterton Lake, Red Rock Canyon, Cameron Falls, Crypt Lake, Bear's Hump |
| Pincher Creek Town Center | The main hub of the community that offers local shops, dining, and proximity to major attractions. Great for guests who want to explore local culture. | Pincher Creek Museum, Kootenai Brown Pioneer Village, St. Paul’s Presbyterian Church, local markets, community events |
| Montana's Border Area | Close to the US border, making it a strategic location for visitors from Montana. Offers various outdoor activities and beautiful scenery. | Glacier National Park (USA), Oldman River, Waterton-Glacier International Peace Park, local hiking trails, fishing spots |
| Castle Mountain Resort | A popular ski resort that attracts winter sport enthusiasts. During summer, it's ideal for hiking and mountain biking. | Ski slopes, Mountain biking trails, Castle Mountain Resort activities, Alberta's scenic byways, great dining options nearby |
| Kananaskis Country | Known for its stunning mountain landscapes and outdoor recreation, attracting families and adventurers alike throughout the year. | Mount Baldy, Kananaskis Golf Course, Elk Pass, Biking and hiking trails, Cross country skiing |
| Burmis Tree Area | A unique natural landmark, this area is sought after for its striking views and tranquility, perfect for those looking to escape the hustle. | Burmis Tree, scenic viewpoints, nature trails, photography opportunities, wildlife viewing |
| Nanton | A charming town south of Pincher Creek known for its antique shops and historical sites, suitable for visitors interested in a quaint small-town experience. | Nanton Antique Mall, Canadian Skydiving Centre, Museum of Miniatures, Nanton Aerodrome, local dining and cafes |
Understanding Airbnb License Requirements & STR Laws in Pincher Creek (2025)
While Pincher Creek, Alberta, Canada currently shows low STR regulations, specific Airbnb license requirements might still exist or change. Always verify the latest short term rental regulations and Airbnb license requirements directly with local government authorities for Pincher Creek to ensure full compliance before hosting.
(Source: AirROI data, 2025, finding no licensed listings among those analyzed)
Top Performing Airbnb Properties in Pincher Creek (2025)
Benchmark your potential! Explore examples of top-performing Airbnb properties in Pincher Creekbased on Trailing Twelve Month (TTM) revenue. Analyze their characteristics, revenue, occupancy rate, and ADR to understand what drives success in this market.
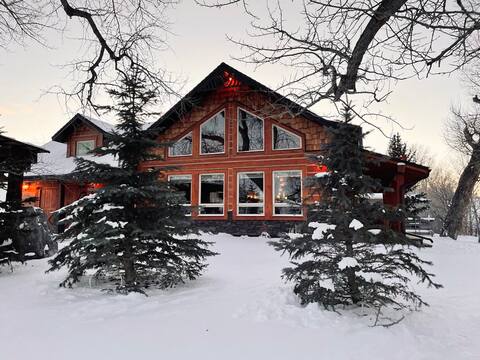
Cozy creekside cabin
Entire Place • 3 bedrooms

Gladstone Valley Family Getaway
Entire Place • 4 bedrooms
High Rustler House - Ski-in, Ski-out @ Castle
Entire Place • 3 bedrooms
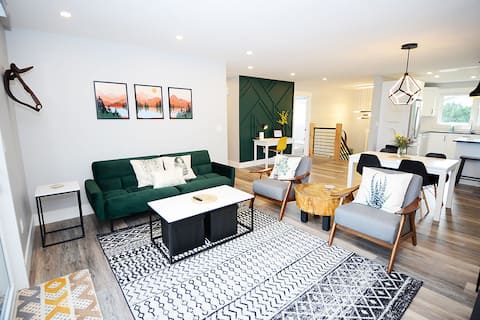
NEW&Modern 4-bedroom House close to the mountains.
Entire Place • 4 bedrooms

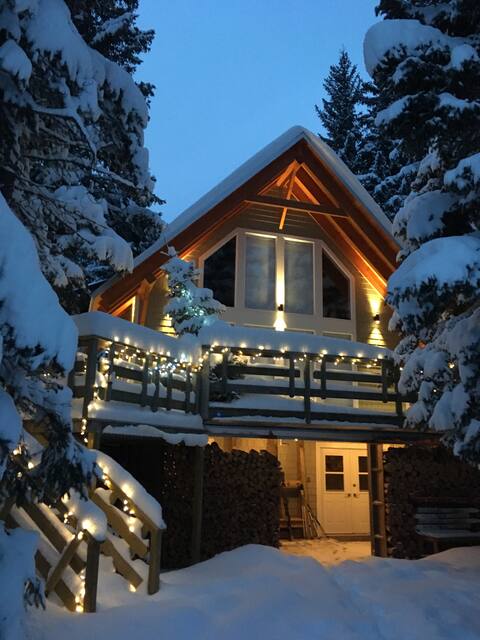
Rocking Chair Cabin
Entire Place • 2 bedrooms
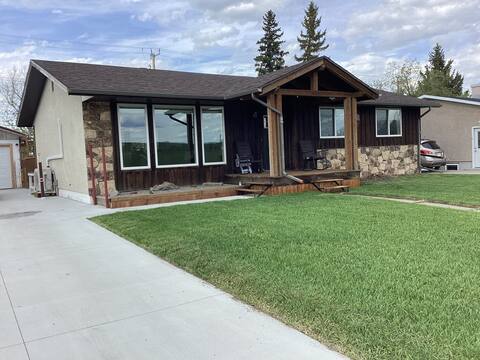
Pincher Creek Mountain View
Entire Place • 4 bedrooms
Note: Performance varies based on location, size, amenities, seasonality, and management quality. Data reflects the past 12 months.
Top Performing Airbnb Hosts in Pincher Creek (2025)
Learn from the best! This table showcases top-performing Airbnb hosts in Pincher Creek based on the number of properties managed and estimated total revenue over the past year. Analyze their scale and performance metrics.
| Host Name | Properties | Grossing Revenue | Stay Reviews | Avg Rating |
|---|---|---|---|---|
| Japhia | 5 | $159,855 | 371 | 4.95/5.0 |
| Bette | 4 | $77,686 | 268 | 4.95/5.0 |
| Rilla | 1 | $57,428 | 91 | 4.97/5.0 |
| Eliza | 1 | $51,241 | 128 | 4.88/5.0 |
| Andy And Betty | 2 | $51,024 | 78 | 5.00/5.0 |
| Katherine | 1 | $45,729 | 230 | 4.98/5.0 |
| Mark | 2 | $34,147 | 363 | 4.82/5.0 |
| Mariah | 1 | $33,496 | 33 | 4.85/5.0 |
| Mj | 1 | $33,484 | 36 | 4.94/5.0 |
| Darin | 1 | $33,300 | 26 | 4.77/5.0 |
Analyzing the strategies of top hosts, such as their property selection, pricing, and guest communication, can offer valuable lessons for optimizing your own Airbnb operations in Pincher Creek.
Dive Deeper: Advanced Pincher Creek STR Market Data (2025)
Ready to unlock more insights? AirROI provides access to advanced metrics and comprehensive Airbnb data for Pincher Creek. Explore detailed analytics beyond this report to refine your investment strategy, optimize pricing, and maximize your vacation rental profits.
Explore Advanced MetricsPincher Creek Short-Term Rental Market Composition (2025): Property & Room Types
Room Type Distribution
Property Type Distribution
Market Composition Insights for Pincher Creek
- The Pincher Creek Airbnb market composition is heavily skewed towards Entire Home/Apt listings, which make up 91.4% of the 35 active rentals. This indicates strong guest preference for privacy and space.
- Looking at the property type distribution in Pincher Creek, House properties are the most common (54.3%), reflecting the local real estate landscape.
- Houses represent a significant 54.3% portion, catering likely to families or larger groups.
- Smaller segments like hotel/boutique (combined 2.9%) offer potential for unique stay experiences.
Pincher Creek Airbnb Room Capacity Analysis (2025): Bedroom Distribution
Distribution of Listings by Number of Bedrooms
Room Capacity Insights for Pincher Creek
- The dominant room capacity in Pincher Creek is 2 bedrooms listings, making up 45.7% of the market. This suggests a strong demand for properties suitable for couples or solo travelers.
- Together, 2 bedrooms and 1 bedroom properties represent 62.8% of the active Airbnb listings in Pincher Creek, indicating a high concentration in these sizes.
- A significant 31.4% of listings offer 3+ bedrooms, catering to larger groups and families seeking more space in Pincher Creek.
Pincher Creek Vacation Rental Guest Capacity Trends (2025)
Distribution of Listings by Guest Capacity
Guest Capacity Insights for Pincher Creek
- The most common guest capacity trend in Pincher Creek vacation rentals is listings accommodating 4 guests (37.1%). This suggests the primary traveler segment is likely small families or groups.
- Properties designed for 4 guests and 8+ guests dominate the Pincher Creek STR market, accounting for 60.0% of listings.
- 34.3% of properties accommodate 6+ guests, serving the market segment for larger families or group travel in Pincher Creek.
- On average, properties in Pincher Creek are equipped to host 4.6 guests.
Pincher Creek Airbnb Booking Patterns (2025): Available vs. Booked Days
Available Days Distribution
Booked Days Distribution
Booking Pattern Insights for Pincher Creek
- The most common availability pattern in Pincher Creek falls within the 181-270 days range, representing 45.7% of listings. This suggests many properties have significant open periods on their calendars.
- Approximately 60.0% of listings show high availability (181+ days open annually), indicating potential for increased bookings or specific owner usage patterns.
- For booked days, the 91-180 days range is most frequent in Pincher Creek (48.6%), reflecting common guest stay durations or potential owner blocking patterns.
- A notable 40.0% of properties secure long booking periods (181+ days booked per year), highlighting successful long-term rental strategies or significant owner usage.
Pincher Creek Airbnb Minimum Stay Requirements Analysis
Distribution of Listings by Minimum Night Requirement
1 Night
12 listings
36.4% of total
2 Nights
20 listings
60.6% of total
3 Nights
1 listings
3% of total
Key Insights
- The most prevalent minimum stay requirement in Pincher Creek is 2 Nights, adopted by 60.6% of listings. This highlights the market's preference for shorter, flexible bookings.
- A strong majority (97.0%) of the Pincher Creek Airbnb data shows acceptance of very short stays (1-2 nights), indicating a dynamic, high-turnover market.
Recommendations
- Align with the market by considering a 2 Nights minimum stay, as 60.6% of Pincher Creek hosts use this setting.
- Adjust minimum nights based on seasonality – potentially shorter during low season and longer during peak demand periods in Pincher Creek.
Pincher Creek Airbnb Cancellation Policy Trends Analysis (2025)
Flexible
11 listings
33.3% of total
Moderate
15 listings
45.5% of total
Firm
5 listings
15.2% of total
Strict
2 listings
6.1% of total
Cancellation Policy Insights for Pincher Creek
- The prevailing Airbnb cancellation policy trend in Pincher Creek is Moderate, used by 45.5% of listings.
- The market strongly favors guest-friendly terms, with 78.8% of listings offering Flexible or Moderate policies. This suggests guests in Pincher Creek may expect booking flexibility.
- Strict cancellation policies are quite rare (6.1%), potentially making listings with this policy less competitive unless justified by high demand or property type.
Recommendations for Hosts
- Consider adopting a Moderate policy to align with the 45.5% market standard in Pincher Creek.
- Using a Strict policy might deter some guests, as only 6.1% of listings use it. Evaluate if potential revenue protection outweighs possible lower booking rates.
- Regularly review your cancellation policy against competitors and market demand shifts in Pincher Creek.
Pincher Creek STR Booking Lead Time Analysis (2025)
Average Booking Lead Time by Month
Booking Lead Time Insights for Pincher Creek
- The overall average booking lead time for vacation rentals in Pincher Creek is 61 days.
- Guests book furthest in advance for stays during April (average 102 days), likely coinciding with peak travel demand or local events.
- The shortest booking windows occur for stays in January (average 39 days), indicating more last-minute travel plans during this time.
- Seasonally, Spring (76 days avg.) sees the longest lead times, while Winter (53 days avg.) has the shortest, reflecting typical travel planning cycles.
Recommendations for Hosts
- Use the overall average lead time (61 days) as a baseline for your pricing and availability strategy in Pincher Creek.
- For April stays, consider implementing length-of-stay discounts or slightly higher rates for bookings made less than 102 days out to capitalize on advance planning.
- Target marketing efforts for the Spring season well in advance (at least 76 days) to capture early planners.
- Monitor your own booking lead times against these Pincher Creek averages to identify opportunities for dynamic pricing adjustments.
Popular & Essential Airbnb Amenities in Pincher Creek (2025)
Amenity Prevalence
Amenity Insights for Pincher Creek
- Essential amenities in Pincher Creek that guests expect include: Free parking on premises, Coffee maker, Smoke alarm, Dishes and silverware, Hot water, Heating. Lacking these (any) could significantly impact bookings.
- Popular amenities like Cooking basics, Essentials, Refrigerator are common but not universal. Offering these can provide a competitive edge.
- Warning: Wifi is not universally provided but is considered essential globally. Ensure reliable Wifi is offered.
Recommendations for Hosts
- Ensure your listing includes all essential amenities for Pincher Creek: Free parking on premises, Coffee maker, Smoke alarm, Dishes and silverware, Hot water, Heating.
- Consider adding popular differentiators like Cooking basics or Essentials to increase appeal.
- Highlight unique or less common amenities you offer (e.g., hot tub, dedicated workspace, EV charger) in your listing description and photos.
- Regularly check competitor amenities in Pincher Creek to stay competitive.
Pincher Creek Airbnb Guest Demographics & Profile Analysis (2025)
Guest Profile Summary for Pincher Creek
- The typical guest profile for Airbnb in Pincher Creek consists of primarily domestic travelers (77%), often arriving from nearby Calgary, typically belonging to the Post-2000s (Gen Z/Alpha) group (50%), primarily speaking English or French.
- Domestic travelers account for 77.3% of guests.
- Key international markets include Canada (77.3%) and United States (15.7%).
- Top languages spoken are English (64.1%) followed by French (8.8%).
- A significant demographic segment is the Post-2000s (Gen Z/Alpha) group, representing 50% of guests.
Recommendations for Hosts
- Target domestic marketing efforts towards travelers from Calgary and Edmonton.
- Tailor amenities and listing descriptions to appeal to the dominant Post-2000s (Gen Z/Alpha) demographic (e.g., highlight fast WiFi, smart home features, local guides).
- Highlight unique local experiences or amenities relevant to the primary guest profile.
- Consider seasonal promotions aligned with peak travel times for key origin markets.
Nearby Short-Term Rental Market Comparison
How does the Pincher Creek Airbnb market stack up against its neighbors? Compare key performance metrics like average monthly revenue, ADR, and occupancy rates in surrounding areas to understand the broader regional STR landscape.
| Market | Active Properties | Monthly Revenue | Daily Rate | Avg. Occupancy |
|---|---|---|---|---|
| West Glacier | 75 | $4,444 | $391.91 | 57% |
| Whitefish | 958 | $3,651 | $397.84 | 42% |
| Glacier County | 12 | $3,518 | $298.24 | 65% |
| Babb | 56 | $3,336 | $268.84 | 65% |
| Foothills County | 10 | $3,078 | $214.25 | 47% |
| Bragg Creek | 49 | $3,030 | $196.73 | 58% |
| Somers | 71 | $2,961 | $349.64 | 46% |
| Martin City | 45 | $2,922 | $233.28 | 57% |
| Columbia Falls | 501 | $2,795 | $273.43 | 52% |
| Kalispell | 506 | $2,792 | $256.27 | 51% |