Clearwater County Airbnb Market Analysis 2025: Short Term Rental Data & Vacation Rental Statistics in Alberta, Canada
Is Airbnb profitable in Clearwater County in 2025? Explore comprehensive Airbnb analytics for Clearwater County, Alberta, Canada to uncover income potential. This 2025 STR market report for Clearwater County, based on AirROI data from April 2024 to March 2025, reveals key trends in the niche market of 21 active listings.
Whether you're considering an Airbnb investment in Clearwater County, optimizing your existing vacation rental, or exploring rental arbitrage opportunities, understanding the Clearwater County Airbnb data is crucial. Leveraging the low regulation environment is key to maximizing your short term rental income potential. Let's dive into the specifics.
Key Clearwater County Airbnb Performance Metrics Overview
Monthly Airbnb Revenue Variations & Income Potential in Clearwater County (2025)
Understanding the monthly revenue variations for Airbnb listings in Clearwater County is key to maximizing your short term rental income potential. Seasonality significantly impacts earnings. Our analysis, based on data from the past 12 months, shows that the peak revenue month for STRs in Clearwater County is typically July, while March often presents the lowest earnings, highlighting opportunities for strategic pricing adjustments during shoulder and low seasons. Explore the typical Airbnb income in Clearwater County across different performance tiers:
- Best-in-class properties (Top 10%) achieve $4,382+ monthly, often utilizing dynamic pricing and superior guest experiences.
- Strong performing properties (Top 25%) earn $2,863 or more, indicating effective management and desirable locations/amenities.
- Typical properties (Median) generate around $1,711 per month, representing the average market performance.
- Entry-level properties (Bottom 25%) see earnings around $1,045, often with potential for optimization.
Average Monthly Airbnb Earnings Trend in Clearwater County
Clearwater County Airbnb Occupancy Rate Trends (2025)
Maximize your bookings by understanding the Clearwater County STR occupancy trends. Seasonal demand shifts significantly influence how often properties are booked. Typically, Octobersees the highest demand (peak season occupancy), while March experiences the lowest (low season). Effective strategies, like adjusting minimum stays or offering promotions, can boost occupancy during slower periods. Here's how different property tiers perform in Clearwater County:
- Best-in-class properties (Top 10%) achieve 76%+ occupancy, indicating high desirability and potentially optimized availability.
- Strong performing properties (Top 25%) maintain 64% or higher occupancy, suggesting good market fit and guest satisfaction.
- Typical properties (Median) have an occupancy rate around 41%.
- Entry-level properties (Bottom 25%) average 28% occupancy, potentially facing higher vacancy.
Average Monthly Occupancy Rate Trend in Clearwater County
Average Daily Rate (ADR) Airbnb Trends in Clearwater County (2025)
Effective short term rental pricing strategy in Clearwater County involves understanding monthly ADR fluctuations. The Average Daily Rate (ADR) for Airbnb in Clearwater County typically peaks in July and dips lowest during March. Leveraging Airbnb dynamic pricing tools or strategies based on this seasonality can significantly boost revenue. Here's a look at the typical nightly rates achieved:
- Best-in-class properties (Top 10%) command rates of $231+ per night, often due to premium features or locations.
- Strong performing properties (Top 25%) achieve nightly rates of $162 or more.
- Typical properties (Median) charge around $113 per night.
- Entry-level properties (Bottom 25%) earn around $100 per night.
Average Daily Rate (ADR) Trend by Month in Clearwater County
Get Live Clearwater County Market Intelligence 👇
Explore Real-time Analytics
Airbnb Seasonality Analysis & Trends in Clearwater County (2025)
Peak Season (July, October, August)
- Revenue averages $2,919 per month
- Occupancy rates average 58.6%
- Daily rates average $151
Shoulder Season
- Revenue averages $2,465 per month
- Occupancy maintains around 43.1%
- Daily rates hold near $144
Low Season (January, March, November)
- Revenue drops to average $1,681 per month
- Occupancy decreases to average 34.4%
- Daily rates adjust to average $137
Seasonality Insights for Clearwater County
- The Airbnb seasonality in Clearwater County shows highly seasonal trends requiring careful strategy. While the sections above show seasonal averages, it's also insightful to look at the extremes:
- During the high season, the absolute peak month showcases Clearwater County's highest earning potential, with monthly revenues capable of climbing to $3,074, occupancy reaching a high of 65.7%, and ADRs peaking at $154.
- Conversely, the slowest single month of the year, typically falling within the low season, marks the market's lowest point. In this month, revenue might dip to $1,348, occupancy could drop to 29.3%, and ADRs may adjust down to $133.
- Understanding both the seasonal averages and these monthly peaks and troughs in revenue, occupancy, and ADR is crucial for maximizing your Airbnb profit potential in Clearwater County.
Seasonal Strategies for Maximizing Profit
- Peak Season: Maximize revenue through premium pricing and potentially longer minimum stays. Ensure high availability.
- Low Season: Offer competitive pricing, special promotions (e.g., extended stay discounts), and flexible cancellation policies. Target off-season travelers like remote workers or budget-conscious guests.
- Shoulder Seasons: Implement dynamic pricing that balances peak and low rates. Target weekend travelers or specific events. Offer slightly more flexible terms than peak season.
- Regularly analyze your own performance against these Clearwater County seasonality benchmarks and adjust your pricing and availability strategy accordingly.
Best Areas for Airbnb Investment in Clearwater County (2025)
Exploring the top neighborhoods for short-term rentals in Clearwater County? This section highlights key areas, outlining why they are attractive for hosts and guests, along with notable local attractions. Consider these locations based on your target guest profile and investment strategy.
| Neighborhood / Area | Why Host Here? (Target Guests & Appeal) | Key Attractions & Landmarks |
|---|---|---|
| Cypress Hills Provincial Park | A stunning natural area with outdoor activities such as hiking, fishing, and wildlife viewing. It attracts nature enthusiasts and families seeking a peaceful getaway. | Hiking Trails, Wildlife Viewing, Fishing, Cypress Hills Interprovincial Park, Picnic Areas, Scenic Lookouts |
| Drumheller | Famous for its unique landscapes and dinosaur fossils, Drumheller is a popular destination for tourists interested in paleontology and natural history. | Royal Tyrrell Museum, Horseshoe Canyon, Dinosaur Trail, Manitoba St. Bridge, The Hoodoos, Badlands |
| Kananaskis Country | A lesser-known gem for outdoor lovers, offering incredible hiking, skiing, and mountain biking opportunities. Perfect for those looking for adventure close to nature. | Kananaskis Golf Course, Mount Lougheed, Kananaskis Village, Fishing, Mountain Biking trails, Hiking trails |
| Banff National Park | One of Canada's most iconic destinations, known for its breathtaking mountain scenery and outdoor adventures. Popular among tourists year-round for both summer and winter activities. | Lake Louise, Moraine Lake, Banff Gondola, Hiking Trails, Hot Springs, Wildlife Viewing |
| Edmonton | Alberta’s capital city, known for its festivals, arts scene, and shopping. A great urban destination for visitors looking for culture and entertainment. | West Edmonton Mall, Edmonton Valley Zoo, Art Gallery of Alberta, Fort Edmonton Park, William Hawrelak Park, Edmonton International Fringe Festival |
| Calgary | Known for the Calgary Stampede and its vibrant cultural scene. A gateway to the Rockies, attracting tourists who enjoy both urban and natural experiences. | Calgary Zoo, Calgary Tower, Heritage Park, Prince's Island Park, Kensington Village, Calgary Stampede |
| Red Deer | Located between Calgary and Edmonton, Red Deer serves as a convenient location with a mix of urban amenities and access to natural surroundings. | Waskasoo Park, Red Deer Museum, Bower Ponds, Gaetz Lakes Sanctuary, Red Deer College, Kerry Wood Nature Centre |
| Lake Louise | Renowned for its stunning turquoise lake and mountainous backdrop, Lake Louise is a must-visit for tourists looking for extraordinary natural beauty and outdoor activities. | Lake Louise Gondola, Lake Agnes Teahouse, Hiking Trails, Animal Viewing, Marble Canyon, Louise Lake |
Understanding Airbnb License Requirements & STR Laws in Clearwater County (2025)
While Clearwater County, Alberta, Canada currently shows low STR regulations, specific Airbnb license requirements might still exist or change. Always verify the latest short term rental regulations and Airbnb license requirements directly with local government authorities for Clearwater County to ensure full compliance before hosting.
(Source: AirROI data, 2025, finding no licensed listings among those analyzed)
Top Performing Airbnb Properties in Clearwater County (2025)
Benchmark your potential! Explore examples of top-performing Airbnb properties in Clearwater Countybased on Trailing Twelve Month (TTM) revenue. Analyze their characteristics, revenue, occupancy rate, and ADR to understand what drives success in this market.

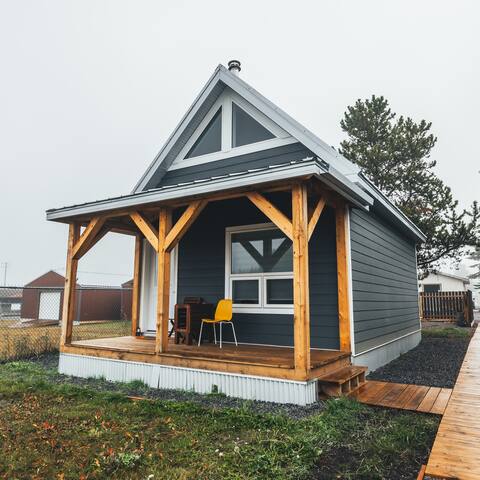
Stix Cabin
Entire Place • 1 bedroom
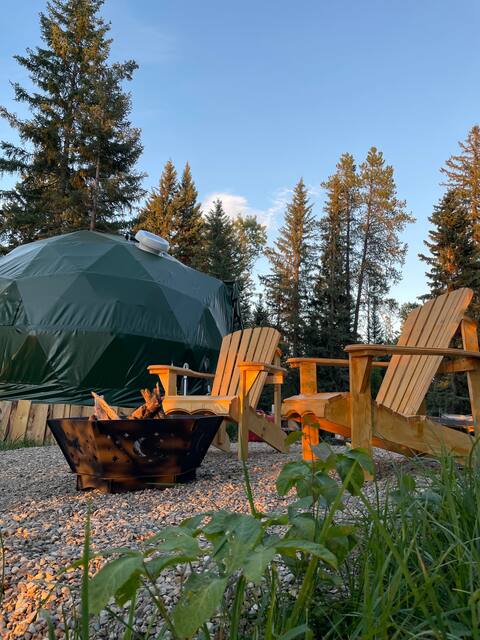
The Stargazer's Sanctuary Geodome @ BLR
Entire Place • 1 bedroom

Cabin on private ranch near Sundre (1)
Entire Place • 2 bedrooms
Coliseum - get back to Nature
Entire Place • 2 bedrooms

Beaver Lodge
Entire Place • 3 bedrooms
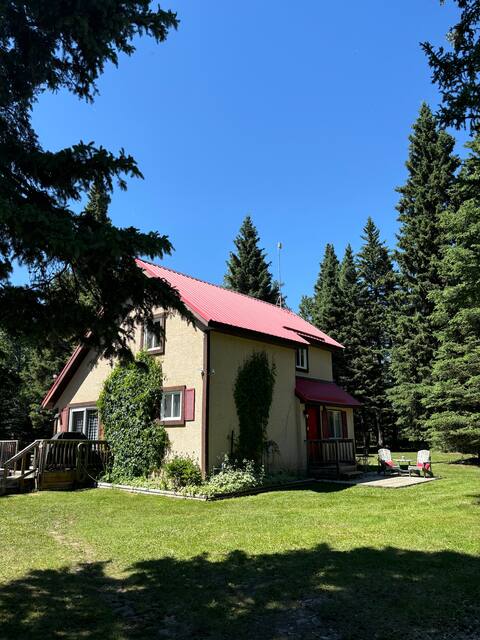
Clearwater Cottage
Entire Place • 3 bedrooms
Note: Performance varies based on location, size, amenities, seasonality, and management quality. Data reflects the past 12 months.
Top Performing Airbnb Hosts in Clearwater County (2025)
Learn from the best! This table showcases top-performing Airbnb hosts in Clearwater County based on the number of properties managed and estimated total revenue over the past year. Analyze their scale and performance metrics.
| Host Name | Properties | Grossing Revenue | Stay Reviews | Avg Rating |
|---|---|---|---|---|
| Trevor | 8 | $104,230 | 288 | 4.82/5.0 |
| Whitney | 1 | $99,179 | 143 | 4.97/5.0 |
| Warren | 2 | $51,607 | 72 | 2.48/5.0 |
| Becca | 1 | $30,999 | 20 | 4.95/5.0 |
| Celina | 1 | $27,550 | 79 | 4.94/5.0 |
| Barry & Sue | 1 | $27,123 | 45 | 4.96/5.0 |
| Cindy | 1 | $26,629 | 40 | 4.95/5.0 |
| Host #5316543 | 1 | $23,879 | 4 | 5.00/5.0 |
| Daniel | 2 | $12,760 | 10 | 2.50/5.0 |
| Host #55705780 | 1 | $12,527 | 0 | 0.00/5.0 |
Analyzing the strategies of top hosts, such as their property selection, pricing, and guest communication, can offer valuable lessons for optimizing your own Airbnb operations in Clearwater County.
Dive Deeper: Advanced Clearwater County STR Market Data (2025)
Ready to unlock more insights? AirROI provides access to advanced metrics and comprehensive Airbnb data for Clearwater County. Explore detailed analytics beyond this report to refine your investment strategy, optimize pricing, and maximize your vacation rental profits.
Explore Advanced MetricsClearwater County Short-Term Rental Market Composition (2025): Property & Room Types
Room Type Distribution
Property Type Distribution
Market Composition Insights for Clearwater County
- The Clearwater County Airbnb market composition is heavily skewed towards Entire Home/Apt listings, which make up 100% of the 21 active rentals. This indicates strong guest preference for privacy and space.
- Looking at the property type distribution in Clearwater County, House properties are the most common (47.6%), reflecting the local real estate landscape.
- Houses represent a significant 47.6% portion, catering likely to families or larger groups.
Clearwater County Airbnb Room Capacity Analysis (2025): Bedroom Distribution
Distribution of Listings by Number of Bedrooms
Room Capacity Insights for Clearwater County
- The dominant room capacity in Clearwater County is 1 bedroom listings, making up 52.4% of the market. This suggests a strong demand for properties suitable for couples or solo travelers.
- Together, 1 bedroom and 2 bedrooms properties represent 66.7% of the active Airbnb listings in Clearwater County, indicating a high concentration in these sizes.
- With over half the market (52.4%) consisting of studios or 1-bedroom units, Clearwater County is particularly well-suited for individuals or couples.
Clearwater County Vacation Rental Guest Capacity Trends (2025)
Distribution of Listings by Guest Capacity
Guest Capacity Insights for Clearwater County
- The most common guest capacity trend in Clearwater County vacation rentals is listings accommodating 4 guests (52.4%). This suggests the primary traveler segment is likely small families or groups.
- Properties designed for 4 guests and 6 guests dominate the Clearwater County STR market, accounting for 81.0% of listings.
- 38.1% of properties accommodate 6+ guests, serving the market segment for larger families or group travel in Clearwater County.
- On average, properties in Clearwater County are equipped to host 4.9 guests.
Clearwater County Airbnb Booking Patterns (2025): Available vs. Booked Days
Available Days Distribution
Booked Days Distribution
Booking Pattern Insights for Clearwater County
- The most common availability pattern in Clearwater County falls within the 181-270 days range, representing 47.6% of listings. This suggests many properties have significant open periods on their calendars.
- Approximately 80.9% of listings show high availability (181+ days open annually), indicating potential for increased bookings or specific owner usage patterns.
- For booked days, the 91-180 days range is most frequent in Clearwater County (47.6%), reflecting common guest stay durations or potential owner blocking patterns.
- A notable 19.1% of properties secure long booking periods (181+ days booked per year), highlighting successful long-term rental strategies or significant owner usage.
Clearwater County Airbnb Minimum Stay Requirements Analysis
Distribution of Listings by Minimum Night Requirement
1 Night
11 listings
55% of total
2 Nights
6 listings
30% of total
4-6 Nights
1 listings
5% of total
30+ Nights
2 listings
10% of total
Key Insights
- The most prevalent minimum stay requirement in Clearwater County is 1 Night, adopted by 55% of listings. This highlights the market's preference for shorter, flexible bookings.
- A strong majority (85.0%) of the Clearwater County Airbnb data shows acceptance of very short stays (1-2 nights), indicating a dynamic, high-turnover market.
Recommendations
- Align with the market by considering a 1 Night minimum stay, as 55% of Clearwater County hosts use this setting.
- Explore offering discounts for stays of 30+ nights to attract the 10% of the market seeking extended stays.
- Adjust minimum nights based on seasonality – potentially shorter during low season and longer during peak demand periods in Clearwater County.
Clearwater County Airbnb Cancellation Policy Trends Analysis (2025)
Flexible
2 listings
11.8% of total
Moderate
9 listings
52.9% of total
Firm
5 listings
29.4% of total
Strict
1 listings
5.9% of total
Cancellation Policy Insights for Clearwater County
- The prevailing Airbnb cancellation policy trend in Clearwater County is Moderate, used by 52.9% of listings.
- There's a relatively balanced mix between guest-friendly (64.7%) and stricter (35.3%) policies, offering choices for different guest needs.
- Strict cancellation policies are quite rare (5.9%), potentially making listings with this policy less competitive unless justified by high demand or property type.
Recommendations for Hosts
- Consider adopting a Moderate policy to align with the 52.9% market standard in Clearwater County.
- Using a Strict policy might deter some guests, as only 5.9% of listings use it. Evaluate if potential revenue protection outweighs possible lower booking rates.
- Regularly review your cancellation policy against competitors and market demand shifts in Clearwater County.
Clearwater County STR Booking Lead Time Analysis (2025)
Average Booking Lead Time by Month
Booking Lead Time Insights for Clearwater County
- The overall average booking lead time for vacation rentals in Clearwater County is 53 days.
- Guests book furthest in advance for stays during November (average 115 days), likely coinciding with peak travel demand or local events.
- The shortest booking windows occur for stays in April (average 23 days), indicating more last-minute travel plans during this time.
- Seasonally, Fall (79 days avg.) sees the longest lead times, while Winter (39 days avg.) has the shortest, reflecting typical travel planning cycles.
Recommendations for Hosts
- Use the overall average lead time (53 days) as a baseline for your pricing and availability strategy in Clearwater County.
- For November stays, consider implementing length-of-stay discounts or slightly higher rates for bookings made less than 115 days out to capitalize on advance planning.
- Target marketing efforts for the Fall season well in advance (at least 79 days) to capture early planners.
- Monitor your own booking lead times against these Clearwater County averages to identify opportunities for dynamic pricing adjustments.
Popular & Essential Airbnb Amenities in Clearwater County (2025)
Amenity Prevalence
Amenity Insights for Clearwater County
- Essential amenities in Clearwater County that guests expect include: Free parking on premises, Essentials. Lacking these (any) could significantly impact bookings.
- Popular amenities like Carbon monoxide alarm, Heating, Hot water are common but not universal. Offering these can provide a competitive edge.
- Warning: Wifi is not universally provided but is considered essential globally. Ensure reliable Wifi is offered.
Recommendations for Hosts
- Ensure your listing includes all essential amenities for Clearwater County: Free parking on premises, Essentials.
- Prioritize adding missing essentials: Essentials.
- Consider adding popular differentiators like Carbon monoxide alarm or Heating to increase appeal.
- Highlight unique or less common amenities you offer (e.g., hot tub, dedicated workspace, EV charger) in your listing description and photos.
- Regularly check competitor amenities in Clearwater County to stay competitive.
Clearwater County Airbnb Guest Demographics & Profile Analysis (2025)
Guest Profile Summary for Clearwater County
- The typical guest profile for Airbnb in Clearwater County consists of primarily domestic travelers (89%), often arriving from nearby Calgary, typically belonging to the Post-2000s (Gen Z/Alpha) group (50%), primarily speaking English or French.
- Domestic travelers account for 88.7% of guests.
- Key international markets include Canada (88.7%) and United States (4.9%).
- Top languages spoken are English (64.7%) followed by French (6.5%).
- A significant demographic segment is the Post-2000s (Gen Z/Alpha) group, representing 50% of guests.
Recommendations for Hosts
- Target domestic marketing efforts towards travelers from Calgary and Edmonton.
- Tailor amenities and listing descriptions to appeal to the dominant Post-2000s (Gen Z/Alpha) demographic (e.g., highlight fast WiFi, smart home features, local guides).
- Highlight unique local experiences or amenities relevant to the primary guest profile.
- Consider seasonal promotions aligned with peak travel times for key origin markets.
Nearby Short-Term Rental Market Comparison
How does the Clearwater County Airbnb market stack up against its neighbors? Compare key performance metrics like average monthly revenue, ADR, and occupancy rates in surrounding areas to understand the broader regional STR landscape.
| Market | Active Properties | Monthly Revenue | Daily Rate | Avg. Occupancy |
|---|---|---|---|---|
| Lake Louise | 16 | $6,462 | $429.40 | 42% |
| Banff | 141 | $5,227 | $401.85 | 48% |
| Canmore | 1,639 | $5,212 | $282.42 | 60% |
| Harvie Heights | 151 | $4,469 | $232.40 | 64% |
| Dead Man's Flats | 126 | $4,035 | $286.14 | 55% |
| Nordegg | 37 | $3,994 | $258.53 | 50% |
| Area A (Kicking Horse/Kinbasket Lake) | 459 | $3,390 | $247.37 | 53% |
| Yellowhead County | 36 | $2,608 | $244.67 | 44% |
| Rocky View County | 20 | $2,377 | $238.71 | 40% |
| Sundre | 12 | $2,271 | $175.05 | 38% |