Chestermere Airbnb Market Analysis 2025: Short Term Rental Data & Vacation Rental Statistics in Alberta, Canada
Is Airbnb profitable in Chestermere in 2025? Explore comprehensive Airbnb analytics for Chestermere, Alberta, Canada to uncover income potential. This 2025 STR market report for Chestermere, based on AirROI data from April 2024 to March 2025, reveals key trends in the niche market of 45 active listings.
Whether you're considering an Airbnb investment in Chestermere, optimizing your existing vacation rental, or exploring rental arbitrage opportunities, understanding the Chestermere Airbnb data is crucial. Leveraging the low regulation environment is key to maximizing your short term rental income potential. Let's dive into the specifics.
Key Chestermere Airbnb Performance Metrics Overview
Monthly Airbnb Revenue Variations & Income Potential in Chestermere (2025)
Understanding the monthly revenue variations for Airbnb listings in Chestermere is key to maximizing your short term rental income potential. Seasonality significantly impacts earnings. Our analysis, based on data from the past 12 months, shows that the peak revenue month for STRs in Chestermere is typically June, while February often presents the lowest earnings, highlighting opportunities for strategic pricing adjustments during shoulder and low seasons. Explore the typical Airbnb income in Chestermere across different performance tiers:
- Best-in-class properties (Top 10%) achieve $7,786+ monthly, often utilizing dynamic pricing and superior guest experiences.
- Strong performing properties (Top 25%) earn $3,937 or more, indicating effective management and desirable locations/amenities.
- Typical properties (Median) generate around $1,471 per month, representing the average market performance.
- Entry-level properties (Bottom 25%) see earnings around $749, often with potential for optimization.
Average Monthly Airbnb Earnings Trend in Chestermere
Chestermere Airbnb Occupancy Rate Trends (2025)
Maximize your bookings by understanding the Chestermere STR occupancy trends. Seasonal demand shifts significantly influence how often properties are booked. Typically, Julysees the highest demand (peak season occupancy), while May experiences the lowest (low season). Effective strategies, like adjusting minimum stays or offering promotions, can boost occupancy during slower periods. Here's how different property tiers perform in Chestermere:
- Best-in-class properties (Top 10%) achieve 77%+ occupancy, indicating high desirability and potentially optimized availability.
- Strong performing properties (Top 25%) maintain 61% or higher occupancy, suggesting good market fit and guest satisfaction.
- Typical properties (Median) have an occupancy rate around 39%.
- Entry-level properties (Bottom 25%) average 21% occupancy, potentially facing higher vacancy.
Average Monthly Occupancy Rate Trend in Chestermere
Average Daily Rate (ADR) Airbnb Trends in Chestermere (2025)
Effective short term rental pricing strategy in Chestermere involves understanding monthly ADR fluctuations. The Average Daily Rate (ADR) for Airbnb in Chestermere typically peaks in July and dips lowest during February. Leveraging Airbnb dynamic pricing tools or strategies based on this seasonality can significantly boost revenue. Here's a look at the typical nightly rates achieved:
- Best-in-class properties (Top 10%) command rates of $426+ per night, often due to premium features or locations.
- Strong performing properties (Top 25%) achieve nightly rates of $270 or more.
- Typical properties (Median) charge around $126 per night.
- Entry-level properties (Bottom 25%) earn around $72 per night.
Average Daily Rate (ADR) Trend by Month in Chestermere
Get Live Chestermere Market Intelligence 👇

Explore Real-time Analytics
Airbnb Seasonality Analysis & Trends in Chestermere (2025)
Peak Season (June, July, August)
- Revenue averages $4,340 per month
- Occupancy rates average 52.5%
- Daily rates average $211
Shoulder Season
- Revenue averages $2,623 per month
- Occupancy maintains around 39.2%
- Daily rates hold near $181
Low Season (January, February, October)
- Revenue drops to average $1,777 per month
- Occupancy decreases to average 37.1%
- Daily rates adjust to average $168
Seasonality Insights for Chestermere
- The Airbnb seasonality in Chestermere shows highly seasonal trends requiring careful strategy. While the sections above show seasonal averages, it's also insightful to look at the extremes:
- During the high season, the absolute peak month showcases Chestermere's highest earning potential, with monthly revenues capable of climbing to $4,717, occupancy reaching a high of 56.7%, and ADRs peaking at $216.
- Conversely, the slowest single month of the year, typically falling within the low season, marks the market's lowest point. In this month, revenue might dip to $1,718, occupancy could drop to 33.7%, and ADRs may adjust down to $158.
- Understanding both the seasonal averages and these monthly peaks and troughs in revenue, occupancy, and ADR is crucial for maximizing your Airbnb profit potential in Chestermere.
Seasonal Strategies for Maximizing Profit
- Peak Season: Maximize revenue through premium pricing and potentially longer minimum stays. Ensure high availability.
- Low Season: Offer competitive pricing, special promotions (e.g., extended stay discounts), and flexible cancellation policies. Target off-season travelers like remote workers or budget-conscious guests.
- Shoulder Seasons: Implement dynamic pricing that balances peak and low rates. Target weekend travelers or specific events. Offer slightly more flexible terms than peak season.
- Regularly analyze your own performance against these Chestermere seasonality benchmarks and adjust your pricing and availability strategy accordingly.
Best Areas for Airbnb Investment in Chestermere (2025)
Exploring the top neighborhoods for short-term rentals in Chestermere? This section highlights key areas, outlining why they are attractive for hosts and guests, along with notable local attractions. Consider these locations based on your target guest profile and investment strategy.
| Neighborhood / Area | Why Host Here? (Target Guests & Appeal) | Key Attractions & Landmarks |
|---|---|---|
| East Chestermere | A desirable, family-friendly area with access to local parks and lakes. Perfect for families looking for a homey environment with outdoor activities, making it popular for longer stays. | Chestermere Lake, East Chestermere Park, Local restaurants and cafes, Chestermere Recreation Centre, Playgrounds and green spaces |
| West Chestermere | Known for its lush landscapes and scenic views, this area attracts nature lovers and is ideal for hosting guests seeking relaxation and outdoor recreation. | Chestermere Lake, West Chestermere Park, Walking trails, Picnic areas, Fishing spots |
| Chestermere Town Centre | The heart of Chestermere, featuring shopping, dining, and community events. This area is perfect for guests who want convenience and access to amenities. | Chestermere Station, Local boutiques, Restaurants and coffee shops, Chestermere Market, Annual events and festivals |
| Sunset Cove | An upscale neighborhood with waterfront properties along Chestermere Lake. Ideal for visitors looking for luxury and picturesque views and activities on the water. | Lakeside pathways, Sunset views, Private docks, Fishing and boating, Community beach access |
| Rainbow Falls | A modern residential area with family-oriented amenities and close proximity to schools and parks, making it attractive for families and longer stays. | Local parks, Walking trails, Sports facilities, Community events, Playgrounds |
| Kinniburgh | A newer development area known for its spacious homes and proximity to the lake, attracting families and leisure seekers who want a relaxing stay close to nature. | Kinniburgh Lake, Walking paths, Sports parks, Community amenities, Family-friendly atmosphere |
| The Cove | A lovely lakeside community that offers a mix of recreational activities and beautiful homes. Great for those wanting a serene getaway with scenic surroundings. | Cove Beach, Lakeside walking trails, Picnic spots, Artisan shops nearby, Natural wildlife |
| Chestermere Business Park | While primarily a commercial area, it's close to residential neighborhoods and can be useful for business travelers needing short-term accommodations. | Local businesses, Proximity to residential areas, Economic development projects, Easy access to transportation, Events and workshops |
Understanding Airbnb License Requirements & STR Laws in Chestermere (2025)
While Chestermere, Alberta, Canada currently shows low STR regulations, specific Airbnb license requirements might still exist or change. Always verify the latest short term rental regulations and Airbnb license requirements directly with local government authorities for Chestermere to ensure full compliance before hosting.
(Source: AirROI data, 2025, finding no licensed listings among those analyzed)
Top Performing Airbnb Properties in Chestermere (2025)
Benchmark your potential! Explore examples of top-performing Airbnb properties in Chestermerebased on Trailing Twelve Month (TTM) revenue. Analyze their characteristics, revenue, occupancy rate, and ADR to understand what drives success in this market.

NK Paradise - Lakefront, Hot Tub, Covered Dock!
Entire Place • 4 bedrooms

LAKEFRONT CABIN WITH COVERED DECK, HOT TUB & MORE
Entire Place • 2 bedrooms

3BR,8ppl,KingBeds,HotTub,FREEparking,MountainView
Entire Place • 3 bedrooms

3BR,8ppl,KingBeds,HotTub,FREEparking,MountainView
Entire Place • 3 bedrooms

3BR,8ppl,KingBeds,HotTub,FREEparking,MountainView
Entire Place • 3 bedrooms
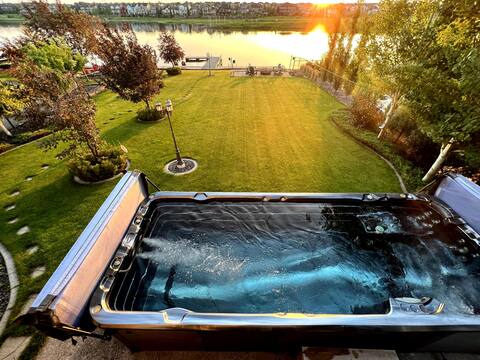
Beautiful Lakefront 5-Bed home w/ outdoor swim spa
Entire Place • 5 bedrooms
Note: Performance varies based on location, size, amenities, seasonality, and management quality. Data reflects the past 12 months.
Top Performing Airbnb Hosts in Chestermere (2025)
Learn from the best! This table showcases top-performing Airbnb hosts in Chestermere based on the number of properties managed and estimated total revenue over the past year. Analyze their scale and performance metrics.
| Host Name | Properties | Grossing Revenue | Stay Reviews | Avg Rating |
|---|---|---|---|---|
| Aymen | 3 | $224,968 | 51 | 4.70/5.0 |
| Niyush | 1 | $117,304 | 180 | 4.89/5.0 |
| Christine | 2 | $100,161 | 25 | 4.88/5.0 |
| Gary | 1 | $76,787 | 215 | 4.74/5.0 |
| Ali | 1 | $69,549 | 63 | 4.97/5.0 |
| Eileen | 1 | $65,184 | 19 | 4.95/5.0 |
| Aj | 1 | $59,084 | 90 | 4.91/5.0 |
| Maria | 6 | $38,334 | 518 | 4.80/5.0 |
| Prab | 3 | $32,120 | 123 | 4.74/5.0 |
| Host #199049835 | 1 | $31,294 | 17 | 4.94/5.0 |
Analyzing the strategies of top hosts, such as their property selection, pricing, and guest communication, can offer valuable lessons for optimizing your own Airbnb operations in Chestermere.
Dive Deeper: Advanced Chestermere STR Market Data (2025)
Ready to unlock more insights? AirROI provides access to advanced metrics and comprehensive Airbnb data for Chestermere. Explore detailed analytics beyond this report to refine your investment strategy, optimize pricing, and maximize your vacation rental profits.
Explore Advanced MetricsChestermere Short-Term Rental Market Composition (2025): Property & Room Types
Room Type Distribution
Property Type Distribution
Market Composition Insights for Chestermere
- The Chestermere Airbnb market composition is heavily skewed towards Entire Home/Apt listings, which make up 77.8% of the 45 active rentals. This indicates strong guest preference for privacy and space.
- Looking at the property type distribution in Chestermere, House properties are the most common (80%), reflecting the local real estate landscape.
- Houses represent a significant 80% portion, catering likely to families or larger groups.
- Smaller segments like apartment/condo, outdoor/unique, hotel/boutique (combined 8.8%) offer potential for unique stay experiences.
Chestermere Airbnb Room Capacity Analysis (2025): Bedroom Distribution
Distribution of Listings by Number of Bedrooms
Room Capacity Insights for Chestermere
- The dominant room capacity in Chestermere is 2 bedrooms listings, making up 35.6% of the market. This suggests a strong demand for properties suitable for couples or solo travelers.
- Together, 2 bedrooms and 3 bedrooms properties represent 55.6% of the active Airbnb listings in Chestermere, indicating a high concentration in these sizes.
- A significant 42.2% of listings offer 3+ bedrooms, catering to larger groups and families seeking more space in Chestermere.
Chestermere Vacation Rental Guest Capacity Trends (2025)
Distribution of Listings by Guest Capacity
Guest Capacity Insights for Chestermere
- The most common guest capacity trend in Chestermere vacation rentals is listings accommodating 8+ guests (28.9%). This suggests the primary traveler segment is likely larger groups.
- Properties designed for 8+ guests and 4 guests dominate the Chestermere STR market, accounting for 44.5% of listings.
- 42.2% of properties accommodate 6+ guests, serving the market segment for larger families or group travel in Chestermere.
- On average, properties in Chestermere are equipped to host 4.6 guests.
Chestermere Airbnb Booking Patterns (2025): Available vs. Booked Days
Available Days Distribution
Booked Days Distribution
Booking Pattern Insights for Chestermere
- The most common availability pattern in Chestermere falls within the 181-270 days range, representing 42.2% of listings. This suggests many properties have significant open periods on their calendars.
- Approximately 80.0% of listings show high availability (181+ days open annually), indicating potential for increased bookings or specific owner usage patterns.
- For booked days, the 91-180 days range is most frequent in Chestermere (42.2%), reflecting common guest stay durations or potential owner blocking patterns.
- A notable 20.0% of properties secure long booking periods (181+ days booked per year), highlighting successful long-term rental strategies or significant owner usage.
Chestermere Airbnb Minimum Stay Requirements Analysis
Distribution of Listings by Minimum Night Requirement
1 Night
30 listings
75% of total
2 Nights
7 listings
17.5% of total
3 Nights
1 listings
2.5% of total
4-6 Nights
2 listings
5% of total
Key Insights
- The most prevalent minimum stay requirement in Chestermere is 1 Night, adopted by 75% of listings. This highlights the market's preference for shorter, flexible bookings.
- A strong majority (92.5%) of the Chestermere Airbnb data shows acceptance of very short stays (1-2 nights), indicating a dynamic, high-turnover market.
Recommendations
- Align with the market by considering a 1 Night minimum stay, as 75% of Chestermere hosts use this setting.
- Adjust minimum nights based on seasonality – potentially shorter during low season and longer during peak demand periods in Chestermere.
Chestermere Airbnb Cancellation Policy Trends Analysis (2025)
Flexible
8 listings
21.6% of total
Moderate
3 listings
8.1% of total
Firm
8 listings
21.6% of total
Strict
18 listings
48.6% of total
Cancellation Policy Insights for Chestermere
- The prevailing Airbnb cancellation policy trend in Chestermere is Strict, used by 48.6% of listings.
- A majority (70.2%) of hosts in Chestermere utilize Firm or Strict policies, indicating a market where hosts prioritize booking security.
Recommendations for Hosts
- Consider adopting a Strict policy to align with the 48.6% market standard in Chestermere.
- With 48.6% using Strict terms, this is a viable option in Chestermere, particularly for high-value properties or during peak demand periods.
- Regularly review your cancellation policy against competitors and market demand shifts in Chestermere.
Chestermere STR Booking Lead Time Analysis (2025)
Average Booking Lead Time by Month
Booking Lead Time Insights for Chestermere
- The overall average booking lead time for vacation rentals in Chestermere is 32 days.
- Guests book furthest in advance for stays during July (average 104 days), likely coinciding with peak travel demand or local events.
- The shortest booking windows occur for stays in February (average 12 days), indicating more last-minute travel plans during this time.
- Seasonally, Summer (72 days avg.) sees the longest lead times, while Fall (27 days avg.) has the shortest, reflecting typical travel planning cycles.
Recommendations for Hosts
- Use the overall average lead time (32 days) as a baseline for your pricing and availability strategy in Chestermere.
- For July stays, consider implementing length-of-stay discounts or slightly higher rates for bookings made less than 104 days out to capitalize on advance planning.
- During February, focus on last-minute booking availability and promotions, as guests book with very short notice (12 days avg.).
- Target marketing efforts for the Summer season well in advance (at least 72 days) to capture early planners.
- Monitor your own booking lead times against these Chestermere averages to identify opportunities for dynamic pricing adjustments.
Popular & Essential Airbnb Amenities in Chestermere (2025)
Amenity Prevalence
Amenity Insights for Chestermere
- Essential amenities in Chestermere that guests expect include: Smoke alarm, Wifi, Carbon monoxide alarm, TV, Heating, Hot water, Free parking on premises. Lacking these (any) could significantly impact bookings.
- Popular amenities like Washer, Kitchen, Essentials are common but not universal. Offering these can provide a competitive edge.
Recommendations for Hosts
- Ensure your listing includes all essential amenities for Chestermere: Smoke alarm, Wifi, Carbon monoxide alarm, TV, Heating, Hot water, Free parking on premises.
- Prioritize adding missing essentials: Carbon monoxide alarm, TV, Heating, Hot water, Free parking on premises.
- Consider adding popular differentiators like Washer or Kitchen to increase appeal.
- Highlight unique or less common amenities you offer (e.g., hot tub, dedicated workspace, EV charger) in your listing description and photos.
- Regularly check competitor amenities in Chestermere to stay competitive.
Chestermere Airbnb Guest Demographics & Profile Analysis (2025)
Guest Profile Summary for Chestermere
- The typical guest profile for Airbnb in Chestermere consists of primarily domestic travelers (87%), often arriving from nearby Edmonton, typically belonging to the Post-2000s (Gen Z/Alpha) group (50%), primarily speaking English or Hindi.
- Domestic travelers account for 86.6% of guests.
- Key international markets include Canada (86.6%) and United States (7.6%).
- Top languages spoken are English (54.2%) followed by Hindi (4.5%).
- A significant demographic segment is the Post-2000s (Gen Z/Alpha) group, representing 50% of guests.
Recommendations for Hosts
- Target domestic marketing efforts towards travelers from Edmonton and Calgary.
- Tailor amenities and listing descriptions to appeal to the dominant Post-2000s (Gen Z/Alpha) demographic (e.g., highlight fast WiFi, smart home features, local guides).
- Highlight unique local experiences or amenities relevant to the primary guest profile.
- Consider seasonal promotions aligned with peak travel times for key origin markets.
Nearby Short-Term Rental Market Comparison
How does the Chestermere Airbnb market stack up against its neighbors? Compare key performance metrics like average monthly revenue, ADR, and occupancy rates in surrounding areas to understand the broader regional STR landscape.
| Market | Active Properties | Monthly Revenue | Daily Rate | Avg. Occupancy |
|---|---|---|---|---|
| Foothills County | 10 | $3,078 | $214.25 | 47% |
| Bragg Creek | 49 | $3,030 | $196.73 | 58% |
| Rocky View County | 20 | $2,377 | $238.71 | 40% |
| Sundre | 12 | $2,271 | $175.05 | 38% |
| Town of Sylvan Lake | 143 | $2,210 | $190.48 | 52% |
| Town of Cochrane | 110 | $1,986 | $148.59 | 52% |
| Drumheller | 101 | $1,593 | $153.89 | 43% |
| Calgary | 3,943 | $1,520 | $115.04 | 53% |
| Diamond Valley | 14 | $1,431 | $116.55 | 46% |
| Red Deer County | 36 | $1,413 | $149.03 | 43% |