Rockford Township Airbnb Market Analysis 2025: Short Term Rental Data & Vacation Rental Statistics in Illinois, United States
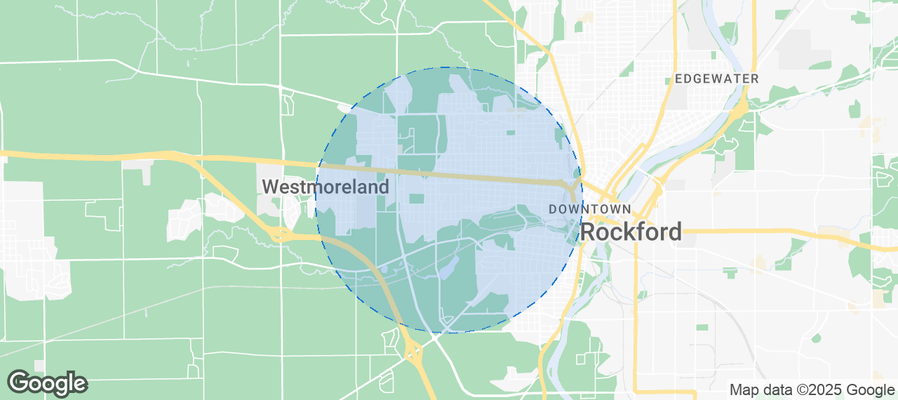
Is Airbnb profitable in Rockford Township in 2025? Explore comprehensive Airbnb analytics for Rockford Township, Illinois, United States to uncover income potential. This 2025 STR market report for Rockford Township, based on AirROI data from September 2024 to August 2025, reveals key trends in the niche market of 18 active listings.
Whether you're considering an Airbnb investment in Rockford Township, optimizing your existing vacation rental, or exploring rental arbitrage opportunities, understanding the Rockford Township Airbnb data is crucial. Leveraging the low regulation environment is key to maximizing your short term rental income potential. Let's dive into the specifics.
Key Rockford Township Airbnb Performance Metrics Overview
Monthly Airbnb Revenue Variations & Income Potential in Rockford Township (2025)
Understanding the monthly revenue variations for Airbnb listings in Rockford Township is key to maximizing your short term rental income potential. Seasonality significantly impacts earnings. Our analysis, based on data from the past 12 months, shows that the peak revenue month for STRs in Rockford Township is typically August, while February often presents the lowest earnings, highlighting opportunities for strategic pricing adjustments during shoulder and low seasons. Explore the typical Airbnb income in Rockford Township across different performance tiers:
- Best-in-class properties (Top 10%) achieve $6,278+ monthly, often utilizing dynamic pricing and superior guest experiences.
- Strong performing properties (Top 25%) earn $4,269 or more, indicating effective management and desirable locations/amenities.
- Typical properties (Median) generate around $2,686 per month, representing the average market performance.
- Entry-level properties (Bottom 25%) see earnings around $1,429, often with potential for optimization.
Average Monthly Airbnb Earnings Trend in Rockford Township
Rockford Township Airbnb Occupancy Rate Trends (2025)
Maximize your bookings by understanding the Rockford Township STR occupancy trends. Seasonal demand shifts significantly influence how often properties are booked. Typically, Octobersees the highest demand (peak season occupancy), while November experiences the lowest (low season). Effective strategies, like adjusting minimum stays or offering promotions, can boost occupancy during slower periods. Here's how different property tiers perform in Rockford Township:
- Best-in-class properties (Top 10%) achieve 90%+ occupancy, indicating high desirability and potentially optimized availability.
- Strong performing properties (Top 25%) maintain 76% or higher occupancy, suggesting good market fit and guest satisfaction.
- Typical properties (Median) have an occupancy rate around 56%.
- Entry-level properties (Bottom 25%) average 30% occupancy, potentially facing higher vacancy.
Average Monthly Occupancy Rate Trend in Rockford Township
Average Daily Rate (ADR) Airbnb Trends in Rockford Township (2025)
Effective short term rental pricing strategy in Rockford Township involves understanding monthly ADR fluctuations. The Average Daily Rate (ADR) for Airbnb in Rockford Township typically peaks in June and dips lowest during February. Leveraging Airbnb dynamic pricing tools or strategies based on this seasonality can significantly boost revenue. Here's a look at the typical nightly rates achieved:
- Best-in-class properties (Top 10%) command rates of $512+ per night, often due to premium features or locations.
- Strong performing properties (Top 25%) achieve nightly rates of $219 or more.
- Typical properties (Median) charge around $133 per night.
- Entry-level properties (Bottom 25%) earn around $93 per night.
Average Daily Rate (ADR) Trend by Month in Rockford Township
Get Live Rockford Township Market Intelligence 👇
Explore Real-time Analytics
Airbnb Seasonality Analysis & Trends in Rockford Township (2025)
Peak Season (August, July, June)
- Revenue averages $5,159 per month
- Occupancy rates average 58.4%
- Daily rates average $279
Shoulder Season
- Revenue averages $3,201 per month
- Occupancy maintains around 57.6%
- Daily rates hold near $204
Low Season (January, February, November)
- Revenue drops to average $1,957 per month
- Occupancy decreases to average 42.5%
- Daily rates adjust to average $176
Seasonality Insights for Rockford Township
- The Airbnb seasonality in Rockford Township shows highly seasonal trends requiring careful strategy. While the sections above show seasonal averages, it's also insightful to look at the extremes:
- During the high season, the absolute peak month showcases Rockford Township's highest earning potential, with monthly revenues capable of climbing to $5,347, occupancy reaching a high of 65.6%, and ADRs peaking at $284.
- Conversely, the slowest single month of the year, typically falling within the low season, marks the market's lowest point. In this month, revenue might dip to $1,767, occupancy could drop to 39.5%, and ADRs may adjust down to $168.
- Understanding both the seasonal averages and these monthly peaks and troughs in revenue, occupancy, and ADR is crucial for maximizing your Airbnb profit potential in Rockford Township.
Seasonal Strategies for Maximizing Profit
- Peak Season: Maximize revenue through premium pricing and potentially longer minimum stays. Ensure high availability.
- Low Season: Offer competitive pricing, special promotions (e.g., extended stay discounts), and flexible cancellation policies. Target off-season travelers like remote workers or budget-conscious guests.
- Shoulder Seasons: Implement dynamic pricing that balances peak and low rates. Target weekend travelers or specific events. Offer slightly more flexible terms than peak season.
- Regularly analyze your own performance against these Rockford Township seasonality benchmarks and adjust your pricing and availability strategy accordingly.
Best Areas for Airbnb Investment in Rockford Township (2025)
Exploring the top neighborhoods for short-term rentals in Rockford Township? This section highlights key areas, outlining why they are attractive for hosts and guests, along with notable local attractions. Consider these locations based on your target guest profile and investment strategy.
| Neighborhood / Area | Why Host Here? (Target Guests & Appeal) | Key Attractions & Landmarks |
|---|---|---|
| Downtown Rockford | The heart of Rockford with a vibrant atmosphere, restaurants, shops, and art galleries. Popular for both business and leisure travelers. | BMO Harris Bank Center, Discovery Center Museum, Coronado Performing Arts Center, Rockford City Market, Eugene Field Museum |
| River District | Located along the Rock River, this area offers scenic views, parks, and recreational activities. It attracts visitors looking for outdoor experiences and dining by the river. | Washington Park, Rockford Riverwalk, The 2nd Street Bridge, Riverfront Museum Park, Water Works Fountain |
| Loves Park | A suburban area with family-friendly attractions, parks, and easy access to recreational activities. Ideal for travelers seeking a quieter stay near city amenities. | Loves Park City Park, Riverside Park, Rock Cut State Park, Six Flags Hurricane Harbor, Bowl-Hi Lanes |
| Near East Side | An emerging neighborhood with a mix of historic homes and modern developments. Close to cultural attractions and local dining options, appealing to diverse visitor demographics. | Anderson Japanese Gardens, Midway Village Museum, Historic houses, Local cafes and restaurants |
| Cherry Valley | A growing community with suburban charm, offering amenities and proximity to nature. Great for families and those wanting a peaceful retreat with city access. | Cherry Valley Park, Kickapoo Creek Park, CherryVale Mall, Local dining options |
| Killbuck | A quieter area with access to parks and nature trails, attracting visitors looking for outdoor activities and a more relaxed environment away from the urban hustle. | Watch Factory Park, Killbuck Creek, Woods Creek Park |
| South Rockford | This area has affordable housing options and access to local amenities and parks, appealing to budget travelers and those seeking longer stays. | Katherine B. Churchez Park, Local restaurants and shops, Rockford Speedway |
| North End | A peaceful neighborhood with access to the Rock River, it offers a relaxing atmosphere and appeals to those looking for a quiet getaway with convenience to the city. | Loves Park Golf Course, North End Park, Local eateries, Rock River access |
Understanding Airbnb License Requirements & STR Laws in Rockford Township (2025)
While Rockford Township, Illinois, United States currently shows low STR regulations, specific Airbnb license requirements might still exist or change. Always verify the latest short term rental regulations and Airbnb license requirements directly with local government authorities for Rockford Township to ensure full compliance before hosting.
(Source: AirROI data, 2025, finding no licensed listings among those analyzed)
Top Performing Airbnb Properties in Rockford Township (2025)
Benchmark your potential! Explore examples of top-performing Airbnb properties in Rockford Townshipbased on Trailing Twelve Month (TTM) revenue. Analyze their characteristics, revenue, occupancy rate, and ADR to understand what drives success in this market.
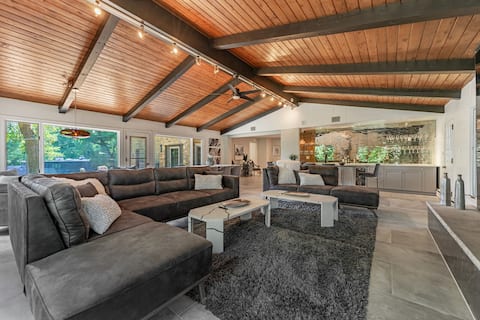
Upscale Luxury Mansion, Modern Chic & Glamorous.
Entire Place • 7 bedrooms
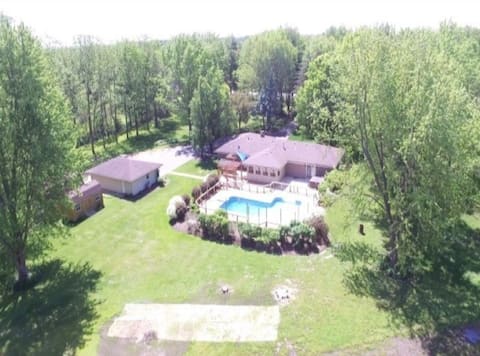
5 Acres of Solitude and Fun!
Entire Place • 6 bedrooms
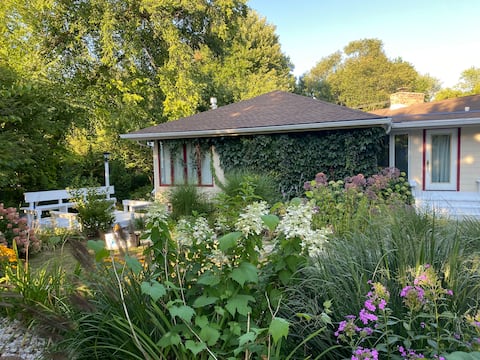
Sprawling ranch and gardens
Entire Place • 4 bedrooms
Adults Only "Red Room" Home with Hot Tub
Entire Place • 2 bedrooms
Business access in residential comfort
Entire Place • 3 bedrooms
Rockford Cascade Getaway
Entire Place • 5 bedrooms
Note: Performance varies based on location, size, amenities, seasonality, and management quality. Data reflects the past 12 months.
Top Performing Airbnb Hosts in Rockford Township (2025)
Learn from the best! This table showcases top-performing Airbnb hosts in Rockford Township based on the number of properties managed and estimated total revenue over the past year. Analyze their scale and performance metrics.
| Host Name | Properties | Grossing Revenue | Stay Reviews | Avg Rating |
|---|---|---|---|---|
| Todd | 1 | $90,968 | 19 | 4.84/5.0 |
| Dawnn | 1 | $90,175 | 20 | 5.00/5.0 |
| Marco | 1 | $50,419 | 14 | 4.86/5.0 |
| Cheryl | 1 | $42,858 | 103 | 5.00/5.0 |
| Matthew | 1 | $40,798 | 200 | 4.98/5.0 |
| Dariusz | 1 | $40,065 | 21 | 5.00/5.0 |
| Brett | 1 | $39,688 | 15 | 5.00/5.0 |
| Kirk | 1 | $37,458 | 35 | 4.89/5.0 |
| Brittany | 1 | $35,137 | 74 | 4.96/5.0 |
| Stanton | 1 | $22,517 | 31 | 5.00/5.0 |
Analyzing the strategies of top hosts, such as their property selection, pricing, and guest communication, can offer valuable lessons for optimizing your own Airbnb operations in Rockford Township.
Dive Deeper: Advanced Rockford Township STR Market Data (2025)
Ready to unlock more insights? AirROI provides access to advanced metrics and comprehensive Airbnb data for Rockford Township. Explore detailed analytics beyond this report to refine your investment strategy, optimize pricing, and maximize your vacation rental profits.
Explore Advanced MetricsRockford Township Short-Term Rental Market Composition (2025): Property & Room Types
Room Type Distribution
Property Type Distribution
Market Composition Insights for Rockford Township
- The Rockford Township Airbnb market composition is heavily skewed towards Entire Home/Apt listings, which make up 100% of the 18 active rentals. This indicates strong guest preference for privacy and space.
- Looking at the property type distribution in Rockford Township, House properties are the most common (77.8%), reflecting the local real estate landscape.
- Houses represent a significant 77.8% portion, catering likely to families or larger groups.
- The presence of 5.6% Hotel/Boutique listings indicates integration with traditional hospitality.
Rockford Township Airbnb Room Capacity Analysis (2025): Bedroom Distribution
Distribution of Listings by Number of Bedrooms
Room Capacity Insights for Rockford Township
- The dominant room capacity in Rockford Township is 2 bedrooms listings, making up 38.9% of the market. This suggests a strong demand for properties suitable for couples or solo travelers.
- Together, 2 bedrooms and 3 bedrooms properties represent 66.7% of the active Airbnb listings in Rockford Township, indicating a high concentration in these sizes.
- A significant 50.1% of listings offer 3+ bedrooms, catering to larger groups and families seeking more space in Rockford Township.
Rockford Township Vacation Rental Guest Capacity Trends (2025)
Distribution of Listings by Guest Capacity
Guest Capacity Insights for Rockford Township
- The most common guest capacity trend in Rockford Township vacation rentals is listings accommodating 6 guests (38.9%). This suggests the primary traveler segment is likely larger groups.
- Properties designed for 6 guests and 8+ guests dominate the Rockford Township STR market, accounting for 55.6% of listings.
- 66.7% of properties accommodate 6+ guests, serving the market segment for larger families or group travel in Rockford Township.
- On average, properties in Rockford Township are equipped to host 5.4 guests.
Rockford Township Airbnb Booking Patterns (2025): Available vs. Booked Days
Available Days Distribution
Booked Days Distribution
Booking Pattern Insights for Rockford Township
- The most common availability pattern in Rockford Township falls within the 181-270 days range, representing 44.4% of listings. This suggests many properties have significant open periods on their calendars.
- Approximately 72.2% of listings show high availability (181+ days open annually), indicating potential for increased bookings or specific owner usage patterns.
- For booked days, the 91-180 days range is most frequent in Rockford Township (44.4%), reflecting common guest stay durations or potential owner blocking patterns.
- A notable 27.8% of properties secure long booking periods (181+ days booked per year), highlighting successful long-term rental strategies or significant owner usage.
Rockford Township Airbnb Minimum Stay Requirements Analysis
Distribution of Listings by Minimum Night Requirement
1 Night
2 listings
11.1% of total
2 Nights
4 listings
22.2% of total
3 Nights
4 listings
22.2% of total
7-29 Nights
3 listings
16.7% of total
30+ Nights
5 listings
27.8% of total
Key Insights
- The most prevalent minimum stay requirement in Rockford Township is 30+ Nights, adopted by 27.8% of listings. This highlights the market's preference for longer commitments.
- A significant segment (27.8%) caters to monthly stays (30+ nights) in Rockford Township, pointing to opportunities in the extended-stay market.
Recommendations
- Align with the market by considering a 30+ Nights minimum stay, as 27.8% of Rockford Township hosts use this setting.
- If feasible, allowing 1-night stays, especially midweek or during low season, could capture last-minute bookings, as only 11.1% currently do.
- Explore offering discounts for stays of 30+ nights to attract the 27.8% of the market seeking extended stays.
- Adjust minimum nights based on seasonality – potentially shorter during low season and longer during peak demand periods in Rockford Township.
Rockford Township Airbnb Cancellation Policy Trends Analysis (2025)
Flexible
7 listings
38.9% of total
Moderate
4 listings
22.2% of total
Firm
4 listings
22.2% of total
Strict
3 listings
16.7% of total
Cancellation Policy Insights for Rockford Township
- The prevailing Airbnb cancellation policy trend in Rockford Township is Flexible, used by 38.9% of listings.
- There's a relatively balanced mix between guest-friendly (61.1%) and stricter (38.9%) policies, offering choices for different guest needs.
Recommendations for Hosts
- Consider adopting a Flexible policy to align with the 38.9% market standard in Rockford Township.
- Regularly review your cancellation policy against competitors and market demand shifts in Rockford Township.
Rockford Township STR Booking Lead Time Analysis (2025)
Average Booking Lead Time by Month
Booking Lead Time Insights for Rockford Township
- The overall average booking lead time for vacation rentals in Rockford Township is 38 days.
- Guests book furthest in advance for stays during July (average 68 days), likely coinciding with peak travel demand or local events.
- The shortest booking windows occur for stays in January (average 11 days), indicating more last-minute travel plans during this time.
- Seasonally, Summer (65 days avg.) sees the longest lead times, while Winter (15 days avg.) has the shortest, reflecting typical travel planning cycles.
Recommendations for Hosts
- Use the overall average lead time (38 days) as a baseline for your pricing and availability strategy in Rockford Township.
- For July stays, consider implementing length-of-stay discounts or slightly higher rates for bookings made less than 68 days out to capitalize on advance planning.
- During January, focus on last-minute booking availability and promotions, as guests book with very short notice (11 days avg.).
- Target marketing efforts for the Summer season well in advance (at least 65 days) to capture early planners.
- Monitor your own booking lead times against these Rockford Township averages to identify opportunities for dynamic pricing adjustments.
Popular & Essential Airbnb Amenities in Rockford Township (2025)
Amenity Prevalence
Amenity Insights for Rockford Township
- Essential amenities in Rockford Township that guests expect include: Carbon monoxide alarm, Free parking on premises, TV, Coffee maker, Smoke alarm, Air conditioning, Heating. Lacking these (any) could significantly impact bookings.
- Popular amenities like Bed linens, Dishes and silverware, Hot water are common but not universal. Offering these can provide a competitive edge.
Recommendations for Hosts
- Ensure your listing includes all essential amenities for Rockford Township: Carbon monoxide alarm, Free parking on premises, TV, Coffee maker, Smoke alarm, Air conditioning, Heating.
- Consider adding popular differentiators like Bed linens or Dishes and silverware to increase appeal.
- Highlight unique or less common amenities you offer (e.g., hot tub, dedicated workspace, EV charger) in your listing description and photos.
- Regularly check competitor amenities in Rockford Township to stay competitive.
Rockford Township Airbnb Guest Demographics & Profile Analysis (2025)
Guest Profile Summary for Rockford Township
- The typical guest profile for Airbnb in Rockford Township consists of primarily domestic travelers (97%), often arriving from nearby Rockford, typically belonging to the Post-2000s (Gen Z/Alpha) group (50%), primarily speaking English or Spanish.
- Domestic travelers account for 96.8% of guests.
- Key international markets include United States (96.8%) and United Kingdom (0.6%).
- Top languages spoken are English (69.5%) followed by Spanish (13.3%).
- A significant demographic segment is the Post-2000s (Gen Z/Alpha) group, representing 50% of guests.
Recommendations for Hosts
- Target domestic marketing efforts towards travelers from Rockford and Milwaukee.
- Tailor amenities and listing descriptions to appeal to the dominant Post-2000s (Gen Z/Alpha) demographic (e.g., highlight fast WiFi, smart home features, local guides).
- Highlight unique local experiences or amenities relevant to the primary guest profile.
- Consider seasonal promotions aligned with peak travel times for key origin markets.
Nearby Short-Term Rental Market Comparison
How does the Rockford Township Airbnb market stack up against its neighbors? Compare key performance metrics like average monthly revenue, ADR, and occupancy rates in surrounding areas to understand the broader regional STR landscape.
| Market | Active Properties | Monthly Revenue | Daily Rate | Avg. Occupancy |
|---|---|---|---|---|
| Town of Sugar Creek | 17 | $9,953 | $675.57 | 53% |
| Monona | 31 | $6,437 | $602.80 | 51% |
| Twin Lakes | 34 | $5,893 | $501.53 | 44% |
| Town of Richmond | 10 | $5,813 | $407.44 | 44% |
| Town of Germantown | 70 | $4,807 | $500.50 | 37% |
| Lake Geneva | 187 | $4,777 | $431.93 | 41% |
| McHenry | 32 | $4,705 | $453.60 | 43% |
| Town of Marion | 47 | $4,647 | $349.40 | 44% |
| Town of Geneva | 67 | $4,219 | $409.85 | 40% |
| Tichigan | 13 | $4,176 | $419.83 | 43% |