s'Algar Airbnb Market Analysis 2025: Short Term Rental Data & Vacation Rental Statistics in Balearic Islands, Spain
Is Airbnb profitable in s'Algar in 2025? Explore comprehensive Airbnb analytics for s'Algar, Balearic Islands, Spain to uncover income potential. This 2025 STR market report for s'Algar, based on AirROI data from April 2024 to March 2025, reveals key trends in the niche market of 19 active listings.
Whether you're considering an Airbnb investment in s'Algar, optimizing your existing vacation rental, or exploring rental arbitrage opportunities, understanding the s'Algar Airbnb data is crucial. Navigating the high regulation landscape is key to maximizing your short term rental income potential. Let's dive into the specifics.
Key s'Algar Airbnb Performance Metrics Overview
Monthly Airbnb Revenue Variations & Income Potential in s'Algar (2025)
Understanding the monthly revenue variations for Airbnb listings in s'Algar is key to maximizing your short term rental income potential. Seasonality significantly impacts earnings. Our analysis, based on data from the past 12 months, shows that the peak revenue month for STRs in s'Algar is typically January, while March often presents the lowest earnings, highlighting opportunities for strategic pricing adjustments during shoulder and low seasons. Explore the typical Airbnb income in s'Algar across different performance tiers:
- Best-in-class properties (Top 10%) achieve $5,210+ monthly, often utilizing dynamic pricing and superior guest experiences.
- Strong performing properties (Top 25%) earn $3,798 or more, indicating effective management and desirable locations/amenities.
- Typical properties (Median) generate around $2,660 per month, representing the average market performance.
- Entry-level properties (Bottom 25%) see earnings around $2,067, often with potential for optimization.
Average Monthly Airbnb Earnings Trend in s'Algar
s'Algar Airbnb Occupancy Rate Trends (2025)
Maximize your bookings by understanding the s'Algar STR occupancy trends. Seasonal demand shifts significantly influence how often properties are booked. Typically, Januarysees the highest demand (peak season occupancy), while March experiences the lowest (low season). Effective strategies, like adjusting minimum stays or offering promotions, can boost occupancy during slower periods. Here's how different property tiers perform in s'Algar:
- Best-in-class properties (Top 10%) achieve 72%+ occupancy, indicating high desirability and potentially optimized availability.
- Strong performing properties (Top 25%) maintain 62% or higher occupancy, suggesting good market fit and guest satisfaction.
- Typical properties (Median) have an occupancy rate around 47%.
- Entry-level properties (Bottom 25%) average 32% occupancy, potentially facing higher vacancy.
Average Monthly Occupancy Rate Trend in s'Algar
Average Daily Rate (ADR) Airbnb Trends in s'Algar (2025)
Effective short term rental pricing strategy in s'Algar involves understanding monthly ADR fluctuations. The Average Daily Rate (ADR) for Airbnb in s'Algar typically peaks in August and dips lowest during December. Leveraging Airbnb dynamic pricing tools or strategies based on this seasonality can significantly boost revenue. Here's a look at the typical nightly rates achieved:
- Best-in-class properties (Top 10%) command rates of $422+ per night, often due to premium features or locations.
- Strong performing properties (Top 25%) achieve nightly rates of $317 or more.
- Typical properties (Median) charge around $180 per night.
- Entry-level properties (Bottom 25%) earn around $138 per night.
Average Daily Rate (ADR) Trend by Month in s'Algar
Get Live s'Algar Market Intelligence 👇

Explore Real-time Analytics
Airbnb Seasonality Analysis & Trends in s'Algar (2025)
Peak Season (January, August, July)
- Revenue averages $5,930 per month
- Occupancy rates average 76.1%
- Daily rates average $281
Shoulder Season
- Revenue averages $2,818 per month
- Occupancy maintains around 45.2%
- Daily rates hold near $275
Low Season (March, November, December)
- Revenue drops to average $914 per month
- Occupancy decreases to average 21.9%
- Daily rates adjust to average $180
Seasonality Insights for s'Algar
- The Airbnb seasonality in s'Algar shows highly seasonal trends requiring careful strategy. While the sections above show seasonal averages, it's also insightful to look at the extremes:
- During the high season, the absolute peak month showcases s'Algar's highest earning potential, with monthly revenues capable of climbing to $6,093, occupancy reaching a high of 96.8%, and ADRs peaking at $337.
- Conversely, the slowest single month of the year, typically falling within the low season, marks the market's lowest point. In this month, revenue might dip to $842, occupancy could drop to 16.1%, and ADRs may adjust down to $177.
- Understanding both the seasonal averages and these monthly peaks and troughs in revenue, occupancy, and ADR is crucial for maximizing your Airbnb profit potential in s'Algar.
Seasonal Strategies for Maximizing Profit
- Peak Season: Maximize revenue through premium pricing and potentially longer minimum stays. Ensure high availability.
- Low Season: Offer competitive pricing, special promotions (e.g., extended stay discounts), and flexible cancellation policies. Target off-season travelers like remote workers or budget-conscious guests.
- Shoulder Seasons: Implement dynamic pricing that balances peak and low rates. Target weekend travelers or specific events. Offer slightly more flexible terms than peak season.
- Regularly analyze your own performance against these s'Algar seasonality benchmarks and adjust your pricing and availability strategy accordingly.
Best Areas for Airbnb Investment in s'Algar (2025)
Exploring the top neighborhoods for short-term rentals in s'Algar? This section highlights key areas, outlining why they are attractive for hosts and guests, along with notable local attractions. Consider these locations based on your target guest profile and investment strategy.
| Neighborhood / Area | Why Host Here? (Target Guests & Appeal) | Key Attractions & Landmarks |
|---|---|---|
| Es Castell | Charming fishing village with beautiful coastal views and historic architecture. Close to the capital Mahón, offering insights into local culture and a relaxed atmosphere. | Mother of God Church, Fort Saint Philip, Cala Pica Beach, Castell de Sant Felip |
| Mahon | The capital of Menorca with a rich history and vibrant local markets. Popular for its harbor, nightlife, and cultural activities, making it a hotspot for tourists. | Mahon Harbor, Mercat del Claustre del Carme, La Mola Fortress, Centro Histórico de Mahón |
| Cala en Porter | Family-friendly beach area known for its clear waters and natural beauty. Ideal for vacationers looking for a relaxing seaside escape. | Cala en Porter Beach, Cova d'en Xoroi, Son Bou, Alaior |
| Alaior | A traditional Menorcan town with local charm and authenticity. Offers a quieter atmosphere while still being close to popular attractions. | Torre d'en Galmés, Alaior Castle, Museo de Menorca |
| Fornells | Picturesque fishing village famous for its seafood and stunning bay. Popular with visitors for its beautiful scenery and water sports activities. | Fornells Beach, La Concha Beach, Cabo de Cavallería, Water sports facilities |
| Cala Galdana | Known for its picturesque bay and family-friendly beach. Popular for relaxation and water activities. | Cala Galdana Beach, Annex Beach, Cala Mitjana, Camí de Cavalls |
| Ciutadella | Historic town to the west of Menorca, known for its charming old town and vibrant nightlife. | Ciutadella Cathedral, Port of Ciutadella, Naveta d'Es Tudons, Local nightlife venues |
| Sant Lluis | A quiet village known for its beautiful homes and Mediterranean architecture. Offers a peaceful retreat while being near the coast. | Binibeca Beach, Cala Binibèquer, Sant Lluis Town Centre |
Understanding Airbnb License Requirements & STR Laws in s'Algar (2025)
Yes, s'Algar, Balearic Islands, Spain enforces high STR regulations. Obtaining a license and ensuring compliance is almost certainly required according to current 2025 STR laws. Always verify the latest short term rental regulations and Airbnb license requirements directly with local government authorities for s'Algar to ensure full compliance before hosting.
(Source: AirROI data, 2025, based on 68% licensed listings)
Top Performing Airbnb Properties in s'Algar (2025)
Benchmark your potential! Explore examples of top-performing Airbnb properties in s'Algarbased on Trailing Twelve Month (TTM) revenue. Analyze their characteristics, revenue, occupancy rate, and ADR to understand what drives success in this market.
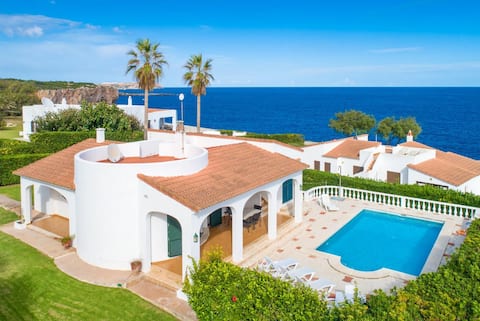
Villa Caprice
Entire Place • 3 bedrooms
BEAUTIFUL TOWNHOUSE WITH NICE OCEAN VIEW
Entire Place • 2 bedrooms

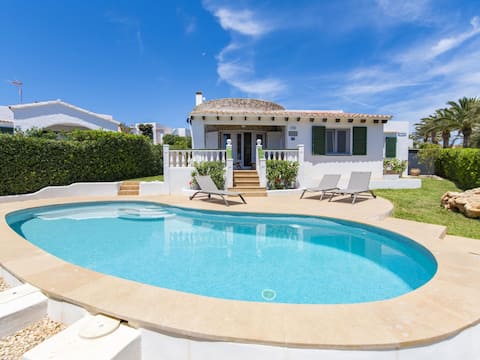
Cheerful Seaside Cottage
Entire Place • 3 bedrooms
El Nido Escape to Paradise
Entire Place • 3 bedrooms

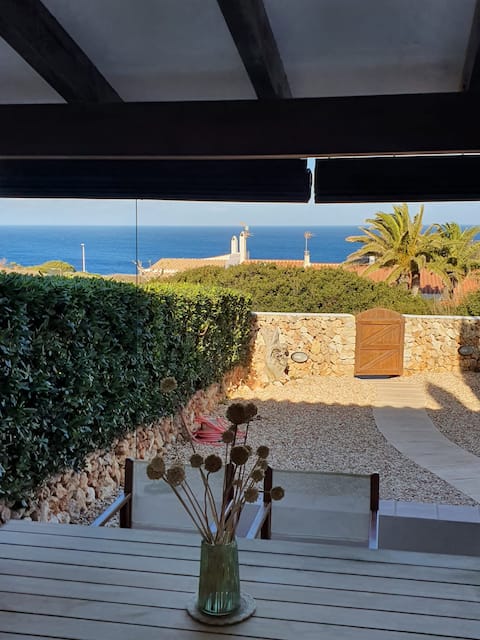
Apartamento Adosado S'algar - First Line of Sea
Entire Place • 2 bedrooms

Ideal for families in the south coast
Entire Place • 3 bedrooms
Note: Performance varies based on location, size, amenities, seasonality, and management quality. Data reflects the past 12 months.
Top Performing Airbnb Hosts in s'Algar (2025)
Learn from the best! This table showcases top-performing Airbnb hosts in s'Algar based on the number of properties managed and estimated total revenue over the past year. Analyze their scale and performance metrics.
| Host Name | Properties | Grossing Revenue | Stay Reviews | Avg Rating |
|---|---|---|---|---|
| OrfilaSternal | 8 | $159,915 | 113 | 3.95/5.0 |
| Richard | 1 | $48,586 | 11 | 4.73/5.0 |
| Xavier | 1 | $43,138 | 23 | 4.87/5.0 |
| Noelia | 2 | $42,141 | 252 | 4.75/5.0 |
| Carlos | 1 | $41,378 | 74 | 4.92/5.0 |
| Arturo | 1 | $30,472 | 86 | 4.76/5.0 |
| Santi | 1 | $22,232 | 24 | 4.83/5.0 |
| Victor | 1 | $19,953 | 71 | 4.89/5.0 |
| Host #50350088 | 1 | $16,378 | 1 | 0.00/5.0 |
| Naranjos Resort Menorca | 1 | $7,545 | 63 | 4.73/5.0 |
Analyzing the strategies of top hosts, such as their property selection, pricing, and guest communication, can offer valuable lessons for optimizing your own Airbnb operations in s'Algar.
Dive Deeper: Advanced s'Algar STR Market Data (2025)
Ready to unlock more insights? AirROI provides access to advanced metrics and comprehensive Airbnb data for s'Algar. Explore detailed analytics beyond this report to refine your investment strategy, optimize pricing, and maximize your vacation rental profits.
Explore Advanced Metricss'Algar Short-Term Rental Market Composition (2025): Property & Room Types
Room Type Distribution
Property Type Distribution
Market Composition Insights for s'Algar
- The s'Algar Airbnb market composition is heavily skewed towards Entire Home/Apt listings, which make up 100% of the 19 active rentals. This indicates strong guest preference for privacy and space.
- Looking at the property type distribution in s'Algar, Apartment/Condo properties are the most common (68.4%), reflecting the local real estate landscape.
- Houses represent a significant 31.6% portion, catering likely to families or larger groups.
s'Algar Airbnb Room Capacity Analysis (2025): Bedroom Distribution
Distribution of Listings by Number of Bedrooms
Room Capacity Insights for s'Algar
- The dominant room capacity in s'Algar is 2 bedrooms listings, making up 42.1% of the market. This suggests a strong demand for properties suitable for couples or solo travelers.
- Together, 2 bedrooms and 3 bedrooms properties represent 73.7% of the active Airbnb listings in s'Algar, indicating a high concentration in these sizes.
- A significant 42.1% of listings offer 3+ bedrooms, catering to larger groups and families seeking more space in s'Algar.
s'Algar Vacation Rental Guest Capacity Trends (2025)
Distribution of Listings by Guest Capacity
Guest Capacity Insights for s'Algar
- The most common guest capacity trend in s'Algar vacation rentals is listings accommodating 4 guests (31.6%). This suggests the primary traveler segment is likely small families or groups.
- Properties designed for 4 guests and 6 guests dominate the s'Algar STR market, accounting for 52.7% of listings.
- 31.6% of properties accommodate 6+ guests, serving the market segment for larger families or group travel in s'Algar.
- On average, properties in s'Algar are equipped to host 4.7 guests.
s'Algar Airbnb Booking Patterns (2025): Available vs. Booked Days
Available Days Distribution
Booked Days Distribution
Booking Pattern Insights for s'Algar
- The most common availability pattern in s'Algar falls within the 181-270 days range, representing 52.6% of listings. This suggests many properties have significant open periods on their calendars.
- Approximately 89.4% of listings show high availability (181+ days open annually), indicating potential for increased bookings or specific owner usage patterns.
- For booked days, the 91-180 days range is most frequent in s'Algar (52.6%), reflecting common guest stay durations or potential owner blocking patterns.
- A notable 10.5% of properties secure long booking periods (181+ days booked per year), highlighting successful long-term rental strategies or significant owner usage.
s'Algar Airbnb Minimum Stay Requirements Analysis
Distribution of Listings by Minimum Night Requirement
1 Night
1 listings
5.3% of total
2 Nights
2 listings
10.5% of total
3 Nights
4 listings
21.1% of total
4-6 Nights
7 listings
36.8% of total
7-29 Nights
3 listings
15.8% of total
30+ Nights
2 listings
10.5% of total
Key Insights
- The most prevalent minimum stay requirement in s'Algar is 4-6 Nights, adopted by 36.8% of listings. This highlights the market's preference for longer commitments.
- Very short stays (1-2 nights) are less common (15.8%), suggesting hosts prefer slightly longer bookings to optimize turnover.
- A significant segment (10.5%) caters to monthly stays (30+ nights) in s'Algar, pointing to opportunities in the extended-stay market.
Recommendations
- Align with the market by considering a 4-6 Nights minimum stay, as 36.8% of s'Algar hosts use this setting.
- If feasible, allowing 1-night stays, especially midweek or during low season, could capture last-minute bookings, as only 5.3% currently do.
- Explore offering discounts for stays of 30+ nights to attract the 10.5% of the market seeking extended stays.
- Adjust minimum nights based on seasonality – potentially shorter during low season and longer during peak demand periods in s'Algar.
s'Algar Airbnb Cancellation Policy Trends Analysis (2025)
Super Strict 30 Days
1 listings
6.3% of total
Moderate
7 listings
43.8% of total
Firm
3 listings
18.8% of total
Strict
5 listings
31.3% of total
Cancellation Policy Insights for s'Algar
- The prevailing Airbnb cancellation policy trend in s'Algar is Moderate, used by 43.8% of listings.
- A majority (50.1%) of hosts in s'Algar utilize Firm or Strict policies, indicating a market where hosts prioritize booking security.
Recommendations for Hosts
- Consider adopting a Moderate policy to align with the 43.8% market standard in s'Algar.
- With 31.3% using Strict terms, this is a viable option in s'Algar, particularly for high-value properties or during peak demand periods.
- Regularly review your cancellation policy against competitors and market demand shifts in s'Algar.
s'Algar STR Booking Lead Time Analysis (2025)
Average Booking Lead Time by Month
Booking Lead Time Insights for s'Algar
- The overall average booking lead time for vacation rentals in s'Algar is 88 days.
- Guests book furthest in advance for stays during January (average 328 days), likely coinciding with peak travel demand or local events.
- The shortest booking windows occur for stays in March (average 0 days), indicating more last-minute travel plans during this time.
- Seasonally, Winter (244 days avg.) sees the longest lead times, while Fall (58 days avg.) has the shortest, reflecting typical travel planning cycles.
Recommendations for Hosts
- Use the overall average lead time (88 days) as a baseline for your pricing and availability strategy in s'Algar.
- For January stays, consider implementing length-of-stay discounts or slightly higher rates for bookings made less than 328 days out to capitalize on advance planning.
- During March, focus on last-minute booking availability and promotions, as guests book with very short notice (0 days avg.).
- Target marketing efforts for the Winter season well in advance (at least 244 days) to capture early planners.
- Monitor your own booking lead times against these s'Algar averages to identify opportunities for dynamic pricing adjustments.
Popular & Essential Airbnb Amenities in s'Algar (2025)
Amenity Prevalence
Amenity Insights for s'Algar
- Essential amenities in s'Algar that guests expect include: Wifi. Lacking these (this) could significantly impact bookings.
- Popular amenities like Kitchen, Essentials, Refrigerator are common but not universal. Offering these can provide a competitive edge.
Recommendations for Hosts
- Ensure your listing includes all essential amenities for s'Algar: Wifi.
- Consider adding popular differentiators like Kitchen or Essentials to increase appeal.
- Highlight unique or less common amenities you offer (e.g., hot tub, dedicated workspace, EV charger) in your listing description and photos.
- Regularly check competitor amenities in s'Algar to stay competitive.
s'Algar Airbnb Guest Demographics & Profile Analysis (2025)
Guest Profile Summary for s'Algar
- The typical guest profile for Airbnb in s'Algar consists of predominantly international visitors (80%), with top international origins including Spain, typically belonging to the Post-2000s (Gen Z/Alpha) group (50%), primarily speaking English or French.
- Domestic travelers account for 19.7% of guests.
- Key international markets include France (48%) and Spain (19.7%).
- Top languages spoken are English (33.8%) followed by French (26.9%).
- A significant demographic segment is the Post-2000s (Gen Z/Alpha) group, representing 50% of guests.
Recommendations for Hosts
- Focus marketing internationally, particularly towards travelers from Spain.
- Tailor amenities and listing descriptions to appeal to the dominant Post-2000s (Gen Z/Alpha) demographic (e.g., highlight fast WiFi, smart home features, local guides).
- Highlight unique local experiences or amenities relevant to the primary guest profile.
- Consider seasonal promotions aligned with peak travel times for key origin markets.
Nearby Short-Term Rental Market Comparison
How does the s'Algar Airbnb market stack up against its neighbors? Compare key performance metrics like average monthly revenue, ADR, and occupancy rates in surrounding areas to understand the broader regional STR landscape.
| Market | Active Properties | Monthly Revenue | Daily Rate | Avg. Occupancy |
|---|---|---|---|---|
| Sant Joan | 27 | $4,768 | $612.88 | 54% |
| Vilafranca de Bonany | 31 | $4,516 | $577.34 | 47% |
| Ariany | 65 | $4,418 | $555.49 | 43% |
| Felanitx | 474 | $4,158 | $511.27 | 48% |
| Santanyí | 775 | $4,051 | $460.87 | 52% |
| Son Servera | 196 | $4,033 | $533.19 | 47% |
| Porreres | 60 | $3,859 | $413.77 | 50% |
| Llubí | 76 | $3,763 | $405.22 | 48% |
| Muro | 273 | $3,759 | $412.01 | 49% |
| Alcúdia | 1,220 | $3,720 | $369.74 | 51% |