Velaux Airbnb Market Analysis 2025: Short Term Rental Data & Vacation Rental Statistics in Provence-Alpes-Côte d'Azur, France
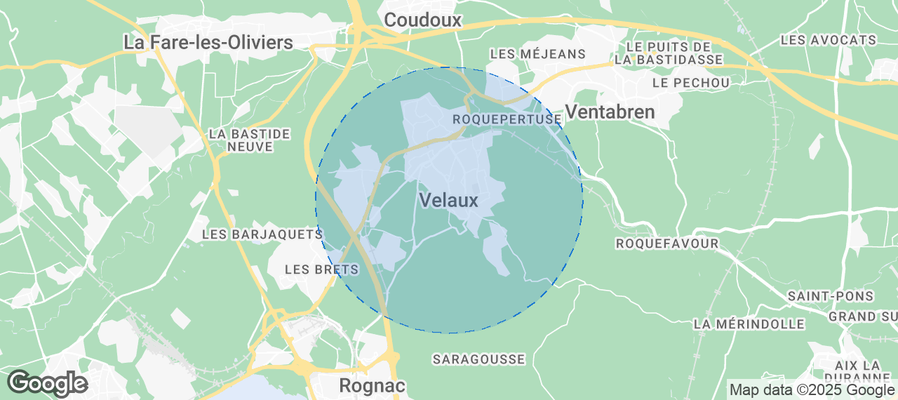
Is Airbnb profitable in Velaux in 2025? Explore comprehensive Airbnb analytics for Velaux, Provence-Alpes-Côte d'Azur, France to uncover income potential. This 2025 STR market report for Velaux, based on AirROI data from April 2024 to March 2025, reveals key trends in the niche market of 77 active listings.
Whether you're considering an Airbnb investment in Velaux, optimizing your existing vacation rental, or exploring rental arbitrage opportunities, understanding the Velaux Airbnb data is crucial. Leveraging the low regulation environment is key to maximizing your short term rental income potential. Let's dive into the specifics.
Key Velaux Airbnb Performance Metrics Overview
Monthly Airbnb Revenue Variations & Income Potential in Velaux (2025)
Understanding the monthly revenue variations for Airbnb listings in Velaux is key to maximizing your short term rental income potential. Seasonality significantly impacts earnings. Our analysis, based on data from the past 12 months, shows that the peak revenue month for STRs in Velaux is typically July, while March often presents the lowest earnings, highlighting opportunities for strategic pricing adjustments during shoulder and low seasons. Explore the typical Airbnb income in Velaux across different performance tiers:
- Best-in-class properties (Top 10%) achieve $4,762+ monthly, often utilizing dynamic pricing and superior guest experiences.
- Strong performing properties (Top 25%) earn $2,376 or more, indicating effective management and desirable locations/amenities.
- Typical properties (Median) generate around $1,183 per month, representing the average market performance.
- Entry-level properties (Bottom 25%) see earnings around $531, often with potential for optimization.
Average Monthly Airbnb Earnings Trend in Velaux
Velaux Airbnb Occupancy Rate Trends (2025)
Maximize your bookings by understanding the Velaux STR occupancy trends. Seasonal demand shifts significantly influence how often properties are booked. Typically, Augustsees the highest demand (peak season occupancy), while March experiences the lowest (low season). Effective strategies, like adjusting minimum stays or offering promotions, can boost occupancy during slower periods. Here's how different property tiers perform in Velaux:
- Best-in-class properties (Top 10%) achieve 75%+ occupancy, indicating high desirability and potentially optimized availability.
- Strong performing properties (Top 25%) maintain 53% or higher occupancy, suggesting good market fit and guest satisfaction.
- Typical properties (Median) have an occupancy rate around 31%.
- Entry-level properties (Bottom 25%) average 15% occupancy, potentially facing higher vacancy.
Average Monthly Occupancy Rate Trend in Velaux
Average Daily Rate (ADR) Airbnb Trends in Velaux (2025)
Effective short term rental pricing strategy in Velaux involves understanding monthly ADR fluctuations. The Average Daily Rate (ADR) for Airbnb in Velaux typically peaks in July and dips lowest during January. Leveraging Airbnb dynamic pricing tools or strategies based on this seasonality can significantly boost revenue. Here's a look at the typical nightly rates achieved:
- Best-in-class properties (Top 10%) command rates of $292+ per night, often due to premium features or locations.
- Strong performing properties (Top 25%) achieve nightly rates of $204 or more.
- Typical properties (Median) charge around $135 per night.
- Entry-level properties (Bottom 25%) earn around $88 per night.
Average Daily Rate (ADR) Trend by Month in Velaux
Get Live Velaux Market Intelligence 👇
Explore Real-time Analytics
Airbnb Seasonality Analysis & Trends in Velaux (2025)
Peak Season (July, August, June)
- Revenue averages $3,305 per month
- Occupancy rates average 48.3%
- Daily rates average $187
Shoulder Season
- Revenue averages $2,004 per month
- Occupancy maintains around 35.0%
- Daily rates hold near $178
Low Season (January, February, March)
- Revenue drops to average $1,095 per month
- Occupancy decreases to average 26.1%
- Daily rates adjust to average $163
Seasonality Insights for Velaux
- The Airbnb seasonality in Velaux shows highly seasonal trends requiring careful strategy. While the sections above show seasonal averages, it's also insightful to look at the extremes:
- During the high season, the absolute peak month showcases Velaux's highest earning potential, with monthly revenues capable of climbing to $3,577, occupancy reaching a high of 59.4%, and ADRs peaking at $189.
- Conversely, the slowest single month of the year, typically falling within the low season, marks the market's lowest point. In this month, revenue might dip to $877, occupancy could drop to 23.8%, and ADRs may adjust down to $162.
- Understanding both the seasonal averages and these monthly peaks and troughs in revenue, occupancy, and ADR is crucial for maximizing your Airbnb profit potential in Velaux.
Seasonal Strategies for Maximizing Profit
- Peak Season: Maximize revenue through premium pricing and potentially longer minimum stays. Ensure high availability.
- Low Season: Offer competitive pricing, special promotions (e.g., extended stay discounts), and flexible cancellation policies. Target off-season travelers like remote workers or budget-conscious guests.
- Shoulder Seasons: Implement dynamic pricing that balances peak and low rates. Target weekend travelers or specific events. Offer slightly more flexible terms than peak season.
- Regularly analyze your own performance against these Velaux seasonality benchmarks and adjust your pricing and availability strategy accordingly.
Best Areas for Airbnb Investment in Velaux (2025)
Exploring the top neighborhoods for short-term rentals in Velaux? This section highlights key areas, outlining why they are attractive for hosts and guests, along with notable local attractions. Consider these locations based on your target guest profile and investment strategy.
| Neighborhood / Area | Why Host Here? (Target Guests & Appeal) | Key Attractions & Landmarks |
|---|---|---|
| Velaux Village | Charming Provençal village with traditional architecture and a peaceful atmosphere. Ideal for visitors wanting a quiet retreat close to nature and vineyards. | Local markets, Château de Velaux, Provençal vineyards, Nearby hiking trails, Historic sites and churches |
| Eguilles | A picturesque village just a short drive from Velaux, known for its art and cultural events. Attracts tourists interested in local culture and cuisine. | Art exhibitions, Culinary festivals, Outdoor markets, Lavender fields, Historic architecture |
| Pertuis | A vibrant town located nearby with a rich history and access to scenic countryside. Popular for families and tourists looking for local dining and shopping options. | Aqueduc de la Tracole, Château de la Barben, Market square, Nearby wineries, Parks and recreation areas |
| Aix-en-Provence | Famous for its art and culture, this city is known for its festivals and beautiful architecture. Highly sought after by tourists and travelers year-round. | Cours Mirabeau, Saint-Sauveur Cathedral, Aix-en-Provence markets, Festival d’Aix, Museums and galleries |
| Salon-de-Provence | Rich in history and famous for its cultural heritage, this town features a blend of history and modern-day amenities, making it attractive to diverse tourists. | Château de l'Empéri, Nostang Academy of Fine Arts, Historic town center, Markets, Fontaine Moussue |
| Marseille | A lively port city with diverse cultures, excellent dining, and rich history. A major attraction for both domestic and international tourists. | Old Port of Marseille, Basilique Notre-Dame de la Garde, Calanques National Park, MuCEM, Historic neighborhoods |
| Cassis | Picturesque coastal town known for its cliffs and beautiful beach. Perfect for tourists seeking both adventure and relaxation by the sea. | Calanques National Park, Cassis beaches, Wine tasting tours, Charming waterfront, Scenic boat trips |
| La Ciotat | Known for its beaches and vibrant old town, it's a perfect getaway for those seeking sun and sea, just a short distance from Velaux. | Calanque de Figuerolles, Old Port, Beaches, Cultural festivals, Cinemas and theaters |
Understanding Airbnb License Requirements & STR Laws in Velaux (2025)
While Velaux, Provence-Alpes-Côte d'Azur, France currently shows low STR regulations, specific Airbnb license requirements might still exist or change. Always verify the latest short term rental regulations and Airbnb license requirements directly with local government authorities for Velaux to ensure full compliance before hosting.
(Source: AirROI data, 2025, based on 4% licensed listings)
Top Performing Airbnb Properties in Velaux (2025)
Benchmark your potential! Explore examples of top-performing Airbnb properties in Velauxbased on Trailing Twelve Month (TTM) revenue. Analyze their characteristics, revenue, occupancy rate, and ADR to understand what drives success in this market.
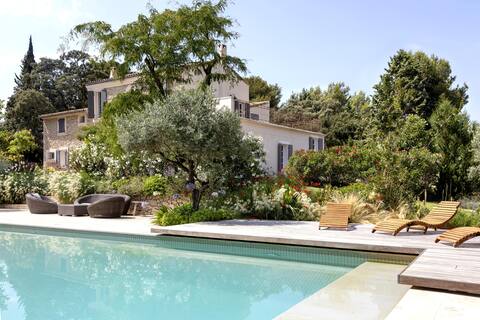
Beautiful villa in Provence with garden and pool
Entire Place • 7 bedrooms
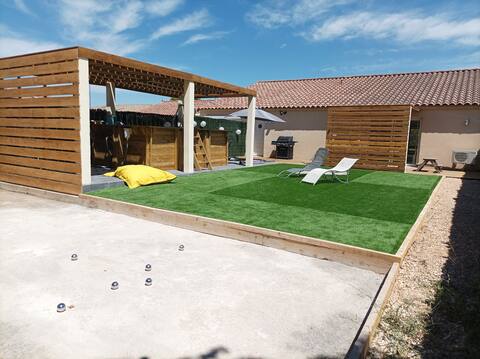
Villa with conviviality between families/friends
Entire Place • 5 bedrooms
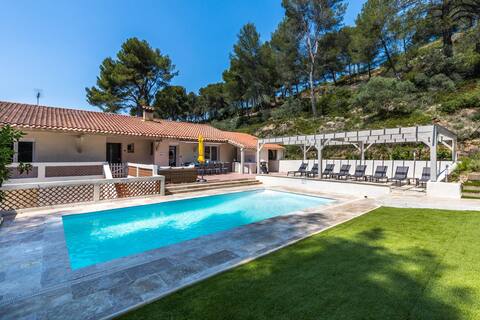
Villa Les Cigales sleeps 10 pool
Entire Place • 4 bedrooms

Provencal house on the heights of Velaux
Entire Place • 4 bedrooms
Tine's House
Entire Place • 4 bedrooms

Villa Liwa en Provence
Entire Place • 4 bedrooms
Note: Performance varies based on location, size, amenities, seasonality, and management quality. Data reflects the past 12 months.
Top Performing Airbnb Hosts in Velaux (2025)
Learn from the best! This table showcases top-performing Airbnb hosts in Velaux based on the number of properties managed and estimated total revenue over the past year. Analyze their scale and performance metrics.
| Host Name | Properties | Grossing Revenue | Stay Reviews | Avg Rating |
|---|---|---|---|---|
| Vincent | 1 | $137,872 | 25 | 4.96/5.0 |
| Sylvain | 1 | $119,500 | 47 | 4.83/5.0 |
| Jean-Pierre | 2 | $113,309 | 42 | 4.89/5.0 |
| Jenny | 2 | $64,493 | 29 | 4.71/5.0 |
| Eva | 1 | $56,224 | 23 | 4.87/5.0 |
| Valerie | 1 | $48,050 | 3 | 5.00/5.0 |
| Dominique | 2 | $46,737 | 104 | 4.78/5.0 |
| Isabelle | 2 | $46,159 | 27 | 5.00/5.0 |
| Anne Marie | 3 | $38,955 | 45 | 4.69/5.0 |
| Albert & Karine | 1 | $37,732 | 30 | 4.67/5.0 |
Analyzing the strategies of top hosts, such as their property selection, pricing, and guest communication, can offer valuable lessons for optimizing your own Airbnb operations in Velaux.
Dive Deeper: Advanced Velaux STR Market Data (2025)
Ready to unlock more insights? AirROI provides access to advanced metrics and comprehensive Airbnb data for Velaux. Explore detailed analytics beyond this report to refine your investment strategy, optimize pricing, and maximize your vacation rental profits.
Explore Advanced MetricsVelaux Short-Term Rental Market Composition (2025): Property & Room Types
Room Type Distribution
Property Type Distribution
Market Composition Insights for Velaux
- The Velaux Airbnb market composition is heavily skewed towards Entire Home/Apt listings, which make up 89.6% of the 77 active rentals. This indicates strong guest preference for privacy and space.
- Looking at the property type distribution in Velaux, House properties are the most common (59.7%), reflecting the local real estate landscape.
- Houses represent a significant 59.7% portion, catering likely to families or larger groups.
- The presence of 13% Hotel/Boutique listings indicates integration with traditional hospitality.
- Smaller segments like others (combined 1.3%) offer potential for unique stay experiences.
Velaux Airbnb Room Capacity Analysis (2025): Bedroom Distribution
Distribution of Listings by Number of Bedrooms
Room Capacity Insights for Velaux
- The dominant room capacity in Velaux is 1 bedroom listings, making up 39% of the market. This suggests a strong demand for properties suitable for couples or solo travelers.
- Together, 1 bedroom and 4 bedrooms properties represent 58.5% of the active Airbnb listings in Velaux, indicating a high concentration in these sizes.
- A significant 36.4% of listings offer 3+ bedrooms, catering to larger groups and families seeking more space in Velaux.
Velaux Vacation Rental Guest Capacity Trends (2025)
Distribution of Listings by Guest Capacity
Guest Capacity Insights for Velaux
- The most common guest capacity trend in Velaux vacation rentals is listings accommodating 2 guests (27.3%). This suggests the primary traveler segment is likely couples or solo travelers.
- Properties designed for 2 guests and 4 guests dominate the Velaux STR market, accounting for 48.1% of listings.
- 31.2% of properties accommodate 6+ guests, serving the market segment for larger families or group travel in Velaux.
- On average, properties in Velaux are equipped to host 4.3 guests.
Velaux Airbnb Booking Patterns (2025): Available vs. Booked Days
Available Days Distribution
Booked Days Distribution
Booking Pattern Insights for Velaux
- The most common availability pattern in Velaux falls within the 271-366 days range, representing 57.1% of listings. This suggests many properties have significant open periods on their calendars.
- Approximately 81.8% of listings show high availability (181+ days open annually), indicating potential for increased bookings or specific owner usage patterns.
- For booked days, the 31-90 days range is most frequent in Velaux (41.6%), reflecting common guest stay durations or potential owner blocking patterns.
- A notable 18.2% of properties secure long booking periods (181+ days booked per year), highlighting successful long-term rental strategies or significant owner usage.
Velaux Airbnb Minimum Stay Requirements Analysis
Distribution of Listings by Minimum Night Requirement
1 Night
21 listings
28% of total
2 Nights
17 listings
22.7% of total
3 Nights
7 listings
9.3% of total
4-6 Nights
16 listings
21.3% of total
7-29 Nights
3 listings
4% of total
30+ Nights
11 listings
14.7% of total
Key Insights
- The most prevalent minimum stay requirement in Velaux is 1 Night, adopted by 28% of listings. This highlights the market's preference for shorter, flexible bookings.
- A significant segment (14.7%) caters to monthly stays (30+ nights) in Velaux, pointing to opportunities in the extended-stay market.
Recommendations
- Align with the market by considering a 1 Night minimum stay, as 28% of Velaux hosts use this setting.
- If feasible, allowing 1-night stays, especially midweek or during low season, could capture last-minute bookings, as only 28% currently do.
- Explore offering discounts for stays of 30+ nights to attract the 14.7% of the market seeking extended stays.
- Adjust minimum nights based on seasonality – potentially shorter during low season and longer during peak demand periods in Velaux.
Velaux Airbnb Cancellation Policy Trends Analysis (2025)
Flexible
22 listings
32.4% of total
Moderate
26 listings
38.2% of total
Firm
12 listings
17.6% of total
Strict
8 listings
11.8% of total
Cancellation Policy Insights for Velaux
- The prevailing Airbnb cancellation policy trend in Velaux is Moderate, used by 38.2% of listings.
- The market strongly favors guest-friendly terms, with 70.6% of listings offering Flexible or Moderate policies. This suggests guests in Velaux may expect booking flexibility.
Recommendations for Hosts
- Consider adopting a Moderate policy to align with the 38.2% market standard in Velaux.
- Using a Strict policy might deter some guests, as only 11.8% of listings use it. Evaluate if potential revenue protection outweighs possible lower booking rates.
- Regularly review your cancellation policy against competitors and market demand shifts in Velaux.
Velaux STR Booking Lead Time Analysis (2025)
Average Booking Lead Time by Month
Booking Lead Time Insights for Velaux
- The overall average booking lead time for vacation rentals in Velaux is 49 days.
- Guests book furthest in advance for stays during September (average 77 days), likely coinciding with peak travel demand or local events.
- The shortest booking windows occur for stays in December (average 23 days), indicating more last-minute travel plans during this time.
- Seasonally, Summer (65 days avg.) sees the longest lead times, while Winter (24 days avg.) has the shortest, reflecting typical travel planning cycles.
Recommendations for Hosts
- Use the overall average lead time (49 days) as a baseline for your pricing and availability strategy in Velaux.
- For September stays, consider implementing length-of-stay discounts or slightly higher rates for bookings made less than 77 days out to capitalize on advance planning.
- Target marketing efforts for the Summer season well in advance (at least 65 days) to capture early planners.
- Monitor your own booking lead times against these Velaux averages to identify opportunities for dynamic pricing adjustments.
Popular & Essential Airbnb Amenities in Velaux (2025)
Amenity Prevalence
Amenity Insights for Velaux
- Essential amenities in Velaux that guests expect include: Heating, Hot water. Lacking these (any) could significantly impact bookings.
- Popular amenities like Free parking on premises, TV, Wifi are common but not universal. Offering these can provide a competitive edge.
- Warning: Wifi is not universally provided but is considered essential globally. Ensure reliable Wifi is offered.
Recommendations for Hosts
- Ensure your listing includes all essential amenities for Velaux: Heating, Hot water.
- Prioritize adding missing essentials: Heating, Hot water.
- Consider adding popular differentiators like Free parking on premises or TV to increase appeal.
- Highlight unique or less common amenities you offer (e.g., hot tub, dedicated workspace, EV charger) in your listing description and photos.
- Regularly check competitor amenities in Velaux to stay competitive.
Velaux Airbnb Guest Demographics & Profile Analysis (2025)
Guest Profile Summary for Velaux
- The typical guest profile for Airbnb in Velaux consists of primarily domestic travelers (79%), often arriving from nearby Paris, typically belonging to the Post-2000s (Gen Z/Alpha) group (50%), primarily speaking French or English.
- Domestic travelers account for 79.0% of guests.
- Key international markets include France (79%) and Germany (4.6%).
- Top languages spoken are French (41.9%) followed by English (33.3%).
- A significant demographic segment is the Post-2000s (Gen Z/Alpha) group, representing 50% of guests.
Recommendations for Hosts
- Target domestic marketing efforts towards travelers from Paris and Lyon.
- Tailor amenities and listing descriptions to appeal to the dominant Post-2000s (Gen Z/Alpha) demographic (e.g., highlight fast WiFi, smart home features, local guides).
- Highlight unique local experiences or amenities relevant to the primary guest profile.
- Consider seasonal promotions aligned with peak travel times for key origin markets.
Nearby Short-Term Rental Market Comparison
How does the Velaux Airbnb market stack up against its neighbors? Compare key performance metrics like average monthly revenue, ADR, and occupancy rates in surrounding areas to understand the broader regional STR landscape.
| Market | Active Properties | Monthly Revenue | Daily Rate | Avg. Occupancy |
|---|---|---|---|---|
| Divajeu | 19 | $3,941 | $410.65 | 42% |
| Ramatuelle | 213 | $3,891 | $670.10 | 41% |
| Saint-Tropez | 742 | $3,498 | $506.57 | 41% |
| Chantepérier | 20 | $3,057 | $281.60 | 37% |
| Opio | 40 | $3,057 | $540.62 | 37% |
| Gassin | 384 | $2,939 | $434.44 | 40% |
| Gordes | 225 | $2,913 | $366.32 | 43% |
| Redessan | 19 | $2,834 | $334.82 | 34% |
| Fontarèches | 11 | $2,802 | $525.31 | 34% |
| Ménerbes | 97 | $2,800 | $453.86 | 41% |