Valensole Airbnb Market Analysis 2025: Short Term Rental Data & Vacation Rental Statistics in Provence-Alpes-Côte d'Azur, France
Is Airbnb profitable in Valensole in 2025? Explore comprehensive Airbnb analytics for Valensole, Provence-Alpes-Côte d'Azur, France to uncover income potential. This 2025 STR market report for Valensole, based on AirROI data from April 2024 to March 2025, reveals key trends in the niche market of 115 active listings.
Whether you're considering an Airbnb investment in Valensole, optimizing your existing vacation rental, or exploring rental arbitrage opportunities, understanding the Valensole Airbnb data is crucial. Leveraging the low regulation environment is key to maximizing your short term rental income potential. Let's dive into the specifics.
Key Valensole Airbnb Performance Metrics Overview
Monthly Airbnb Revenue Variations & Income Potential in Valensole (2025)
Understanding the monthly revenue variations for Airbnb listings in Valensole is key to maximizing your short term rental income potential. Seasonality significantly impacts earnings. Our analysis, based on data from the past 12 months, shows that the peak revenue month for STRs in Valensole is typically July, while January often presents the lowest earnings, highlighting opportunities for strategic pricing adjustments during shoulder and low seasons. Explore the typical Airbnb income in Valensole across different performance tiers:
- Best-in-class properties (Top 10%) achieve $2,521+ monthly, often utilizing dynamic pricing and superior guest experiences.
- Strong performing properties (Top 25%) earn $1,580 or more, indicating effective management and desirable locations/amenities.
- Typical properties (Median) generate around $872 per month, representing the average market performance.
- Entry-level properties (Bottom 25%) see earnings around $412, often with potential for optimization.
Average Monthly Airbnb Earnings Trend in Valensole
Valensole Airbnb Occupancy Rate Trends (2025)
Maximize your bookings by understanding the Valensole STR occupancy trends. Seasonal demand shifts significantly influence how often properties are booked. Typically, Julysees the highest demand (peak season occupancy), while January experiences the lowest (low season). Effective strategies, like adjusting minimum stays or offering promotions, can boost occupancy during slower periods. Here's how different property tiers perform in Valensole:
- Best-in-class properties (Top 10%) achieve 69%+ occupancy, indicating high desirability and potentially optimized availability.
- Strong performing properties (Top 25%) maintain 52% or higher occupancy, suggesting good market fit and guest satisfaction.
- Typical properties (Median) have an occupancy rate around 29%.
- Entry-level properties (Bottom 25%) average 14% occupancy, potentially facing higher vacancy.
Average Monthly Occupancy Rate Trend in Valensole
Average Daily Rate (ADR) Airbnb Trends in Valensole (2025)
Effective short term rental pricing strategy in Valensole involves understanding monthly ADR fluctuations. The Average Daily Rate (ADR) for Airbnb in Valensole typically peaks in July and dips lowest during March. Leveraging Airbnb dynamic pricing tools or strategies based on this seasonality can significantly boost revenue. Here's a look at the typical nightly rates achieved:
- Best-in-class properties (Top 10%) command rates of $199+ per night, often due to premium features or locations.
- Strong performing properties (Top 25%) achieve nightly rates of $132 or more.
- Typical properties (Median) charge around $85 per night.
- Entry-level properties (Bottom 25%) earn around $64 per night.
Average Daily Rate (ADR) Trend by Month in Valensole
Get Live Valensole Market Intelligence 👇

Explore Real-time Analytics
Airbnb Seasonality Analysis & Trends in Valensole (2025)
Peak Season (July, August, June)
- Revenue averages $2,020 per month
- Occupancy rates average 51.7%
- Daily rates average $117
Shoulder Season
- Revenue averages $1,121 per month
- Occupancy maintains around 33.1%
- Daily rates hold near $110
Low Season (January, February, March)
- Revenue drops to average $635 per month
- Occupancy decreases to average 20.9%
- Daily rates adjust to average $106
Seasonality Insights for Valensole
- The Airbnb seasonality in Valensole shows highly seasonal trends requiring careful strategy. While the sections above show seasonal averages, it's also insightful to look at the extremes:
- During the high season, the absolute peak month showcases Valensole's highest earning potential, with monthly revenues capable of climbing to $2,246, occupancy reaching a high of 59.5%, and ADRs peaking at $118.
- Conversely, the slowest single month of the year, typically falling within the low season, marks the market's lowest point. In this month, revenue might dip to $627, occupancy could drop to 17.9%, and ADRs may adjust down to $106.
- Understanding both the seasonal averages and these monthly peaks and troughs in revenue, occupancy, and ADR is crucial for maximizing your Airbnb profit potential in Valensole.
Seasonal Strategies for Maximizing Profit
- Peak Season: Maximize revenue through premium pricing and potentially longer minimum stays. Ensure high availability.
- Low Season: Offer competitive pricing, special promotions (e.g., extended stay discounts), and flexible cancellation policies. Target off-season travelers like remote workers or budget-conscious guests.
- Shoulder Seasons: Implement dynamic pricing that balances peak and low rates. Target weekend travelers or specific events. Offer slightly more flexible terms than peak season.
- Regularly analyze your own performance against these Valensole seasonality benchmarks and adjust your pricing and availability strategy accordingly.
Best Areas for Airbnb Investment in Valensole (2025)
Exploring the top neighborhoods for short-term rentals in Valensole? This section highlights key areas, outlining why they are attractive for hosts and guests, along with notable local attractions. Consider these locations based on your target guest profile and investment strategy.
| Neighborhood / Area | Why Host Here? (Target Guests & Appeal) | Key Attractions & Landmarks |
|---|---|---|
| Historic Centre of Valensole | Charming village known for its lavender fields and historical architecture. Attracts tourists in summer for the lavender season and those looking for a peaceful getaway in Provence. | Lavender Fields, Valensole Plateau, Church of St. Blaise, Lavender Festival, Place du Tilleul |
| Lavender Farms | Surrounding the village, these farms are iconic for their stunning lavender fields. A must-visit for tourists seeking picturesque views and photography opportunities. | Lavender Fields, Local Farm Shops, Scenic Drives, Photography Tours |
| Gorges du Verdon | Nearby stunning natural attraction, recognized as the Grand Canyon of Europe. Ideal for outdoor enthusiasts and nature lovers. | Hiking Trails, Kayaking, Scenic viewpoints, Swimming spots, Picnic Areas |
| Moustiers-Sainte-Marie | Renowned for its charming scenery and pottery, this picturesque village attracts visitors looking for culture and local crafts. | Historic Pottery Shops, Notre-Dame de Beauvoir Chapel, Gorges du Verdon access, Scenic Views, Local Artisan Markets |
| Lake Ste. Croix | A beautiful lake perfect for swimming and water sports. Attracts families and couples looking for relaxation or outdoor activities. | Swimming, Pedal Boating, Lakeside Picnics, Walking trails |
| Riez | Known for its Roman ruins and quaint streets, this small town offers a glimpse into history and local life, appealing to history buffs. | Roman Ruins, Local Markets, Historic Town Centre, Lac de Riez |
| Gréoux-les-Bains | Famous for its thermal spa and wellness centers, appealing to travelers seeking relaxation and health-oriented experiences. | Thermal Spa, Local Parks, Wellness Retreats, Markets |
| Manosque | A larger town with shopping, dining, and cultural attractions. Offers a taste of local life and convenient amenities for travelers. | Shopping District, Museums, Cafes, Local Cuisine, Cultural Events |
Understanding Airbnb License Requirements & STR Laws in Valensole (2025)
While Valensole, Provence-Alpes-Côte d'Azur, France currently shows low STR regulations, specific Airbnb license requirements might still exist or change. Always verify the latest short term rental regulations and Airbnb license requirements directly with local government authorities for Valensole to ensure full compliance before hosting.
(Source: AirROI data, 2025, based on 9% licensed listings)
Top Performing Airbnb Properties in Valensole (2025)
Benchmark your potential! Explore examples of top-performing Airbnb properties in Valensolebased on Trailing Twelve Month (TTM) revenue. Analyze their characteristics, revenue, occupancy rate, and ADR to understand what drives success in this market.
Lavan’dôme
Entire Place • 1 bedroom
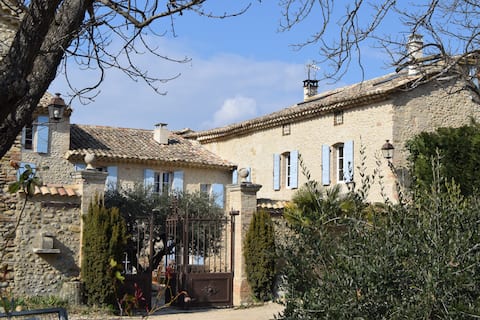
Bastide La Guérine gîte Charles en Provence
Entire Place • 4 bedrooms
Clos de la Tuilerie, Levant cottage
Entire Place • 2 bedrooms
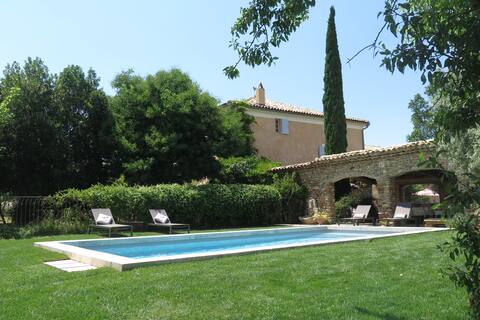
Gite L'Olivier - La Roseraie du Val 'Sunny
Entire Place • 4 bedrooms

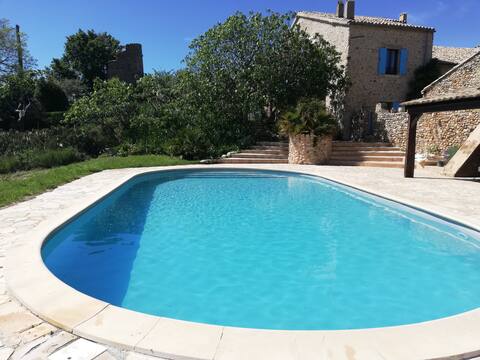
Large house in the heart of the Provencal countryside,
Entire Place • 4 bedrooms
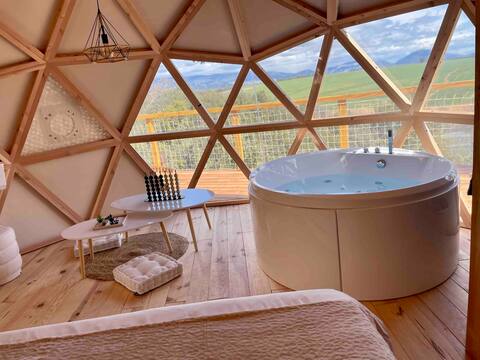
Villa with pool and hot tub, nice view. Quiet!
Entire Place • 2 bedrooms
Note: Performance varies based on location, size, amenities, seasonality, and management quality. Data reflects the past 12 months.
Top Performing Airbnb Hosts in Valensole (2025)
Learn from the best! This table showcases top-performing Airbnb hosts in Valensole based on the number of properties managed and estimated total revenue over the past year. Analyze their scale and performance metrics.
| Host Name | Properties | Grossing Revenue | Stay Reviews | Avg Rating |
|---|---|---|---|---|
| Fabienne | 3 | $51,848 | 75 | 4.87/5.0 |
| Amélie | 2 | $50,256 | 181 | 4.68/5.0 |
| Christophe | 4 | $49,580 | 373 | 3.64/5.0 |
| Betty-Fabien | 3 | $42,709 | 40 | 4.95/5.0 |
| Cécile | 2 | $42,455 | 13 | 4.46/5.0 |
| Dominique | 1 | $31,574 | 9 | 5.00/5.0 |
| Sabine | 2 | $30,182 | 325 | 4.77/5.0 |
| Aurore | 2 | $27,815 | 45 | 4.83/5.0 |
| Corinne | 1 | $27,790 | 26 | 4.88/5.0 |
| Denise | 1 | $26,809 | 25 | 4.96/5.0 |
Analyzing the strategies of top hosts, such as their property selection, pricing, and guest communication, can offer valuable lessons for optimizing your own Airbnb operations in Valensole.
Dive Deeper: Advanced Valensole STR Market Data (2025)
Ready to unlock more insights? AirROI provides access to advanced metrics and comprehensive Airbnb data for Valensole. Explore detailed analytics beyond this report to refine your investment strategy, optimize pricing, and maximize your vacation rental profits.
Explore Advanced MetricsValensole Short-Term Rental Market Composition (2025): Property & Room Types
Room Type Distribution
Property Type Distribution
Market Composition Insights for Valensole
- The Valensole Airbnb market composition is heavily skewed towards Entire Home/Apt listings, which make up 85.2% of the 115 active rentals. This indicates strong guest preference for privacy and space.
- Looking at the property type distribution in Valensole, House properties are the most common (43.5%), reflecting the local real estate landscape.
- Houses represent a significant 43.5% portion, catering likely to families or larger groups.
- The presence of 14.8% Hotel/Boutique listings indicates integration with traditional hospitality.
- Smaller segments like unique stays, others (combined 1.8%) offer potential for unique stay experiences.
Valensole Airbnb Room Capacity Analysis (2025): Bedroom Distribution
Distribution of Listings by Number of Bedrooms
Room Capacity Insights for Valensole
- The dominant room capacity in Valensole is 1 bedroom listings, making up 47% of the market. This suggests a strong demand for properties suitable for couples or solo travelers.
- Together, 1 bedroom and 2 bedrooms properties represent 64.4% of the active Airbnb listings in Valensole, indicating a high concentration in these sizes.
Valensole Vacation Rental Guest Capacity Trends (2025)
Distribution of Listings by Guest Capacity
Guest Capacity Insights for Valensole
- The most common guest capacity trend in Valensole vacation rentals is listings accommodating 2 guests (33.9%). This suggests the primary traveler segment is likely couples or solo travelers.
- Properties designed for 2 guests and 4 guests dominate the Valensole STR market, accounting for 59.1% of listings.
- 17.4% of properties accommodate 6+ guests, serving the market segment for larger families or group travel in Valensole.
- On average, properties in Valensole are equipped to host 3.3 guests.
Valensole Airbnb Booking Patterns (2025): Available vs. Booked Days
Available Days Distribution
Booked Days Distribution
Booking Pattern Insights for Valensole
- The most common availability pattern in Valensole falls within the 271-366 days range, representing 58.3% of listings. This suggests many properties have significant open periods on their calendars.
- Approximately 94.0% of listings show high availability (181+ days open annually), indicating potential for increased bookings or specific owner usage patterns.
- For booked days, the 31-90 days range is most frequent in Valensole (43.5%), reflecting common guest stay durations or potential owner blocking patterns.
- A notable 7.8% of properties secure long booking periods (181+ days booked per year), highlighting successful long-term rental strategies or significant owner usage.
Valensole Airbnb Minimum Stay Requirements Analysis
Distribution of Listings by Minimum Night Requirement
1 Night
32 listings
30.2% of total
2 Nights
37 listings
34.9% of total
3 Nights
15 listings
14.2% of total
4-6 Nights
10 listings
9.4% of total
7-29 Nights
8 listings
7.5% of total
30+ Nights
4 listings
3.8% of total
Key Insights
- The most prevalent minimum stay requirement in Valensole is 2 Nights, adopted by 34.9% of listings. This highlights the market's preference for shorter, flexible bookings.
- A strong majority (65.1%) of the Valensole Airbnb data shows acceptance of very short stays (1-2 nights), indicating a dynamic, high-turnover market.
Recommendations
- Align with the market by considering a 2 Nights minimum stay, as 34.9% of Valensole hosts use this setting.
- Adjust minimum nights based on seasonality – potentially shorter during low season and longer during peak demand periods in Valensole.
Valensole Airbnb Cancellation Policy Trends Analysis (2025)
Flexible
15 listings
14.7% of total
Moderate
40 listings
39.2% of total
Firm
21 listings
20.6% of total
Strict
26 listings
25.5% of total
Cancellation Policy Insights for Valensole
- The prevailing Airbnb cancellation policy trend in Valensole is Moderate, used by 39.2% of listings.
- There's a relatively balanced mix between guest-friendly (53.9%) and stricter (46.1%) policies, offering choices for different guest needs.
Recommendations for Hosts
- Consider adopting a Moderate policy to align with the 39.2% market standard in Valensole.
- Regularly review your cancellation policy against competitors and market demand shifts in Valensole.
Valensole STR Booking Lead Time Analysis (2025)
Average Booking Lead Time by Month
Booking Lead Time Insights for Valensole
- The overall average booking lead time for vacation rentals in Valensole is 66 days.
- Guests book furthest in advance for stays during June (average 102 days), likely coinciding with peak travel demand or local events.
- The shortest booking windows occur for stays in January (average 34 days), indicating more last-minute travel plans during this time.
- Seasonally, Summer (88 days avg.) sees the longest lead times, while Winter (45 days avg.) has the shortest, reflecting typical travel planning cycles.
Recommendations for Hosts
- Use the overall average lead time (66 days) as a baseline for your pricing and availability strategy in Valensole.
- For June stays, consider implementing length-of-stay discounts or slightly higher rates for bookings made less than 102 days out to capitalize on advance planning.
- Target marketing efforts for the Summer season well in advance (at least 88 days) to capture early planners.
- Monitor your own booking lead times against these Valensole averages to identify opportunities for dynamic pricing adjustments.
Popular & Essential Airbnb Amenities in Valensole (2025)
Amenity Prevalence
Amenity Insights for Valensole
- Popular amenities like Hot water, Refrigerator, Coffee maker are common but not universal. Offering these can provide a competitive edge.
- Warning: Wifi is not universally provided but is considered essential globally. Ensure reliable Wifi is offered.
Recommendations for Hosts
- Consider adding popular differentiators like Hot water or Refrigerator to increase appeal.
- Highlight unique or less common amenities you offer (e.g., hot tub, dedicated workspace, EV charger) in your listing description and photos.
- Regularly check competitor amenities in Valensole to stay competitive.
Valensole Airbnb Guest Demographics & Profile Analysis (2025)
Guest Profile Summary for Valensole
- The typical guest profile for Airbnb in Valensole consists of a mix of domestic (57%) and international guests, often arriving from nearby Paris, typically belonging to the Post-2000s (Gen Z/Alpha) group (50%), primarily speaking English or French.
- Domestic travelers account for 57.3% of guests.
- Key international markets include France (57.3%) and Italy (10.3%).
- Top languages spoken are English (36%) followed by French (28.3%).
- A significant demographic segment is the Post-2000s (Gen Z/Alpha) group, representing 50% of guests.
Recommendations for Hosts
- Balance marketing efforts between domestic and international channels based on the guest mix.
- Tailor amenities and listing descriptions to appeal to the dominant Post-2000s (Gen Z/Alpha) demographic (e.g., highlight fast WiFi, smart home features, local guides).
- Highlight unique local experiences or amenities relevant to the primary guest profile.
- Consider seasonal promotions aligned with peak travel times for key origin markets.
Nearby Short-Term Rental Market Comparison
How does the Valensole Airbnb market stack up against its neighbors? Compare key performance metrics like average monthly revenue, ADR, and occupancy rates in surrounding areas to understand the broader regional STR landscape.
| Market | Active Properties | Monthly Revenue | Daily Rate | Avg. Occupancy |
|---|---|---|---|---|
| Divajeu | 19 | $3,941 | $410.65 | 42% |
| Ramatuelle | 213 | $3,891 | $670.10 | 41% |
| Saint-Tropez | 742 | $3,498 | $506.57 | 41% |
| Chantepérier | 20 | $3,057 | $281.60 | 37% |
| Opio | 40 | $3,057 | $540.62 | 37% |
| Gassin | 384 | $2,939 | $434.44 | 40% |
| Gordes | 225 | $2,913 | $366.32 | 43% |
| Redessan | 19 | $2,834 | $334.82 | 34% |
| Fontarèches | 11 | $2,802 | $525.31 | 34% |
| Ménerbes | 97 | $2,800 | $453.86 | 41% |