Saorge Airbnb Market Analysis 2025: Short Term Rental Data & Vacation Rental Statistics in Provence-Alpes-Côte d'Azur, France
Is Airbnb profitable in Saorge in 2025? Explore comprehensive Airbnb analytics for Saorge, Provence-Alpes-Côte d'Azur, France to uncover income potential. This 2025 STR market report for Saorge, based on AirROI data from April 2024 to March 2025, reveals key trends in the niche market of 19 active listings.
Whether you're considering an Airbnb investment in Saorge, optimizing your existing vacation rental, or exploring rental arbitrage opportunities, understanding the Saorge Airbnb data is crucial. Leveraging the low regulation environment is key to maximizing your short term rental income potential. Let's dive into the specifics.
Key Saorge Airbnb Performance Metrics Overview
Monthly Airbnb Revenue Variations & Income Potential in Saorge (2025)
Understanding the monthly revenue variations for Airbnb listings in Saorge is key to maximizing your short term rental income potential. Seasonality significantly impacts earnings. Our analysis, based on data from the past 12 months, shows that the peak revenue month for STRs in Saorge is typically July, while March often presents the lowest earnings, highlighting opportunities for strategic pricing adjustments during shoulder and low seasons. Explore the typical Airbnb income in Saorge across different performance tiers:
- Best-in-class properties (Top 10%) achieve $2,021+ monthly, often utilizing dynamic pricing and superior guest experiences.
- Strong performing properties (Top 25%) earn $1,244 or more, indicating effective management and desirable locations/amenities.
- Typical properties (Median) generate around $740 per month, representing the average market performance.
- Entry-level properties (Bottom 25%) see earnings around $455, often with potential for optimization.
Average Monthly Airbnb Earnings Trend in Saorge
Saorge Airbnb Occupancy Rate Trends (2025)
Maximize your bookings by understanding the Saorge STR occupancy trends. Seasonal demand shifts significantly influence how often properties are booked. Typically, Augustsees the highest demand (peak season occupancy), while March experiences the lowest (low season). Effective strategies, like adjusting minimum stays or offering promotions, can boost occupancy during slower periods. Here's how different property tiers perform in Saorge:
- Best-in-class properties (Top 10%) achieve 69%+ occupancy, indicating high desirability and potentially optimized availability.
- Strong performing properties (Top 25%) maintain 47% or higher occupancy, suggesting good market fit and guest satisfaction.
- Typical properties (Median) have an occupancy rate around 33%.
- Entry-level properties (Bottom 25%) average 21% occupancy, potentially facing higher vacancy.
Average Monthly Occupancy Rate Trend in Saorge
Average Daily Rate (ADR) Airbnb Trends in Saorge (2025)
Effective short term rental pricing strategy in Saorge involves understanding monthly ADR fluctuations. The Average Daily Rate (ADR) for Airbnb in Saorge typically peaks in July and dips lowest during April. Leveraging Airbnb dynamic pricing tools or strategies based on this seasonality can significantly boost revenue. Here's a look at the typical nightly rates achieved:
- Best-in-class properties (Top 10%) command rates of $125+ per night, often due to premium features or locations.
- Strong performing properties (Top 25%) achieve nightly rates of $97 or more.
- Typical properties (Median) charge around $76 per night.
- Entry-level properties (Bottom 25%) earn around $61 per night.
Average Daily Rate (ADR) Trend by Month in Saorge
Get Live Saorge Market Intelligence 👇

Explore Real-time Analytics
Airbnb Seasonality Analysis & Trends in Saorge (2025)
Peak Season (July, August, September)
- Revenue averages $1,579 per month
- Occupancy rates average 57.3%
- Daily rates average $83
Shoulder Season
- Revenue averages $895 per month
- Occupancy maintains around 31.8%
- Daily rates hold near $82
Low Season (January, February, March)
- Revenue drops to average $479 per month
- Occupancy decreases to average 22.8%
- Daily rates adjust to average $82
Seasonality Insights for Saorge
- The Airbnb seasonality in Saorge shows highly seasonal trends requiring careful strategy. While the sections above show seasonal averages, it's also insightful to look at the extremes:
- During the high season, the absolute peak month showcases Saorge's highest earning potential, with monthly revenues capable of climbing to $1,788, occupancy reaching a high of 63.1%, and ADRs peaking at $84.
- Conversely, the slowest single month of the year, typically falling within the low season, marks the market's lowest point. In this month, revenue might dip to $431, occupancy could drop to 18.6%, and ADRs may adjust down to $81.
- Understanding both the seasonal averages and these monthly peaks and troughs in revenue, occupancy, and ADR is crucial for maximizing your Airbnb profit potential in Saorge.
Seasonal Strategies for Maximizing Profit
- Peak Season: Maximize revenue through premium pricing and potentially longer minimum stays. Ensure high availability.
- Low Season: Offer competitive pricing, special promotions (e.g., extended stay discounts), and flexible cancellation policies. Target off-season travelers like remote workers or budget-conscious guests.
- Shoulder Seasons: Implement dynamic pricing that balances peak and low rates. Target weekend travelers or specific events. Offer slightly more flexible terms than peak season.
- Regularly analyze your own performance against these Saorge seasonality benchmarks and adjust your pricing and availability strategy accordingly.
Best Areas for Airbnb Investment in Saorge (2025)
Exploring the top neighborhoods for short-term rentals in Saorge? This section highlights key areas, outlining why they are attractive for hosts and guests, along with notable local attractions. Consider these locations based on your target guest profile and investment strategy.
| Neighborhood / Area | Why Host Here? (Target Guests & Appeal) | Key Attractions & Landmarks |
|---|---|---|
| Saorge Village | A picturesque medieval village known for its stunning views and historical architecture. Attracts tourists interested in culture and natural beauty. | Eglise Saint-Géraud, Vieux Saorge, Fort de la Madone, Chemin de fer de Provence, Parc National du Mercantour |
| Tende | Nearby town with a rich history and access to beautiful nature trails. Popular with visitors looking to explore the Alps and local heritage. | Musée des Merveilles, Fort de Tenda, Alpes-Maritimes Nature Park, Lac des Mesches |
| Castillon | A small village offering tranquility and scenic views, perfect for those looking to escape the hustle and bustle of larger cities. | Chapelle Saint-Michel, Castillon Town Center, Trail to Fort Saint-Roch |
| Brevans | A charming village near Saorge, excellent for hiking and outdoor activities, drawing nature lovers and adventure seekers. | Hiking Trails, Local Markets, Scenic Overlooks |
| Sospel | A historic town with a vibrant cultural scene, surrounded by nature. Great for tourists who appreciate history and gastronomy. | Pont Vieux, Sospel Cathedral, Local Artisans |
| Peille | Another beautiful village close to Saorge, known for its medieval architecture and stunning landscapes, attracting artists and photographers. | Peille Church, Viewpoints, Art Galleries |
| Nice | The nearest major city, famous for its beaches and cultural attractions. Attracts a diverse range of tourists year-round. | Promenade des Anglais, Old Town (Vieux Nice), Nice Cote d'Azur Museum |
| Monaco | A luxurious destination known for its casinos and harbor views. Drawing affluent visitors and offering a unique urban experience. | Monte Carlo Casino, Prince's Palace, Oceanographic Museum |
Understanding Airbnb License Requirements & STR Laws in Saorge (2025)
While Saorge, Provence-Alpes-Côte d'Azur, France currently shows low STR regulations, specific Airbnb license requirements might still exist or change. Always verify the latest short term rental regulations and Airbnb license requirements directly with local government authorities for Saorge to ensure full compliance before hosting.
(Source: AirROI data, 2025, finding no licensed listings among those analyzed)
Top Performing Airbnb Properties in Saorge (2025)
Benchmark your potential! Explore examples of top-performing Airbnb properties in Saorgebased on Trailing Twelve Month (TTM) revenue. Analyze their characteristics, revenue, occupancy rate, and ADR to understand what drives success in this market.
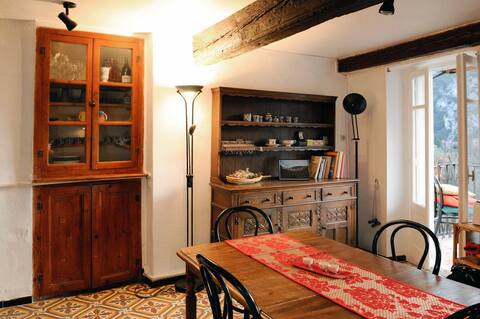
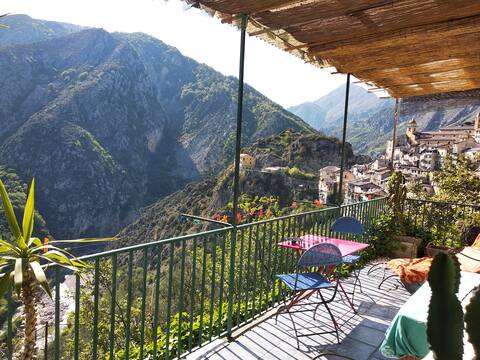
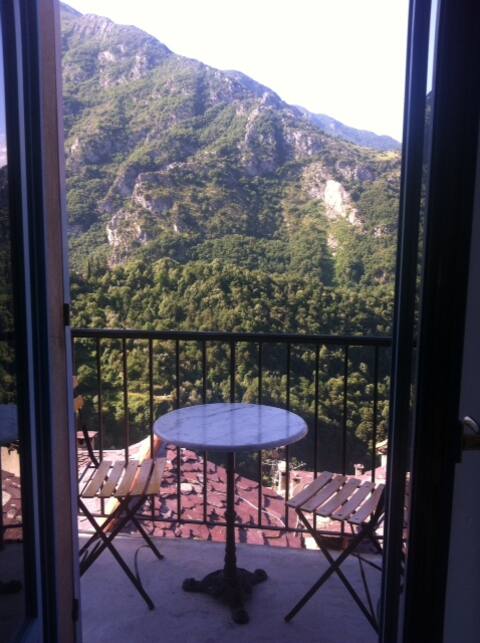
Charming flat with stunning view from balcony
Entire Place • 1 bedroom
nice house whith garden
Entire Place • 2 bedrooms
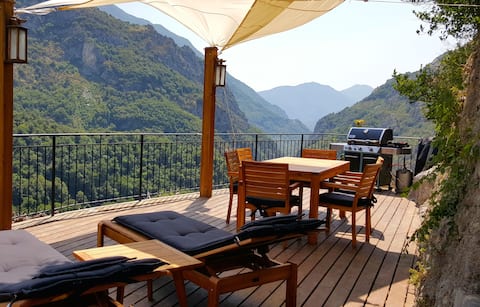
Big Terrace, close to riviera and alps
Entire Place • 1 bedroom

An unexpected refuge in the village
Entire Place • 2 bedrooms

Appartement cocooning
Entire Place • 2 bedrooms
Charming big apartment in Saorge
Entire Place • 4 bedrooms
Note: Performance varies based on location, size, amenities, seasonality, and management quality. Data reflects the past 12 months.
Top Performing Airbnb Hosts in Saorge (2025)
Learn from the best! This table showcases top-performing Airbnb hosts in Saorge based on the number of properties managed and estimated total revenue over the past year. Analyze their scale and performance metrics.
| Host Name | Properties | Grossing Revenue | Stay Reviews | Avg Rating |
|---|---|---|---|---|
| Corinne | 2 | $18,880 | 21 | 4.94/5.0 |
| Véronique | 3 | $18,552 | 104 | 4.68/5.0 |
| Elisabetta | 1 | $18,410 | 96 | 4.83/5.0 |
| Helena | 1 | $13,965 | 71 | 4.89/5.0 |
| Charlie | 2 | $13,499 | 33 | 4.93/5.0 |
| Thomas | 1 | $13,444 | 96 | 4.97/5.0 |
| Bernard-Beatrice | 1 | $12,292 | 48 | 4.92/5.0 |
| Jean Marc | 2 | $11,634 | 60 | 4.88/5.0 |
| Annemarie | 1 | $8,312 | 37 | 4.86/5.0 |
| Gibi | 1 | $6,539 | 201 | 4.62/5.0 |
Analyzing the strategies of top hosts, such as their property selection, pricing, and guest communication, can offer valuable lessons for optimizing your own Airbnb operations in Saorge.
Dive Deeper: Advanced Saorge STR Market Data (2025)
Ready to unlock more insights? AirROI provides access to advanced metrics and comprehensive Airbnb data for Saorge. Explore detailed analytics beyond this report to refine your investment strategy, optimize pricing, and maximize your vacation rental profits.
Explore Advanced MetricsSaorge Short-Term Rental Market Composition (2025): Property & Room Types
Room Type Distribution
Property Type Distribution
Market Composition Insights for Saorge
- The Saorge Airbnb market composition is heavily skewed towards Entire Home/Apt listings, which make up 89.5% of the 19 active rentals. This indicates strong guest preference for privacy and space.
- Looking at the property type distribution in Saorge, Apartment/Condo properties are the most common (73.7%), reflecting the local real estate landscape.
- Houses represent a significant 26.3% portion, catering likely to families or larger groups.
Saorge Airbnb Room Capacity Analysis (2025): Bedroom Distribution
Distribution of Listings by Number of Bedrooms
Room Capacity Insights for Saorge
- The dominant room capacity in Saorge is 2 bedrooms listings, making up 31.6% of the market. This suggests a strong demand for properties suitable for couples or solo travelers.
- Together, 2 bedrooms and 1 bedroom properties represent 63.2% of the active Airbnb listings in Saorge, indicating a high concentration in these sizes.
Saorge Vacation Rental Guest Capacity Trends (2025)
Distribution of Listings by Guest Capacity
Guest Capacity Insights for Saorge
- The most common guest capacity trend in Saorge vacation rentals is listings accommodating 2 guests (26.3%). This suggests the primary traveler segment is likely couples or solo travelers.
- Properties designed for 2 guests and 4 guests dominate the Saorge STR market, accounting for 47.4% of listings.
- 15.8% of properties accommodate 6+ guests, serving the market segment for larger families or group travel in Saorge.
- On average, properties in Saorge are equipped to host 3.4 guests.
Saorge Airbnb Booking Patterns (2025): Available vs. Booked Days
Available Days Distribution
Booked Days Distribution
Booking Pattern Insights for Saorge
- The most common availability pattern in Saorge falls within the 271-366 days range, representing 47.4% of listings. This suggests many properties have significant open periods on their calendars.
- Approximately 89.5% of listings show high availability (181+ days open annually), indicating potential for increased bookings or specific owner usage patterns.
- For booked days, the 91-180 days range is most frequent in Saorge (47.4%), reflecting common guest stay durations or potential owner blocking patterns.
- A notable 10.5% of properties secure long booking periods (181+ days booked per year), highlighting successful long-term rental strategies or significant owner usage.
Saorge Airbnb Minimum Stay Requirements Analysis
Distribution of Listings by Minimum Night Requirement
1 Night
2 listings
10.5% of total
2 Nights
3 listings
15.8% of total
3 Nights
7 listings
36.8% of total
4-6 Nights
4 listings
21.1% of total
7-29 Nights
2 listings
10.5% of total
30+ Nights
1 listings
5.3% of total
Key Insights
- The most prevalent minimum stay requirement in Saorge is 3 Nights, adopted by 36.8% of listings. This highlights the market's preference for longer commitments.
Recommendations
- Align with the market by considering a 3 Nights minimum stay, as 36.8% of Saorge hosts use this setting.
- If feasible, allowing 1-night stays, especially midweek or during low season, could capture last-minute bookings, as only 10.5% currently do.
- Explore offering discounts for stays of 30+ nights to attract the 5.3% of the market seeking extended stays.
- Adjust minimum nights based on seasonality – potentially shorter during low season and longer during peak demand periods in Saorge.
Saorge Airbnb Cancellation Policy Trends Analysis (2025)
Flexible
4 listings
21.1% of total
Moderate
5 listings
26.3% of total
Strict
10 listings
52.6% of total
Cancellation Policy Insights for Saorge
- The prevailing Airbnb cancellation policy trend in Saorge is Strict, used by 52.6% of listings.
- A majority (52.6%) of hosts in Saorge utilize Firm or Strict policies, indicating a market where hosts prioritize booking security.
Recommendations for Hosts
- Consider adopting a Strict policy to align with the 52.6% market standard in Saorge.
- With 52.6% using Strict terms, this is a viable option in Saorge, particularly for high-value properties or during peak demand periods.
- Regularly review your cancellation policy against competitors and market demand shifts in Saorge.
Saorge STR Booking Lead Time Analysis (2025)
Average Booking Lead Time by Month
Booking Lead Time Insights for Saorge
- The overall average booking lead time for vacation rentals in Saorge is 81 days.
- Guests book furthest in advance for stays during July (average 117 days), likely coinciding with peak travel demand or local events.
- The shortest booking windows occur for stays in January (average 11 days), indicating more last-minute travel plans during this time.
- Seasonally, Summer (103 days avg.) sees the longest lead times, while Winter (26 days avg.) has the shortest, reflecting typical travel planning cycles.
Recommendations for Hosts
- Use the overall average lead time (81 days) as a baseline for your pricing and availability strategy in Saorge.
- For July stays, consider implementing length-of-stay discounts or slightly higher rates for bookings made less than 117 days out to capitalize on advance planning.
- During January, focus on last-minute booking availability and promotions, as guests book with very short notice (11 days avg.).
- Target marketing efforts for the Summer season well in advance (at least 103 days) to capture early planners.
- Monitor your own booking lead times against these Saorge averages to identify opportunities for dynamic pricing adjustments.
Popular & Essential Airbnb Amenities in Saorge (2025)
Amenity Prevalence
Amenity Insights for Saorge
- Popular amenities like Heating, Refrigerator, Smoke alarm are common but not universal. Offering these can provide a competitive edge.
- Warning: Wifi is not universally provided but is considered essential globally. Ensure reliable Wifi is offered.
Recommendations for Hosts
- Consider adding popular differentiators like Heating or Refrigerator to increase appeal.
- Highlight unique or less common amenities you offer (e.g., hot tub, dedicated workspace, EV charger) in your listing description and photos.
- Regularly check competitor amenities in Saorge to stay competitive.
Saorge Airbnb Guest Demographics & Profile Analysis (2025)
Guest Profile Summary for Saorge
- The typical guest profile for Airbnb in Saorge consists of primarily domestic travelers (67%), often arriving from nearby Paris, typically belonging to the Post-2000s (Gen Z/Alpha) group (50%), primarily speaking English or French.
- Domestic travelers account for 67.3% of guests.
- Key international markets include France (67.3%) and Germany (10%).
- Top languages spoken are English (35.2%) followed by French (35.2%).
- A significant demographic segment is the Post-2000s (Gen Z/Alpha) group, representing 50% of guests.
Recommendations for Hosts
- Target domestic marketing efforts towards travelers from Paris and Marseille.
- Tailor amenities and listing descriptions to appeal to the dominant Post-2000s (Gen Z/Alpha) demographic (e.g., highlight fast WiFi, smart home features, local guides).
- Highlight unique local experiences or amenities relevant to the primary guest profile.
- Consider seasonal promotions aligned with peak travel times for key origin markets.
Nearby Short-Term Rental Market Comparison
How does the Saorge Airbnb market stack up against its neighbors? Compare key performance metrics like average monthly revenue, ADR, and occupancy rates in surrounding areas to understand the broader regional STR landscape.
| Market | Active Properties | Monthly Revenue | Daily Rate | Avg. Occupancy |
|---|---|---|---|---|
| Monteu Roero | 16 | $4,432 | $540.14 | 36% |
| Ramatuelle | 213 | $3,891 | $670.10 | 41% |
| Saint-Jean-Cap-Ferrat | 107 | $3,844 | $424.21 | 46% |
| Cossano Belbo | 13 | $3,632 | $284.21 | 42% |
| Saint-Tropez | 742 | $3,498 | $506.57 | 41% |
| Cassinasco | 18 | $3,219 | $545.40 | 41% |
| Èze | 153 | $3,168 | $345.84 | 47% |
| Opio | 40 | $3,057 | $540.62 | 37% |
| Villefranche-sur-Mer | 501 | $2,977 | $268.57 | 52% |
| Gassin | 384 | $2,939 | $434.44 | 40% |