Saint-Tropez Airbnb Market Analysis 2025: Short Term Rental Data & Vacation Rental Statistics in Provence-Alpes-Côte d'Azur, France
Is Airbnb profitable in Saint-Tropez in 2025? Explore comprehensive Airbnb analytics for Saint-Tropez, Provence-Alpes-Côte d'Azur, France to uncover income potential. This 2025 STR market report for Saint-Tropez, based on AirROI data from April 2024 to March 2025, reveals key trends in the market of 742 active listings.
Whether you're considering an Airbnb investment in Saint-Tropez, optimizing your existing vacation rental, or exploring rental arbitrage opportunities, understanding the Saint-Tropez Airbnb data is crucial. Navigating the high regulation landscape is key to maximizing your short term rental income potential. Let's dive into the specifics.
Key Saint-Tropez Airbnb Performance Metrics Overview
Monthly Airbnb Revenue Variations & Income Potential in Saint-Tropez (2025)
Understanding the monthly revenue variations for Airbnb listings in Saint-Tropez is key to maximizing your short term rental income potential. Seasonality significantly impacts earnings. Our analysis, based on data from the past 12 months, shows that the peak revenue month for STRs in Saint-Tropez is typically July, while December often presents the lowest earnings, highlighting opportunities for strategic pricing adjustments during shoulder and low seasons. Explore the typical Airbnb income in Saint-Tropez across different performance tiers:
- Best-in-class properties (Top 10%) achieve $10,725+ monthly, often utilizing dynamic pricing and superior guest experiences.
- Strong performing properties (Top 25%) earn $5,946 or more, indicating effective management and desirable locations/amenities.
- Typical properties (Median) generate around $3,142 per month, representing the average market performance.
- Entry-level properties (Bottom 25%) see earnings around $1,732, often with potential for optimization.
Average Monthly Airbnb Earnings Trend in Saint-Tropez
Saint-Tropez Airbnb Occupancy Rate Trends (2025)
Maximize your bookings by understanding the Saint-Tropez STR occupancy trends. Seasonal demand shifts significantly influence how often properties are booked. Typically, Julysees the highest demand (peak season occupancy), while January experiences the lowest (low season). Effective strategies, like adjusting minimum stays or offering promotions, can boost occupancy during slower periods. Here's how different property tiers perform in Saint-Tropez:
- Best-in-class properties (Top 10%) achieve 65%+ occupancy, indicating high desirability and potentially optimized availability.
- Strong performing properties (Top 25%) maintain 49% or higher occupancy, suggesting good market fit and guest satisfaction.
- Typical properties (Median) have an occupancy rate around 31%.
- Entry-level properties (Bottom 25%) average 17% occupancy, potentially facing higher vacancy.
Average Monthly Occupancy Rate Trend in Saint-Tropez
Average Daily Rate (ADR) Airbnb Trends in Saint-Tropez (2025)
Effective short term rental pricing strategy in Saint-Tropez involves understanding monthly ADR fluctuations. The Average Daily Rate (ADR) for Airbnb in Saint-Tropez typically peaks in August and dips lowest during March. Leveraging Airbnb dynamic pricing tools or strategies based on this seasonality can significantly boost revenue. Here's a look at the typical nightly rates achieved:
- Best-in-class properties (Top 10%) command rates of $1,306+ per night, often due to premium features or locations.
- Strong performing properties (Top 25%) achieve nightly rates of $529 or more.
- Typical properties (Median) charge around $297 per night.
- Entry-level properties (Bottom 25%) earn around $188 per night.
Average Daily Rate (ADR) Trend by Month in Saint-Tropez
Get Live Saint-Tropez Market Intelligence 👇

Explore Real-time Analytics
Airbnb Seasonality Analysis & Trends in Saint-Tropez (2025)
Peak Season (July, August, June)
- Revenue averages $9,754 per month
- Occupancy rates average 56.5%
- Daily rates average $639
Shoulder Season
- Revenue averages $4,166 per month
- Occupancy maintains around 31.2%
- Daily rates hold near $538
Low Season (January, March, December)
- Revenue drops to average $2,285 per month
- Occupancy decreases to average 19.4%
- Daily rates adjust to average $443
Seasonality Insights for Saint-Tropez
- The Airbnb seasonality in Saint-Tropez shows highly seasonal trends requiring careful strategy. While the sections above show seasonal averages, it's also insightful to look at the extremes:
- During the high season, the absolute peak month showcases Saint-Tropez's highest earning potential, with monthly revenues capable of climbing to $11,151, occupancy reaching a high of 64.4%, and ADRs peaking at $652.
- Conversely, the slowest single month of the year, typically falling within the low season, marks the market's lowest point. In this month, revenue might dip to $2,227, occupancy could drop to 16.8%, and ADRs may adjust down to $437.
- Understanding both the seasonal averages and these monthly peaks and troughs in revenue, occupancy, and ADR is crucial for maximizing your Airbnb profit potential in Saint-Tropez.
Seasonal Strategies for Maximizing Profit
- Peak Season: Maximize revenue through premium pricing and potentially longer minimum stays. Ensure high availability.
- Low Season: Offer competitive pricing, special promotions (e.g., extended stay discounts), and flexible cancellation policies. Target off-season travelers like remote workers or budget-conscious guests.
- Shoulder Seasons: Implement dynamic pricing that balances peak and low rates. Target weekend travelers or specific events. Offer slightly more flexible terms than peak season.
- Regularly analyze your own performance against these Saint-Tropez seasonality benchmarks and adjust your pricing and availability strategy accordingly.
Best Areas for Airbnb Investment in Saint-Tropez (2025)
Exploring the top neighborhoods for short-term rentals in Saint-Tropez? This section highlights key areas, outlining why they are attractive for hosts and guests, along with notable local attractions. Consider these locations based on your target guest profile and investment strategy.
| Neighborhood / Area | Why Host Here? (Target Guests & Appeal) | Key Attractions & Landmarks |
|---|---|---|
| Pampelonne Beach | Famous for its stunning beach and upscale beach clubs. Ideal for vacationers wanting sun, sand, and a vibrant beach scene. | Pampelonne Beach, Nikki Beach, Club 55, Tropicana Beach, La Réserve à la Plage |
| Saint-Tropez Old Town | Charming old town filled with narrow streets, shops, and cafes. A perfect spot for tourists who want to experience the local culture and history. | Place des Lices, Eglise Notre-Dame de l'Assomption, Citadel of Saint-Tropez, Musee de l'Annonciade, Art galleries |
| La Ponche | A picturesque neighborhood known for its historic charm and beautiful views. Attracts visitors looking for a romantic getaway and scenic beauty. | La Ponche Beach, Place de la République, Quai Jean Jaurès, old fishing boats |
| Port de Saint-Tropez | The bustling harbor area filled with luxury yachts, restaurants, and shops. A social hub that draws both tourists and locals. | Port de Saint-Tropez, Restaurants and cafes, Luxury yacht viewing, Tropezian Museum |
| Les Canoubiers | A quieter neighborhood with a local vibe, perfect for families and those seeking a relaxing environment away from tourist crowds. | Les Canoubiers Beach, Calanque de la Cron, Secluded coves |
| Chemin des Salins | Known for its beautiful beaches and natural surroundings. A great choice for visitors who want a blend of nature and beach activities. | Salins Beach, State Nature Reserve of Salins, Water sports activities |
| Saint-Tropez Gulf | The picturesque gulf area offers stunning views and a variety of water activities, popular among sailing and boating enthusiasts. | Sailing and boating, Water sports, Fishing spots, Natural beauty spots |
| Ramatuelle | A nearby village known for its vineyards and olive groves. Attractive for those seeking a more rustic and tranquil experience close to Saint-Tropez. | Vineyards, Olive groves, Local markets, Scenic views |
Understanding Airbnb License Requirements & STR Laws in Saint-Tropez (2025)
Yes, Saint-Tropez, Provence-Alpes-Côte d'Azur, France enforces high STR regulations. Obtaining a license and ensuring compliance is almost certainly required according to current 2025 STR laws. Always verify the latest short term rental regulations and Airbnb license requirements directly with local government authorities for Saint-Tropez to ensure full compliance before hosting.
(Source: AirROI data, 2025, based on 77% licensed listings)
Top Performing Airbnb Properties in Saint-Tropez (2025)
Benchmark your potential! Explore examples of top-performing Airbnb properties in Saint-Tropezbased on Trailing Twelve Month (TTM) revenue. Analyze their characteristics, revenue, occupancy rate, and ADR to understand what drives success in this market.

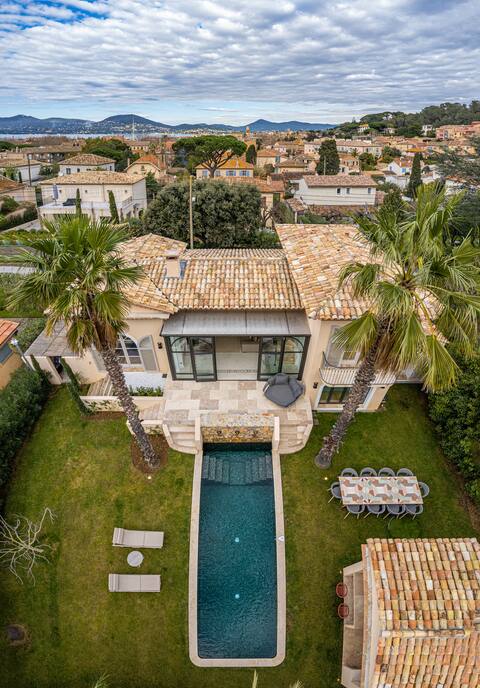
Casa El Patio - Premium Tropézienne Villa
Entire Place • 8 bedrooms
Saint Tropez - Place des Lys
Entire Place • 4 bedrooms
THE PARKS OF ST TROPEZ - LE PONANT
Entire Place • 6 bedrooms
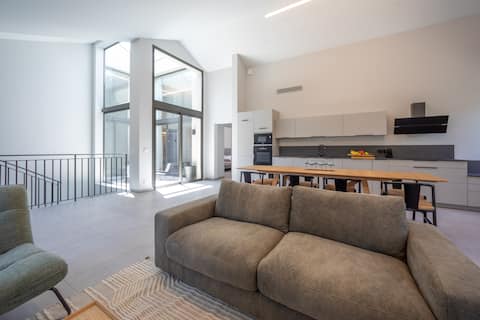
Saint-Tropez, apartment bathed in light
Entire Place • 3 bedrooms

Magnifique 2 br Nearby Place des Lices + carpark
Entire Place • 2 bedrooms

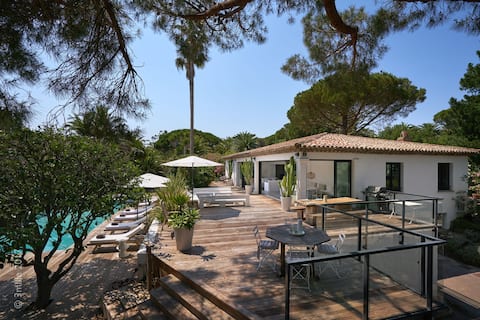
Magnificent sunny Villa Riva with pool and vinery
Entire Place • 6 bedrooms
Note: Performance varies based on location, size, amenities, seasonality, and management quality. Data reflects the past 12 months.
Top Performing Airbnb Hosts in Saint-Tropez (2025)
Learn from the best! This table showcases top-performing Airbnb hosts in Saint-Tropez based on the number of properties managed and estimated total revenue over the past year. Analyze their scale and performance metrics.
| Host Name | Properties | Grossing Revenue | Stay Reviews | Avg Rating |
|---|---|---|---|---|
| Benjamin | 27 | $1,263,535 | 1051 | 4.48/5.0 |
| Bo-House | 21 | $998,232 | 74 | 2.56/5.0 |
| Adrien | 9 | $692,467 | 170 | 3.76/5.0 |
| Maison D'Azur | 10 | $561,504 | 153 | 4.35/5.0 |
| Pick A Flat | 11 | $485,001 | 66 | 3.39/5.0 |
| Celine | 17 | $481,494 | 103 | 3.12/5.0 |
| Melanie | 5 | $405,484 | 207 | 3.74/5.0 |
| Akko | 2 | $383,511 | 20 | 2.47/5.0 |
| Laetitia | 9 | $366,566 | 284 | 4.91/5.0 |
| Host #234314752 | 3 | $324,538 | 2 | 0.00/5.0 |
Analyzing the strategies of top hosts, such as their property selection, pricing, and guest communication, can offer valuable lessons for optimizing your own Airbnb operations in Saint-Tropez.
Dive Deeper: Advanced Saint-Tropez STR Market Data (2025)
Ready to unlock more insights? AirROI provides access to advanced metrics and comprehensive Airbnb data for Saint-Tropez. Explore detailed analytics beyond this report to refine your investment strategy, optimize pricing, and maximize your vacation rental profits.
Explore Advanced MetricsSaint-Tropez Short-Term Rental Market Composition (2025): Property & Room Types
Room Type Distribution
Property Type Distribution
Market Composition Insights for Saint-Tropez
- The Saint-Tropez Airbnb market composition is heavily skewed towards Entire Home/Apt listings, which make up 96.4% of the 742 active rentals. This indicates strong guest preference for privacy and space.
- Looking at the property type distribution in Saint-Tropez, Apartment/Condo properties are the most common (77.6%), reflecting the local real estate landscape.
- Houses represent a significant 20.6% portion, catering likely to families or larger groups.
- Smaller segments like hotel/boutique, outdoor/unique, others (combined 1.7%) offer potential for unique stay experiences.
Saint-Tropez Airbnb Room Capacity Analysis (2025): Bedroom Distribution
Distribution of Listings by Number of Bedrooms
Room Capacity Insights for Saint-Tropez
- The dominant room capacity in Saint-Tropez is 1 bedroom listings, making up 36.5% of the market. This suggests a strong demand for properties suitable for couples or solo travelers.
- Together, 1 bedroom and 2 bedrooms properties represent 62.4% of the active Airbnb listings in Saint-Tropez, indicating a high concentration in these sizes.
- A significant 22.1% of listings offer 3+ bedrooms, catering to larger groups and families seeking more space in Saint-Tropez.
Saint-Tropez Vacation Rental Guest Capacity Trends (2025)
Distribution of Listings by Guest Capacity
Guest Capacity Insights for Saint-Tropez
- The most common guest capacity trend in Saint-Tropez vacation rentals is listings accommodating 4 guests (32.9%). This suggests the primary traveler segment is likely small families or groups.
- Properties designed for 4 guests and 2 guests dominate the Saint-Tropez STR market, accounting for 63.2% of listings.
- 27.4% of properties accommodate 6+ guests, serving the market segment for larger families or group travel in Saint-Tropez.
- On average, properties in Saint-Tropez are equipped to host 4.1 guests.
Saint-Tropez Airbnb Booking Patterns (2025): Available vs. Booked Days
Available Days Distribution
Booked Days Distribution
Booking Pattern Insights for Saint-Tropez
- The most common availability pattern in Saint-Tropez falls within the 271-366 days range, representing 54.4% of listings. This suggests many properties have significant open periods on their calendars.
- Approximately 92.3% of listings show high availability (181+ days open annually), indicating potential for increased bookings or specific owner usage patterns.
- For booked days, the 91-180 days range is most frequent in Saint-Tropez (39.1%), reflecting common guest stay durations or potential owner blocking patterns.
- A notable 8.6% of properties secure long booking periods (181+ days booked per year), highlighting successful long-term rental strategies or significant owner usage.
Saint-Tropez Airbnb Minimum Stay Requirements Analysis
Distribution of Listings by Minimum Night Requirement
1 Night
65 listings
9.4% of total
2 Nights
183 listings
26.4% of total
3 Nights
140 listings
20.2% of total
4-6 Nights
157 listings
22.7% of total
7-29 Nights
76 listings
11% of total
30+ Nights
71 listings
10.3% of total
Key Insights
- The most prevalent minimum stay requirement in Saint-Tropez is 2 Nights, adopted by 26.4% of listings. This highlights the market's preference for shorter, flexible bookings.
- A significant segment (10.3%) caters to monthly stays (30+ nights) in Saint-Tropez, pointing to opportunities in the extended-stay market.
Recommendations
- Align with the market by considering a 2 Nights minimum stay, as 26.4% of Saint-Tropez hosts use this setting.
- If feasible, allowing 1-night stays, especially midweek or during low season, could capture last-minute bookings, as only 9.4% currently do.
- Explore offering discounts for stays of 30+ nights to attract the 10.3% of the market seeking extended stays.
- Adjust minimum nights based on seasonality – potentially shorter during low season and longer during peak demand periods in Saint-Tropez.
Saint-Tropez Airbnb Cancellation Policy Trends Analysis (2025)
Super Strict 30 Days
5 listings
0.8% of total
Super Strict 60 Days
7 listings
1.2% of total
Flexible
55 listings
9.1% of total
Moderate
120 listings
19.9% of total
Firm
165 listings
27.3% of total
Strict
252 listings
41.7% of total
Cancellation Policy Insights for Saint-Tropez
- The prevailing Airbnb cancellation policy trend in Saint-Tropez is Strict, used by 41.7% of listings.
- A majority (69.0%) of hosts in Saint-Tropez utilize Firm or Strict policies, indicating a market where hosts prioritize booking security.
Recommendations for Hosts
- Consider adopting a Strict policy to align with the 41.7% market standard in Saint-Tropez.
- With 41.7% using Strict terms, this is a viable option in Saint-Tropez, particularly for high-value properties or during peak demand periods.
- Regularly review your cancellation policy against competitors and market demand shifts in Saint-Tropez.
Saint-Tropez STR Booking Lead Time Analysis (2025)
Average Booking Lead Time by Month
Booking Lead Time Insights for Saint-Tropez
- The overall average booking lead time for vacation rentals in Saint-Tropez is 64 days.
- Guests book furthest in advance for stays during July (average 98 days), likely coinciding with peak travel demand or local events.
- The shortest booking windows occur for stays in February (average 31 days), indicating more last-minute travel plans during this time.
- Seasonally, Summer (89 days avg.) sees the longest lead times, while Winter (44 days avg.) has the shortest, reflecting typical travel planning cycles.
Recommendations for Hosts
- Use the overall average lead time (64 days) as a baseline for your pricing and availability strategy in Saint-Tropez.
- For July stays, consider implementing length-of-stay discounts or slightly higher rates for bookings made less than 98 days out to capitalize on advance planning.
- Target marketing efforts for the Summer season well in advance (at least 89 days) to capture early planners.
- Monitor your own booking lead times against these Saint-Tropez averages to identify opportunities for dynamic pricing adjustments.
Popular & Essential Airbnb Amenities in Saint-Tropez (2025)
Amenity Prevalence
Amenity Insights for Saint-Tropez
- Essential amenities in Saint-Tropez that guests expect include: Kitchen, TV. Lacking these (any) could significantly impact bookings.
- Popular amenities like Wifi, Air conditioning, Heating are common but not universal. Offering these can provide a competitive edge.
- Warning: Wifi is not universally provided but is considered essential globally. Ensure reliable Wifi is offered.
Recommendations for Hosts
- Ensure your listing includes all essential amenities for Saint-Tropez: Kitchen, TV.
- Prioritize adding missing essentials: Kitchen, TV.
- Consider adding popular differentiators like Wifi or Air conditioning to increase appeal.
- Highlight unique or less common amenities you offer (e.g., hot tub, dedicated workspace, EV charger) in your listing description and photos.
- Regularly check competitor amenities in Saint-Tropez to stay competitive.
Saint-Tropez Airbnb Guest Demographics & Profile Analysis (2025)
Guest Profile Summary for Saint-Tropez
- The typical guest profile for Airbnb in Saint-Tropez consists of predominantly international visitors (77%), with top international origins including France, typically belonging to the Post-2000s (Gen Z/Alpha) group (50%), primarily speaking English or French.
- Domestic travelers account for 22.7% of guests.
- Key international markets include United States (29.7%) and France (22.7%).
- Top languages spoken are English (43.7%) followed by French (19.9%).
- A significant demographic segment is the Post-2000s (Gen Z/Alpha) group, representing 50% of guests.
Recommendations for Hosts
- Focus marketing internationally, particularly towards travelers from France.
- Tailor amenities and listing descriptions to appeal to the dominant Post-2000s (Gen Z/Alpha) demographic (e.g., highlight fast WiFi, smart home features, local guides).
- Highlight unique local experiences or amenities relevant to the primary guest profile.
- Consider seasonal promotions aligned with peak travel times for key origin markets.
Nearby Short-Term Rental Market Comparison
How does the Saint-Tropez Airbnb market stack up against its neighbors? Compare key performance metrics like average monthly revenue, ADR, and occupancy rates in surrounding areas to understand the broader regional STR landscape.
| Market | Active Properties | Monthly Revenue | Daily Rate | Avg. Occupancy |
|---|---|---|---|---|
| Monteu Roero | 16 | $4,432 | $540.14 | 36% |
| Ramatuelle | 213 | $3,891 | $670.10 | 41% |
| Saint-Jean-Cap-Ferrat | 107 | $3,844 | $424.21 | 46% |
| Èze | 153 | $3,168 | $345.84 | 47% |
| Chantepérier | 20 | $3,057 | $281.60 | 37% |
| Opio | 40 | $3,057 | $540.62 | 37% |
| Villefranche-sur-Mer | 501 | $2,977 | $268.57 | 52% |
| Gassin | 384 | $2,939 | $434.44 | 40% |
| Gordes | 225 | $2,913 | $366.32 | 43% |
| Monaco | 184 | $2,817 | $421.75 | 39% |