Saint-Rémy-de-Provence Airbnb Market Analysis 2025: Short Term Rental Data & Vacation Rental Statistics in Provence-Alpes-Côte d'Azur, France
Is Airbnb profitable in Saint-Rémy-de-Provence in 2025? Explore comprehensive Airbnb analytics for Saint-Rémy-de-Provence, Provence-Alpes-Côte d'Azur, France to uncover income potential. This 2025 STR market report for Saint-Rémy-de-Provence, based on AirROI data from April 2024 to March 2025, reveals key trends in the market of 575 active listings.
Whether you're considering an Airbnb investment in Saint-Rémy-de-Provence, optimizing your existing vacation rental, or exploring rental arbitrage opportunities, understanding the Saint-Rémy-de-Provence Airbnb data is crucial. Navigating the high regulation landscape is key to maximizing your short term rental income potential. Let's dive into the specifics.
Key Saint-Rémy-de-Provence Airbnb Performance Metrics Overview
Monthly Airbnb Revenue Variations & Income Potential in Saint-Rémy-de-Provence (2025)
Understanding the monthly revenue variations for Airbnb listings in Saint-Rémy-de-Provence is key to maximizing your short term rental income potential. Seasonality significantly impacts earnings. Our analysis, based on data from the past 12 months, shows that the peak revenue month for STRs in Saint-Rémy-de-Provence is typically August, while February often presents the lowest earnings, highlighting opportunities for strategic pricing adjustments during shoulder and low seasons. Explore the typical Airbnb income in Saint-Rémy-de-Provence across different performance tiers:
- Best-in-class properties (Top 10%) achieve $7,403+ monthly, often utilizing dynamic pricing and superior guest experiences.
- Strong performing properties (Top 25%) earn $3,798 or more, indicating effective management and desirable locations/amenities.
- Typical properties (Median) generate around $1,986 per month, representing the average market performance.
- Entry-level properties (Bottom 25%) see earnings around $1,035, often with potential for optimization.
Average Monthly Airbnb Earnings Trend in Saint-Rémy-de-Provence
Saint-Rémy-de-Provence Airbnb Occupancy Rate Trends (2025)
Maximize your bookings by understanding the Saint-Rémy-de-Provence STR occupancy trends. Seasonal demand shifts significantly influence how often properties are booked. Typically, Augustsees the highest demand (peak season occupancy), while January experiences the lowest (low season). Effective strategies, like adjusting minimum stays or offering promotions, can boost occupancy during slower periods. Here's how different property tiers perform in Saint-Rémy-de-Provence:
- Best-in-class properties (Top 10%) achieve 79%+ occupancy, indicating high desirability and potentially optimized availability.
- Strong performing properties (Top 25%) maintain 59% or higher occupancy, suggesting good market fit and guest satisfaction.
- Typical properties (Median) have an occupancy rate around 39%.
- Entry-level properties (Bottom 25%) average 19% occupancy, potentially facing higher vacancy.
Average Monthly Occupancy Rate Trend in Saint-Rémy-de-Provence
Average Daily Rate (ADR) Airbnb Trends in Saint-Rémy-de-Provence (2025)
Effective short term rental pricing strategy in Saint-Rémy-de-Provence involves understanding monthly ADR fluctuations. The Average Daily Rate (ADR) for Airbnb in Saint-Rémy-de-Provence typically peaks in July and dips lowest during March. Leveraging Airbnb dynamic pricing tools or strategies based on this seasonality can significantly boost revenue. Here's a look at the typical nightly rates achieved:
- Best-in-class properties (Top 10%) command rates of $745+ per night, often due to premium features or locations.
- Strong performing properties (Top 25%) achieve nightly rates of $401 or more.
- Typical properties (Median) charge around $178 per night.
- Entry-level properties (Bottom 25%) earn around $111 per night.
Average Daily Rate (ADR) Trend by Month in Saint-Rémy-de-Provence
Get Live Saint-Rémy-de-Provence Market Intelligence 👇

Explore Real-time Analytics
Airbnb Seasonality Analysis & Trends in Saint-Rémy-de-Provence (2025)
Peak Season (August, July, June)
- Revenue averages $4,966 per month
- Occupancy rates average 53.1%
- Daily rates average $374
Shoulder Season
- Revenue averages $3,189 per month
- Occupancy maintains around 41.6%
- Daily rates hold near $338
Low Season (January, February, March)
- Revenue drops to average $1,894 per month
- Occupancy decreases to average 27.7%
- Daily rates adjust to average $296
Seasonality Insights for Saint-Rémy-de-Provence
- The Airbnb seasonality in Saint-Rémy-de-Provence shows highly seasonal trends requiring careful strategy. While the sections above show seasonal averages, it's also insightful to look at the extremes:
- During the high season, the absolute peak month showcases Saint-Rémy-de-Provence's highest earning potential, with monthly revenues capable of climbing to $5,502, occupancy reaching a high of 60.2%, and ADRs peaking at $378.
- Conversely, the slowest single month of the year, typically falling within the low season, marks the market's lowest point. In this month, revenue might dip to $1,812, occupancy could drop to 25.0%, and ADRs may adjust down to $293.
- Understanding both the seasonal averages and these monthly peaks and troughs in revenue, occupancy, and ADR is crucial for maximizing your Airbnb profit potential in Saint-Rémy-de-Provence.
Seasonal Strategies for Maximizing Profit
- Peak Season: Maximize revenue through premium pricing and potentially longer minimum stays. Ensure high availability.
- Low Season: Offer competitive pricing, special promotions (e.g., extended stay discounts), and flexible cancellation policies. Target off-season travelers like remote workers or budget-conscious guests.
- Shoulder Seasons: Implement dynamic pricing that balances peak and low rates. Target weekend travelers or specific events. Offer slightly more flexible terms than peak season.
- Regularly analyze your own performance against these Saint-Rémy-de-Provence seasonality benchmarks and adjust your pricing and availability strategy accordingly.
Best Areas for Airbnb Investment in Saint-Rémy-de-Provence (2025)
Exploring the top neighborhoods for short-term rentals in Saint-Rémy-de-Provence? This section highlights key areas, outlining why they are attractive for hosts and guests, along with notable local attractions. Consider these locations based on your target guest profile and investment strategy.
| Neighborhood / Area | Why Host Here? (Target Guests & Appeal) | Key Attractions & Landmarks |
|---|---|---|
| Historic Center | The heart of Saint-Rémy-de-Provence, known for its charming narrow streets, boutiques, and local markets. It's a favorite among tourists looking to experience the authentic Provençal lifestyle. | Saint-Paul de Mausole Monastery, Villa Gallici, Local farmers' market, Musee Estrine, Church of Saint-Rémy |
| Les Alpilles | Surrounded by stunning landscapes and natural beauty, Les Alpilles offers access to outdoor activities and tranquil retreats. Ideal for nature lovers and those seeking relaxation. | Parc Naturel Régional des Alpilles, Les Baux-de-Provence, Gorges de la Nesque, Hiking trails, Olive groves |
| Glanum | An ancient Roman archaeological site that attracts history enthusiasts and tourists interested in culture. Provides a unique backdrop for visitors looking to explore the area's history. | Glanum ruins, Roman monuments, St. Remy de Provence archaeological museum |
| Cultural District | Home to art galleries, theaters, and cultural events. This area attracts visitors interested in art and music, offering a vibrant atmosphere. | Art galleries, Cultural festivals, Local theaters, Theatre Antique |
| Market Area | Known for its lively markets and food stalls. This area appeals to foodies and those looking to experience the local culinary delights of Provençal cuisine. | Weekly market, Gourmet food shops, Flea market |
| Les Carrières de Lumières | A unique multimedia art venue created in a former quarry, attracting art lovers and tourists for immersive exhibitions featuring famous artists. | Carrières de Lumières, Art exhibitions, Concerts, Cultural events |
| Provence Countryside | A stunning region filled with vineyards and picturesque villages, perfect for those seeking a rural retreat while being close to Saint-Rémy. | Vineyard tours, Olive oil producers, Beautiful landscapes |
| Luberon Region | A renowned area filled with charming villages and beautiful landscapes. Attracts tourists looking to explore the Provence countryside and experience local culture. | Gordes, Roussillon, Colorado Provençal, Regional parks |
Understanding Airbnb License Requirements & STR Laws in Saint-Rémy-de-Provence (2025)
Yes, Saint-Rémy-de-Provence, Provence-Alpes-Côte d'Azur, France enforces high STR regulations. Obtaining a license and ensuring compliance is almost certainly required according to current 2025 STR laws. Always verify the latest short term rental regulations and Airbnb license requirements directly with local government authorities for Saint-Rémy-de-Provence to ensure full compliance before hosting.
(Source: AirROI data, 2025, based on 32% licensed listings)
Top Performing Airbnb Properties in Saint-Rémy-de-Provence (2025)
Benchmark your potential! Explore examples of top-performing Airbnb properties in Saint-Rémy-de-Provencebased on Trailing Twelve Month (TTM) revenue. Analyze their characteristics, revenue, occupancy rate, and ADR to understand what drives success in this market.
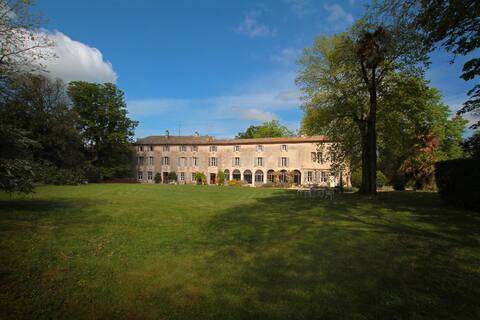
La Fabrique Moulin XIXème d 'exceptional
Entire Place • 14 bedrooms
Maison Des Fees
Entire Place • 7 bedrooms
Mas Des Bonbons
Entire Place • N/A
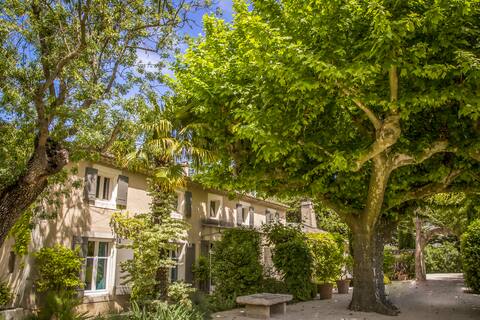
Mas Oriental
Entire Place • 4 bedrooms
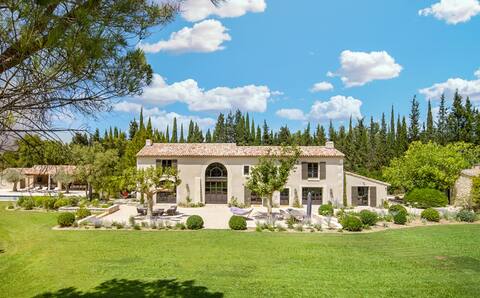
Mas Gabriel - St Remy de Provence
Entire Place • 6 bedrooms

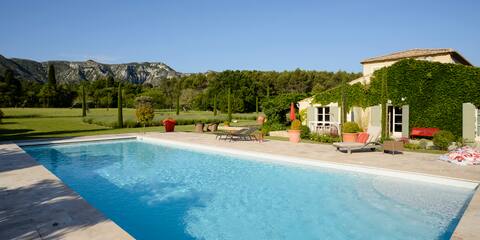
5* villa at the gates of the village
Entire Place • 4 bedrooms
Note: Performance varies based on location, size, amenities, seasonality, and management quality. Data reflects the past 12 months.
Top Performing Airbnb Hosts in Saint-Rémy-de-Provence (2025)
Learn from the best! This table showcases top-performing Airbnb hosts in Saint-Rémy-de-Provence based on the number of properties managed and estimated total revenue over the past year. Analyze their scale and performance metrics.
| Host Name | Properties | Grossing Revenue | Stay Reviews | Avg Rating |
|---|---|---|---|---|
| Host #449488095 | 21 | $1,249,220 | 0 | 0.00/5.0 |
| Hervé | 2 | $283,257 | 4 | 2.50/5.0 |
| Claude | 3 | $201,018 | 55 | 3.23/5.0 |
| Maxence | 7 | $199,140 | 69 | 3.46/5.0 |
| Alice | 2 | $174,812 | 22 | 5.00/5.0 |
| Romain | 4 | $173,017 | 87 | 4.97/5.0 |
| Isabelle Et Francis | 2 | $172,500 | 16 | 5.00/5.0 |
| Jessica | 2 | $168,104 | 184 | 4.93/5.0 |
| Karen | 6 | $166,278 | 206 | 4.13/5.0 |
| Isabelle Et Jean Yves | 2 | $161,389 | 51 | 4.99/5.0 |
Analyzing the strategies of top hosts, such as their property selection, pricing, and guest communication, can offer valuable lessons for optimizing your own Airbnb operations in Saint-Rémy-de-Provence.
Dive Deeper: Advanced Saint-Rémy-de-Provence STR Market Data (2025)
Ready to unlock more insights? AirROI provides access to advanced metrics and comprehensive Airbnb data for Saint-Rémy-de-Provence. Explore detailed analytics beyond this report to refine your investment strategy, optimize pricing, and maximize your vacation rental profits.
Explore Advanced MetricsSaint-Rémy-de-Provence Short-Term Rental Market Composition (2025): Property & Room Types
Room Type Distribution
Property Type Distribution
Market Composition Insights for Saint-Rémy-de-Provence
- The Saint-Rémy-de-Provence Airbnb market composition is heavily skewed towards Entire Home/Apt listings, which make up 92.3% of the 575 active rentals. This indicates strong guest preference for privacy and space.
- Looking at the property type distribution in Saint-Rémy-de-Provence, House properties are the most common (63.3%), reflecting the local real estate landscape.
- Houses represent a significant 63.3% portion, catering likely to families or larger groups.
- The presence of 6.1% Hotel/Boutique listings indicates integration with traditional hospitality.
- Smaller segments like others, outdoor/unique (combined 3.7%) offer potential for unique stay experiences.
Saint-Rémy-de-Provence Airbnb Room Capacity Analysis (2025): Bedroom Distribution
Distribution of Listings by Number of Bedrooms
Room Capacity Insights for Saint-Rémy-de-Provence
- The dominant room capacity in Saint-Rémy-de-Provence is 1 bedroom listings, making up 32.7% of the market. This suggests a strong demand for properties suitable for couples or solo travelers.
- Together, 1 bedroom and 2 bedrooms properties represent 52.4% of the active Airbnb listings in Saint-Rémy-de-Provence, indicating a high concentration in these sizes.
- A significant 40.0% of listings offer 3+ bedrooms, catering to larger groups and families seeking more space in Saint-Rémy-de-Provence.
Saint-Rémy-de-Provence Vacation Rental Guest Capacity Trends (2025)
Distribution of Listings by Guest Capacity
Guest Capacity Insights for Saint-Rémy-de-Provence
- The most common guest capacity trend in Saint-Rémy-de-Provence vacation rentals is listings accommodating 4 guests (28.2%). This suggests the primary traveler segment is likely small families or groups.
- Properties designed for 4 guests and 8+ guests dominate the Saint-Rémy-de-Provence STR market, accounting for 51.0% of listings.
- 39.9% of properties accommodate 6+ guests, serving the market segment for larger families or group travel in Saint-Rémy-de-Provence.
- On average, properties in Saint-Rémy-de-Provence are equipped to host 4.7 guests.
Saint-Rémy-de-Provence Airbnb Booking Patterns (2025): Available vs. Booked Days
Available Days Distribution
Booked Days Distribution
Booking Pattern Insights for Saint-Rémy-de-Provence
- The most common availability pattern in Saint-Rémy-de-Provence falls within the 271-366 days range, representing 48.7% of listings. This suggests many properties have significant open periods on their calendars.
- Approximately 81.7% of listings show high availability (181+ days open annually), indicating potential for increased bookings or specific owner usage patterns.
- For booked days, the 91-180 days range is most frequent in Saint-Rémy-de-Provence (33.2%), reflecting common guest stay durations or potential owner blocking patterns.
- A notable 19.7% of properties secure long booking periods (181+ days booked per year), highlighting successful long-term rental strategies or significant owner usage.
Saint-Rémy-de-Provence Airbnb Minimum Stay Requirements Analysis
Distribution of Listings by Minimum Night Requirement
1 Night
71 listings
13.2% of total
2 Nights
113 listings
21.1% of total
3 Nights
101 listings
18.8% of total
4-6 Nights
101 listings
18.8% of total
7-29 Nights
85 listings
15.9% of total
30+ Nights
65 listings
12.1% of total
Key Insights
- The most prevalent minimum stay requirement in Saint-Rémy-de-Provence is 2 Nights, adopted by 21.1% of listings. This highlights the market's preference for shorter, flexible bookings.
- A significant segment (12.1%) caters to monthly stays (30+ nights) in Saint-Rémy-de-Provence, pointing to opportunities in the extended-stay market.
Recommendations
- Align with the market by considering a 2 Nights minimum stay, as 21.1% of Saint-Rémy-de-Provence hosts use this setting.
- If feasible, allowing 1-night stays, especially midweek or during low season, could capture last-minute bookings, as only 13.2% currently do.
- Explore offering discounts for stays of 30+ nights to attract the 12.1% of the market seeking extended stays.
- Adjust minimum nights based on seasonality – potentially shorter during low season and longer during peak demand periods in Saint-Rémy-de-Provence.
Saint-Rémy-de-Provence Airbnb Cancellation Policy Trends Analysis (2025)
Super Strict 60 Days
8 listings
1.7% of total
Super Strict 30 Days
1 listings
0.2% of total
Flexible
99 listings
20.6% of total
Moderate
99 listings
20.6% of total
Firm
108 listings
22.5% of total
Strict
165 listings
34.4% of total
Cancellation Policy Insights for Saint-Rémy-de-Provence
- The prevailing Airbnb cancellation policy trend in Saint-Rémy-de-Provence is Strict, used by 34.4% of listings.
- A majority (56.9%) of hosts in Saint-Rémy-de-Provence utilize Firm or Strict policies, indicating a market where hosts prioritize booking security.
Recommendations for Hosts
- Consider adopting a Strict policy to align with the 34.4% market standard in Saint-Rémy-de-Provence.
- With 34.4% using Strict terms, this is a viable option in Saint-Rémy-de-Provence, particularly for high-value properties or during peak demand periods.
- Regularly review your cancellation policy against competitors and market demand shifts in Saint-Rémy-de-Provence.
Saint-Rémy-de-Provence STR Booking Lead Time Analysis (2025)
Average Booking Lead Time by Month
Booking Lead Time Insights for Saint-Rémy-de-Provence
- The overall average booking lead time for vacation rentals in Saint-Rémy-de-Provence is 69 days.
- Guests book furthest in advance for stays during May (average 99 days), likely coinciding with peak travel demand or local events.
- The shortest booking windows occur for stays in March (average 43 days), indicating more last-minute travel plans during this time.
- Seasonally, Summer (97 days avg.) sees the longest lead times, while Winter (46 days avg.) has the shortest, reflecting typical travel planning cycles.
Recommendations for Hosts
- Use the overall average lead time (69 days) as a baseline for your pricing and availability strategy in Saint-Rémy-de-Provence.
- For May stays, consider implementing length-of-stay discounts or slightly higher rates for bookings made less than 99 days out to capitalize on advance planning.
- Target marketing efforts for the Summer season well in advance (at least 97 days) to capture early planners.
- Monitor your own booking lead times against these Saint-Rémy-de-Provence averages to identify opportunities for dynamic pricing adjustments.
Popular & Essential Airbnb Amenities in Saint-Rémy-de-Provence (2025)
Amenity Prevalence
Amenity Insights for Saint-Rémy-de-Provence
- Essential amenities in Saint-Rémy-de-Provence that guests expect include: Wifi, Heating. Lacking these (any) could significantly impact bookings.
- Popular amenities like Kitchen, TV, Essentials are common but not universal. Offering these can provide a competitive edge.
Recommendations for Hosts
- Ensure your listing includes all essential amenities for Saint-Rémy-de-Provence: Wifi, Heating.
- Prioritize adding missing essentials: Wifi, Heating.
- Consider adding popular differentiators like Kitchen or TV to increase appeal.
- Highlight unique or less common amenities you offer (e.g., hot tub, dedicated workspace, EV charger) in your listing description and photos.
- Regularly check competitor amenities in Saint-Rémy-de-Provence to stay competitive.
Saint-Rémy-de-Provence Airbnb Guest Demographics & Profile Analysis (2025)
Guest Profile Summary for Saint-Rémy-de-Provence
- The typical guest profile for Airbnb in Saint-Rémy-de-Provence consists of a mix of domestic (49%) and international guests, with top international origins including United States, typically belonging to the Post-2000s (Gen Z/Alpha) group (50%), primarily speaking English or French.
- Domestic travelers account for 48.7% of guests.
- Key international markets include France (48.7%) and United States (16.8%).
- Top languages spoken are English (40.6%) followed by French (31.9%).
- A significant demographic segment is the Post-2000s (Gen Z/Alpha) group, representing 50% of guests.
Recommendations for Hosts
- Balance marketing efforts between domestic and international channels based on the guest mix.
- Tailor amenities and listing descriptions to appeal to the dominant Post-2000s (Gen Z/Alpha) demographic (e.g., highlight fast WiFi, smart home features, local guides).
- Highlight unique local experiences or amenities relevant to the primary guest profile.
- Consider seasonal promotions aligned with peak travel times for key origin markets.
Nearby Short-Term Rental Market Comparison
How does the Saint-Rémy-de-Provence Airbnb market stack up against its neighbors? Compare key performance metrics like average monthly revenue, ADR, and occupancy rates in surrounding areas to understand the broader regional STR landscape.
| Market | Active Properties | Monthly Revenue | Daily Rate | Avg. Occupancy |
|---|---|---|---|---|
| Villeneuvette | 13 | $4,150 | $337.56 | 44% |
| Divajeu | 19 | $3,941 | $410.65 | 42% |
| Chantepérier | 20 | $3,057 | $281.60 | 37% |
| Rupià | 11 | $3,046 | $386.95 | 40% |
| Gordes | 225 | $2,913 | $366.32 | 43% |
| Redessan | 19 | $2,834 | $334.82 | 34% |
| Fontarèches | 11 | $2,802 | $525.31 | 34% |
| Ménerbes | 97 | $2,800 | $453.86 | 41% |
| La Bruguière | 14 | $2,732 | $277.64 | 50% |
| Soyans | 12 | $2,721 | $193.55 | 45% |