Saint-André-de-la-Roche Airbnb Market Analysis 2025: Short Term Rental Data & Vacation Rental Statistics in Provence-Alpes-Côte d'Azur, France
Is Airbnb profitable in Saint-André-de-la-Roche in 2025? Explore comprehensive Airbnb analytics for Saint-André-de-la-Roche, Provence-Alpes-Côte d'Azur, France to uncover income potential. This 2025 STR market report for Saint-André-de-la-Roche, based on AirROI data from April 2024 to March 2025, reveals key trends in the niche market of 23 active listings.
Whether you're considering an Airbnb investment in Saint-André-de-la-Roche, optimizing your existing vacation rental, or exploring rental arbitrage opportunities, understanding the Saint-André-de-la-Roche Airbnb data is crucial. Understanding the local regulations is key to maximizing your short term rental income potential. Let's dive into the specifics.
Key Saint-André-de-la-Roche Airbnb Performance Metrics Overview
Monthly Airbnb Revenue Variations & Income Potential in Saint-André-de-la-Roche (2025)
Understanding the monthly revenue variations for Airbnb listings in Saint-André-de-la-Roche is key to maximizing your short term rental income potential. Seasonality significantly impacts earnings. Our analysis, based on data from the past 12 months, shows that the peak revenue month for STRs in Saint-André-de-la-Roche is typically August, while January often presents the lowest earnings, highlighting opportunities for strategic pricing adjustments during shoulder and low seasons. Explore the typical Airbnb income in Saint-André-de-la-Roche across different performance tiers:
- Best-in-class properties (Top 10%) achieve $5,244+ monthly, often utilizing dynamic pricing and superior guest experiences.
- Strong performing properties (Top 25%) earn $2,640 or more, indicating effective management and desirable locations/amenities.
- Typical properties (Median) generate around $1,646 per month, representing the average market performance.
- Entry-level properties (Bottom 25%) see earnings around $764, often with potential for optimization.
Average Monthly Airbnb Earnings Trend in Saint-André-de-la-Roche
Saint-André-de-la-Roche Airbnb Occupancy Rate Trends (2025)
Maximize your bookings by understanding the Saint-André-de-la-Roche STR occupancy trends. Seasonal demand shifts significantly influence how often properties are booked. Typically, Augustsees the highest demand (peak season occupancy), while January experiences the lowest (low season). Effective strategies, like adjusting minimum stays or offering promotions, can boost occupancy during slower periods. Here's how different property tiers perform in Saint-André-de-la-Roche:
- Best-in-class properties (Top 10%) achieve 71%+ occupancy, indicating high desirability and potentially optimized availability.
- Strong performing properties (Top 25%) maintain 58% or higher occupancy, suggesting good market fit and guest satisfaction.
- Typical properties (Median) have an occupancy rate around 38%.
- Entry-level properties (Bottom 25%) average 22% occupancy, potentially facing higher vacancy.
Average Monthly Occupancy Rate Trend in Saint-André-de-la-Roche
Average Daily Rate (ADR) Airbnb Trends in Saint-André-de-la-Roche (2025)
Effective short term rental pricing strategy in Saint-André-de-la-Roche involves understanding monthly ADR fluctuations. The Average Daily Rate (ADR) for Airbnb in Saint-André-de-la-Roche typically peaks in July and dips lowest during March. Leveraging Airbnb dynamic pricing tools or strategies based on this seasonality can significantly boost revenue. Here's a look at the typical nightly rates achieved:
- Best-in-class properties (Top 10%) command rates of $382+ per night, often due to premium features or locations.
- Strong performing properties (Top 25%) achieve nightly rates of $198 or more.
- Typical properties (Median) charge around $131 per night.
- Entry-level properties (Bottom 25%) earn around $81 per night.
Average Daily Rate (ADR) Trend by Month in Saint-André-de-la-Roche
Get Live Saint-André-de-la-Roche Market Intelligence 👇

Explore Real-time Analytics
Airbnb Seasonality Analysis & Trends in Saint-André-de-la-Roche (2025)
Peak Season (August, July, September)
- Revenue averages $4,031 per month
- Occupancy rates average 64.1%
- Daily rates average $178
Shoulder Season
- Revenue averages $2,294 per month
- Occupancy maintains around 37.4%
- Daily rates hold near $168
Low Season (January, February, March)
- Revenue drops to average $1,002 per month
- Occupancy decreases to average 24.0%
- Daily rates adjust to average $162
Seasonality Insights for Saint-André-de-la-Roche
- The Airbnb seasonality in Saint-André-de-la-Roche shows highly seasonal trends requiring careful strategy. While the sections above show seasonal averages, it's also insightful to look at the extremes:
- During the high season, the absolute peak month showcases Saint-André-de-la-Roche's highest earning potential, with monthly revenues capable of climbing to $4,951, occupancy reaching a high of 78.5%, and ADRs peaking at $183.
- Conversely, the slowest single month of the year, typically falling within the low season, marks the market's lowest point. In this month, revenue might dip to $897, occupancy could drop to 18.3%, and ADRs may adjust down to $160.
- Understanding both the seasonal averages and these monthly peaks and troughs in revenue, occupancy, and ADR is crucial for maximizing your Airbnb profit potential in Saint-André-de-la-Roche.
Seasonal Strategies for Maximizing Profit
- Peak Season: Maximize revenue through premium pricing and potentially longer minimum stays. Ensure high availability.
- Low Season: Offer competitive pricing, special promotions (e.g., extended stay discounts), and flexible cancellation policies. Target off-season travelers like remote workers or budget-conscious guests.
- Shoulder Seasons: Implement dynamic pricing that balances peak and low rates. Target weekend travelers or specific events. Offer slightly more flexible terms than peak season.
- Regularly analyze your own performance against these Saint-André-de-la-Roche seasonality benchmarks and adjust your pricing and availability strategy accordingly.
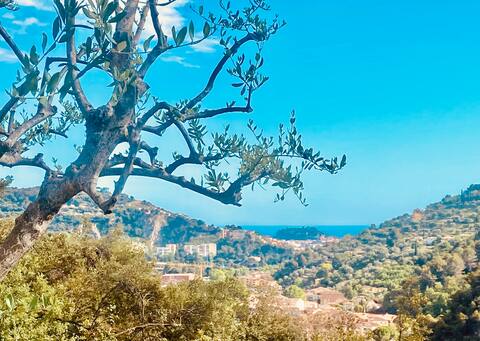
Best Areas for Airbnb Investment in Saint-André-de-la-Roche (2025)
Exploring the top neighborhoods for short-term rentals in Saint-André-de-la-Roche? This section highlights key areas, outlining why they are attractive for hosts and guests, along with notable local attractions. Consider these locations based on your target guest profile and investment strategy.
| Neighborhood / Area | Why Host Here? (Target Guests & Appeal) | Key Attractions & Landmarks |
|---|---|---|
| Village Center | The charming center of Saint-André-de-la-Roche, offering local shops, cafes, and a glimpse into the everyday life of the region. A peaceful yet vibrant atmosphere that attracts visitors wanting an authentic experience. | Local cafes, Markets, Historical buildings, Scenic views, Cultural events |
| Massif du Mont Boron | This area features stunning natural scenery and hiking trails, perfect for nature lovers and outdoor enthusiasts. It offers a tranquil escape from the bustle of the nearby city. | Hiking trails, Panoramic views of the coastline, Natural parks, Picnic areas, Wildlife |
| Nice | Located just a short drive away, Nice is a major tourist destination with beautiful beaches and a vibrant city life. It attracts a broad range of tourists, from families to luxury travelers. | Promenade des Anglais, Old Town (Vieux Nice), Castle Hill, Museums, Cultural festivals |
| Villefranche-sur-Mer | A picturesque coastal village known for its beautiful bay and charming old town. Perfect for visitors looking to relax by the sea and enjoy a slower pace. | Beaches, Old town, Fort du Mont Alban, Local restaurants, Marine culture |
| Eze | A medieval village perched on a hilltop, offering breathtaking views of the Mediterranean. It's popular for day trips and has a romantic atmosphere that attracts tourists. | Eze Village, Fragonard Perfume Factory, Botanical Garden, Scenic viewpoints, Art galleries |
| Menton | Known as the pearl of France, Menton has a Mediterranean charm with its gardens and mild climate. It's ideal for visitors looking to enjoy a beautiful coastal environment. | Lemon Festival, Beaches, Botanical Gardens, Old Town, Daily markets |
| Cap d'Ail | An area with stunning coastal views and access to beautiful beaches and luxury living. It's a popular spot for those looking for upscale vacation experiences. | Marquet Beach, Luxury villas, Coastal paths, Scenic drives, Skyline views |
| Lola Sagesse | A hidden gem known for its cultural events and local art scene. It's perfect for those seeking a unique experience away from the usual tourist spots. | Art galleries, Local theaters, Craft markets, Community events, Cultural festivals |
Understanding Airbnb License Requirements & STR Laws in Saint-André-de-la-Roche (2025)
With 13% of listings showing registration in 2025, understanding potential Airbnb license requirements is crucial in Saint-André-de-la-Roche. Always verify the latest short term rental regulations and Airbnb license requirements directly with local government authorities for Saint-André-de-la-Roche to ensure full compliance before hosting.
(Source: AirROI data, 2025, based on 13% licensed listings)
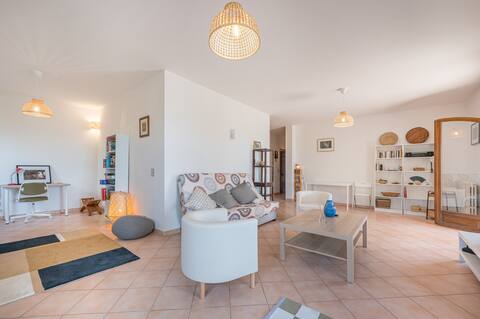
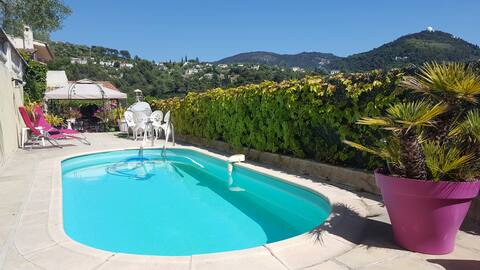
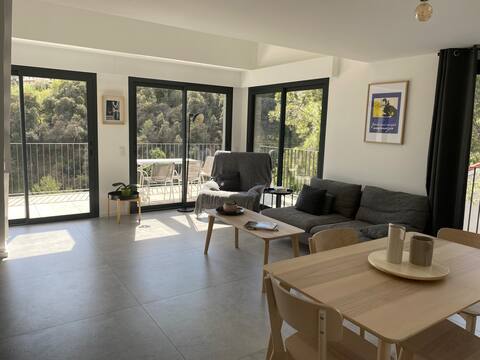
Top Performing Airbnb Properties in Saint-André-de-la-Roche (2025)
Benchmark your potential! Explore examples of top-performing Airbnb properties in Saint-André-de-la-Rochebased on Trailing Twelve Month (TTM) revenue. Analyze their characteristics, revenue, occupancy rate, and ADR to understand what drives success in this market.

Nice, Villa, Jacuzzi, Pool, Beautiful View
Entire Place • 4 bedrooms
House on the Nice hills
Entire Place • 3 bedrooms
Villa Cocooning with pool on the heights of Nice
Entire Place • 4 bedrooms
villa with pool and garden 15mn Nice center
Entire Place • 2 bedrooms
Bright large 3p in the heart of nature
Entire Place • 2 bedrooms
Entire Place • 2 bedrooms
Note: Performance varies based on location, size, amenities, seasonality, and management quality. Data reflects the past 12 months.
Top Performing Airbnb Hosts in Saint-André-de-la-Roche (2025)
Learn from the best! This table showcases top-performing Airbnb hosts in Saint-André-de-la-Roche based on the number of properties managed and estimated total revenue over the past year. Analyze their scale and performance metrics.
| Host Name | Properties | Grossing Revenue | Stay Reviews | Avg Rating |
|---|---|---|---|---|
| Elodie | 1 | $95,714 | 42 | 4.86/5.0 |
| Anne-Marie | 5 | $88,761 | 90 | 3.87/5.0 |
| Alexandre | 1 | $64,574 | 14 | 4.93/5.0 |
| Aurelie | 1 | $48,638 | 17 | 4.82/5.0 |
| Monique | 1 | $33,446 | 15 | 4.93/5.0 |
| Rita | 1 | $21,635 | 125 | 4.85/5.0 |
| Host #89161309 | 1 | $21,496 | 0 | 0.00/5.0 |
| Philippe | 1 | $20,957 | 29 | 4.86/5.0 |
| Isabelle | 1 | $19,772 | 94 | 4.94/5.0 |
| Marguerite | 1 | $13,491 | 70 | 4.89/5.0 |
Analyzing the strategies of top hosts, such as their property selection, pricing, and guest communication, can offer valuable lessons for optimizing your own Airbnb operations in Saint-André-de-la-Roche.
Dive Deeper: Advanced Saint-André-de-la-Roche STR Market Data (2025)
Ready to unlock more insights? AirROI provides access to advanced metrics and comprehensive Airbnb data for Saint-André-de-la-Roche. Explore detailed analytics beyond this report to refine your investment strategy, optimize pricing, and maximize your vacation rental profits.
Explore Advanced MetricsSaint-André-de-la-Roche Short-Term Rental Market Composition (2025): Property & Room Types
Room Type Distribution
Property Type Distribution
Market Composition Insights for Saint-André-de-la-Roche
- The Saint-André-de-la-Roche Airbnb market composition is heavily skewed towards Entire Home/Apt listings, which make up 82.6% of the 23 active rentals. This indicates strong guest preference for privacy and space.
- Looking at the property type distribution in Saint-André-de-la-Roche, Apartment/Condo properties are the most common (56.5%), reflecting the local real estate landscape.
- Houses represent a significant 39.1% portion, catering likely to families or larger groups.
- Smaller segments like hotel/boutique (combined 4.3%) offer potential for unique stay experiences.
Saint-André-de-la-Roche Airbnb Room Capacity Analysis (2025): Bedroom Distribution
Distribution of Listings by Number of Bedrooms
Room Capacity Insights for Saint-André-de-la-Roche
- The dominant room capacity in Saint-André-de-la-Roche is 2 bedrooms listings, making up 39.1% of the market. This suggests a strong demand for properties suitable for couples or solo travelers.
- Together, 2 bedrooms and 1 bedroom properties represent 69.5% of the active Airbnb listings in Saint-André-de-la-Roche, indicating a high concentration in these sizes.
Saint-André-de-la-Roche Vacation Rental Guest Capacity Trends (2025)
Distribution of Listings by Guest Capacity
Guest Capacity Insights for Saint-André-de-la-Roche
- The most common guest capacity trend in Saint-André-de-la-Roche vacation rentals is listings accommodating 4 guests (52.2%). This suggests the primary traveler segment is likely small families or groups.
- Properties designed for 4 guests and 8+ guests dominate the Saint-André-de-la-Roche STR market, accounting for 65.2% of listings.
- 21.6% of properties accommodate 6+ guests, serving the market segment for larger families or group travel in Saint-André-de-la-Roche.
- On average, properties in Saint-André-de-la-Roche are equipped to host 4.0 guests.
Saint-André-de-la-Roche Airbnb Booking Patterns (2025): Available vs. Booked Days
Available Days Distribution
Booked Days Distribution
Booking Pattern Insights for Saint-André-de-la-Roche
- The most common availability pattern in Saint-André-de-la-Roche falls within the 271-366 days range, representing 47.8% of listings. This suggests many properties have significant open periods on their calendars.
- Approximately 82.6% of listings show high availability (181+ days open annually), indicating potential for increased bookings or specific owner usage patterns.
- For booked days, the 31-90 days range is most frequent in Saint-André-de-la-Roche (43.5%), reflecting common guest stay durations or potential owner blocking patterns.
- A notable 17.4% of properties secure long booking periods (181+ days booked per year), highlighting successful long-term rental strategies or significant owner usage.
Saint-André-de-la-Roche Airbnb Minimum Stay Requirements Analysis
Distribution of Listings by Minimum Night Requirement
1 Night
1 listings
5% of total
2 Nights
6 listings
30% of total
3 Nights
6 listings
30% of total
4-6 Nights
5 listings
25% of total
7-29 Nights
2 listings
10% of total
Key Insights
- The most prevalent minimum stay requirement in Saint-André-de-la-Roche is 2 Nights, adopted by 30% of listings. This highlights the market's preference for shorter, flexible bookings.
Recommendations
- Align with the market by considering a 2 Nights minimum stay, as 30% of Saint-André-de-la-Roche hosts use this setting.
- If feasible, allowing 1-night stays, especially midweek or during low season, could capture last-minute bookings, as only 5% currently do.
- Adjust minimum nights based on seasonality – potentially shorter during low season and longer during peak demand periods in Saint-André-de-la-Roche.
Saint-André-de-la-Roche Airbnb Cancellation Policy Trends Analysis (2025)
Flexible
5 listings
25% of total
Moderate
4 listings
20% of total
Firm
5 listings
25% of total
Strict
6 listings
30% of total
Cancellation Policy Insights for Saint-André-de-la-Roche
- The prevailing Airbnb cancellation policy trend in Saint-André-de-la-Roche is Strict, used by 30% of listings.
- A majority (55.0%) of hosts in Saint-André-de-la-Roche utilize Firm or Strict policies, indicating a market where hosts prioritize booking security.
Recommendations for Hosts
- Consider adopting a Strict policy to align with the 30% market standard in Saint-André-de-la-Roche.
- Regularly review your cancellation policy against competitors and market demand shifts in Saint-André-de-la-Roche.
Saint-André-de-la-Roche STR Booking Lead Time Analysis (2025)
Average Booking Lead Time by Month
Booking Lead Time Insights for Saint-André-de-la-Roche
- The overall average booking lead time for vacation rentals in Saint-André-de-la-Roche is 52 days.
- Guests book furthest in advance for stays during July (average 81 days), likely coinciding with peak travel demand or local events.
- The shortest booking windows occur for stays in March (average 26 days), indicating more last-minute travel plans during this time.
- Seasonally, Summer (73 days avg.) sees the longest lead times, while Winter (44 days avg.) has the shortest, reflecting typical travel planning cycles.
Recommendations for Hosts
- Use the overall average lead time (52 days) as a baseline for your pricing and availability strategy in Saint-André-de-la-Roche.
- For July stays, consider implementing length-of-stay discounts or slightly higher rates for bookings made less than 81 days out to capitalize on advance planning.
- Target marketing efforts for the Summer season well in advance (at least 73 days) to capture early planners.
- Monitor your own booking lead times against these Saint-André-de-la-Roche averages to identify opportunities for dynamic pricing adjustments.
Popular & Essential Airbnb Amenities in Saint-André-de-la-Roche (2025)
Amenity Prevalence
Amenity Insights for Saint-André-de-la-Roche
- Essential amenities in Saint-André-de-la-Roche that guests expect include: Heating, Essentials, Dishes and silverware, Hair dryer, Bed linens, Kitchen, Washer, Hot water, Smoke alarm, TV. Lacking these (any) could significantly impact bookings.
Recommendations for Hosts
- Ensure your listing includes all essential amenities for Saint-André-de-la-Roche: Heating, Essentials, Dishes and silverware, Hair dryer, Bed linens, Kitchen, Washer, Hot water, Smoke alarm, TV.
- Prioritize adding missing essentials: Bed linens, Kitchen, Washer, Hot water, Smoke alarm, TV.
- Highlight unique or less common amenities you offer (e.g., hot tub, dedicated workspace, EV charger) in your listing description and photos.
- Regularly check competitor amenities in Saint-André-de-la-Roche to stay competitive.
Saint-André-de-la-Roche Airbnb Guest Demographics & Profile Analysis (2025)
Guest Profile Summary for Saint-André-de-la-Roche
- The typical guest profile for Airbnb in Saint-André-de-la-Roche consists of a mix of domestic (57%) and international guests, often arriving from nearby Paris, typically belonging to the Post-2000s (Gen Z/Alpha) group (50%), primarily speaking English or French.
- Domestic travelers account for 56.6% of guests.
- Key international markets include France (56.6%) and Germany (10.4%).
- Top languages spoken are English (36.1%) followed by French (30.9%).
- A significant demographic segment is the Post-2000s (Gen Z/Alpha) group, representing 50% of guests.
Recommendations for Hosts
- Balance marketing efforts between domestic and international channels based on the guest mix.
- Tailor amenities and listing descriptions to appeal to the dominant Post-2000s (Gen Z/Alpha) demographic (e.g., highlight fast WiFi, smart home features, local guides).
- Highlight unique local experiences or amenities relevant to the primary guest profile.
- Consider seasonal promotions aligned with peak travel times for key origin markets.
Nearby Short-Term Rental Market Comparison
How does the Saint-André-de-la-Roche Airbnb market stack up against its neighbors? Compare key performance metrics like average monthly revenue, ADR, and occupancy rates in surrounding areas to understand the broader regional STR landscape.
| Market | Active Properties | Monthly Revenue | Daily Rate | Avg. Occupancy |
|---|---|---|---|---|
| Monteu Roero | 16 | $4,432 | $540.14 | 36% |
| Ramatuelle | 213 | $3,891 | $670.10 | 41% |
| Saint-Jean-Cap-Ferrat | 107 | $3,844 | $424.21 | 46% |
| Cossano Belbo | 13 | $3,632 | $284.21 | 42% |
| Saint-Tropez | 742 | $3,498 | $506.57 | 41% |
| Cassinasco | 18 | $3,219 | $545.40 | 41% |
| Èze | 153 | $3,168 | $345.84 | 47% |
| Opio | 40 | $3,057 | $540.62 | 37% |
| Villefranche-sur-Mer | 501 | $2,977 | $268.57 | 52% |
| Gassin | 384 | $2,939 | $434.44 | 40% |