Néoules Airbnb Market Analysis 2025: Short Term Rental Data & Vacation Rental Statistics in Provence-Alpes-Côte d'Azur, France
Is Airbnb profitable in Néoules in 2025? Explore comprehensive Airbnb analytics for Néoules, Provence-Alpes-Côte d'Azur, France to uncover income potential. This 2025 STR market report for Néoules, based on AirROI data from April 2024 to March 2025, reveals key trends in the niche market of 19 active listings.
Whether you're considering an Airbnb investment in Néoules, optimizing your existing vacation rental, or exploring rental arbitrage opportunities, understanding the Néoules Airbnb data is crucial. Navigating the high regulation landscape is key to maximizing your short term rental income potential. Let's dive into the specifics.
Key Néoules Airbnb Performance Metrics Overview
Monthly Airbnb Revenue Variations & Income Potential in Néoules (2025)
Understanding the monthly revenue variations for Airbnb listings in Néoules is key to maximizing your short term rental income potential. Seasonality significantly impacts earnings. Our analysis, based on data from the past 12 months, shows that the peak revenue month for STRs in Néoules is typically August, while January often presents the lowest earnings, highlighting opportunities for strategic pricing adjustments during shoulder and low seasons. Explore the typical Airbnb income in Néoules across different performance tiers:
- Best-in-class properties (Top 10%) achieve $8,515+ monthly, often utilizing dynamic pricing and superior guest experiences.
- Strong performing properties (Top 25%) earn $3,425 or more, indicating effective management and desirable locations/amenities.
- Typical properties (Median) generate around $1,275 per month, representing the average market performance.
- Entry-level properties (Bottom 25%) see earnings around $724, often with potential for optimization.
Average Monthly Airbnb Earnings Trend in Néoules
Néoules Airbnb Occupancy Rate Trends (2025)
Maximize your bookings by understanding the Néoules STR occupancy trends. Seasonal demand shifts significantly influence how often properties are booked. Typically, Augustsees the highest demand (peak season occupancy), while January experiences the lowest (low season). Effective strategies, like adjusting minimum stays or offering promotions, can boost occupancy during slower periods. Here's how different property tiers perform in Néoules:
- Best-in-class properties (Top 10%) achieve 65%+ occupancy, indicating high desirability and potentially optimized availability.
- Strong performing properties (Top 25%) maintain 49% or higher occupancy, suggesting good market fit and guest satisfaction.
- Typical properties (Median) have an occupancy rate around 36%.
- Entry-level properties (Bottom 25%) average 20% occupancy, potentially facing higher vacancy.
Average Monthly Occupancy Rate Trend in Néoules
Average Daily Rate (ADR) Airbnb Trends in Néoules (2025)
Effective short term rental pricing strategy in Néoules involves understanding monthly ADR fluctuations. The Average Daily Rate (ADR) for Airbnb in Néoules typically peaks in July and dips lowest during April. Leveraging Airbnb dynamic pricing tools or strategies based on this seasonality can significantly boost revenue. Here's a look at the typical nightly rates achieved:
- Best-in-class properties (Top 10%) command rates of $355+ per night, often due to premium features or locations.
- Strong performing properties (Top 25%) achieve nightly rates of $263 or more.
- Typical properties (Median) charge around $155 per night.
- Entry-level properties (Bottom 25%) earn around $82 per night.
Average Daily Rate (ADR) Trend by Month in Néoules
Get Live Néoules Market Intelligence 👇

Explore Real-time Analytics
Airbnb Seasonality Analysis & Trends in Néoules (2025)
Peak Season (August, October, November)
- Revenue averages $5,410 per month
- Occupancy rates average 48.0%
- Daily rates average $222
Shoulder Season
- Revenue averages $2,665 per month
- Occupancy maintains around 39.8%
- Daily rates hold near $216
Low Season (January, February, December)
- Revenue drops to average $742 per month
- Occupancy decreases to average 17.7%
- Daily rates adjust to average $212
Seasonality Insights for Néoules
- The Airbnb seasonality in Néoules shows highly seasonal trends requiring careful strategy. While the sections above show seasonal averages, it's also insightful to look at the extremes:
- During the high season, the absolute peak month showcases Néoules's highest earning potential, with monthly revenues capable of climbing to $5,871, occupancy reaching a high of 82.1%, and ADRs peaking at $226.
- Conversely, the slowest single month of the year, typically falling within the low season, marks the market's lowest point. In this month, revenue might dip to $551, occupancy could drop to 10.8%, and ADRs may adjust down to $207.
- Understanding both the seasonal averages and these monthly peaks and troughs in revenue, occupancy, and ADR is crucial for maximizing your Airbnb profit potential in Néoules.
Seasonal Strategies for Maximizing Profit
- Peak Season: Maximize revenue through premium pricing and potentially longer minimum stays. Ensure high availability.
- Low Season: Offer competitive pricing, special promotions (e.g., extended stay discounts), and flexible cancellation policies. Target off-season travelers like remote workers or budget-conscious guests.
- Shoulder Seasons: Implement dynamic pricing that balances peak and low rates. Target weekend travelers or specific events. Offer slightly more flexible terms than peak season.
- Regularly analyze your own performance against these Néoules seasonality benchmarks and adjust your pricing and availability strategy accordingly.
Best Areas for Airbnb Investment in Néoules (2025)
Exploring the top neighborhoods for short-term rentals in Néoules? This section highlights key areas, outlining why they are attractive for hosts and guests, along with notable local attractions. Consider these locations based on your target guest profile and investment strategy.
| Neighborhood / Area | Why Host Here? (Target Guests & Appeal) | Key Attractions & Landmarks |
|---|---|---|
| Bormes-les-Mimosas | A charming coastal village known for its beautiful beaches and Mediterranean ambiance. Popular among tourists seeking relaxation and scenic views. | Bormes Beach, Fort de Brégançon, Le Lavandou, Plage de la Favière, Sentier du Littoral |
| Cavalaire-sur-Mer | A picturesque town famous for its sandy beaches and vibrant marina. Ideal for beach lovers and water sports enthusiasts. | Cavalaire Beach, La Croix Valmer, Les Écoles de Plongée, Plage de Bonporteau, Sentier du Littoral |
| La Londe-les-Maures | A lovely town being a gateway to the vineyards and natural parks. Great for visitors interested in wine tourism and outdoor activities. | L'Estagnol Beach, Les Salins d'Hyeres, Domaine de la Sanglière, La Londe Harbour]},{ |
N/A | ||
N/A | ||
N/A |
Understanding Airbnb License Requirements & STR Laws in Néoules (2025)
Yes, Néoules, Provence-Alpes-Côte d'Azur, France enforces high STR regulations. Obtaining a license and ensuring compliance is almost certainly required according to current 2025 STR laws. Always verify the latest short term rental regulations and Airbnb license requirements directly with local government authorities for Néoules to ensure full compliance before hosting.
(Source: AirROI data, 2025, based on 84% licensed listings)
Top Performing Airbnb Properties in Néoules (2025)
Benchmark your potential! Explore examples of top-performing Airbnb properties in Néoulesbased on Trailing Twelve Month (TTM) revenue. Analyze their characteristics, revenue, occupancy rate, and ADR to understand what drives success in this market.
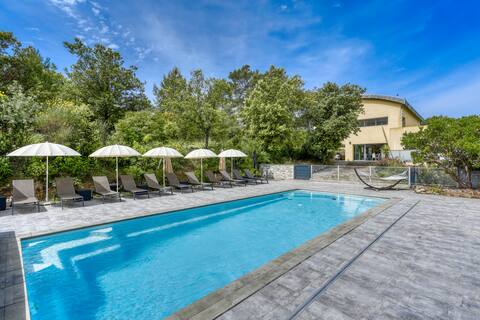
Mas de L’Esteloun - Piscine chauffée et Jacuzzi
Entire Place • 8 bedrooms
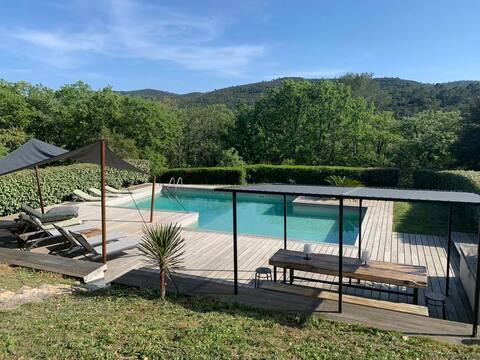
Provencal villa with tennis, swimming pool, and jacuzzi
Entire Place • 5 bedrooms
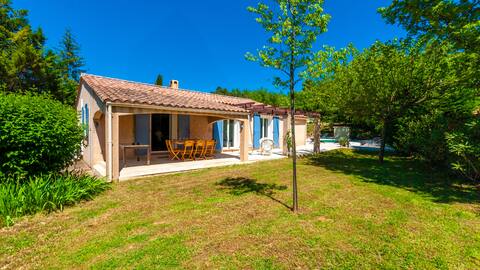
L 'oustaoù relaxation space in Provence Verte
Entire Place • 3 bedrooms

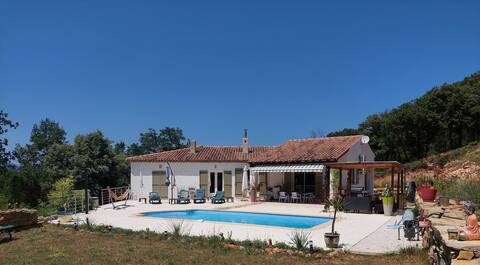
Leaning oaks in Provence.
Entire Place • 3 bedrooms
Quiet villa in Provence
Entire Place • 2 bedrooms
Villa Du Soleil in Néoules, with its swimming pool.
Entire Place • 1 bedroom
Note: Performance varies based on location, size, amenities, seasonality, and management quality. Data reflects the past 12 months.
Top Performing Airbnb Hosts in Néoules (2025)
Learn from the best! This table showcases top-performing Airbnb hosts in Néoules based on the number of properties managed and estimated total revenue over the past year. Analyze their scale and performance metrics.
| Host Name | Properties | Grossing Revenue | Stay Reviews | Avg Rating |
|---|---|---|---|---|
| Host #78406951 | 1 | $169,977 | 53 | 4.70/5.0 |
| Jonas | 1 | $42,435 | 6 | 5.00/5.0 |
| Laurie | 2 | $31,563 | 101 | 4.93/5.0 |
| Marie | 1 | $23,694 | 15 | 4.67/5.0 |
| Antoine | 1 | $21,768 | 3 | 5.00/5.0 |
| Serge Et Elisabeth | 1 | $21,223 | 6 | 4.50/5.0 |
| Anita | 1 | $19,896 | 28 | 4.96/5.0 |
| Laura | 1 | $15,558 | 32 | 4.91/5.0 |
| Cécile | 1 | $15,086 | 34 | 4.94/5.0 |
| Michele | 1 | $14,854 | 8 | 4.88/5.0 |
Analyzing the strategies of top hosts, such as their property selection, pricing, and guest communication, can offer valuable lessons for optimizing your own Airbnb operations in Néoules.
Dive Deeper: Advanced Néoules STR Market Data (2025)
Ready to unlock more insights? AirROI provides access to advanced metrics and comprehensive Airbnb data for Néoules. Explore detailed analytics beyond this report to refine your investment strategy, optimize pricing, and maximize your vacation rental profits.
Explore Advanced MetricsNéoules Short-Term Rental Market Composition (2025): Property & Room Types
Room Type Distribution
Property Type Distribution
Market Composition Insights for Néoules
- The Néoules Airbnb market composition is heavily skewed towards Entire Home/Apt listings, which make up 94.7% of the 19 active rentals. This indicates strong guest preference for privacy and space.
- Looking at the property type distribution in Néoules, House properties are the most common (57.9%), reflecting the local real estate landscape.
- Houses represent a significant 57.9% portion, catering likely to families or larger groups.
- The presence of 15.8% Hotel/Boutique listings indicates integration with traditional hospitality.
Néoules Airbnb Room Capacity Analysis (2025): Bedroom Distribution
Distribution of Listings by Number of Bedrooms
Room Capacity Insights for Néoules
- The dominant room capacity in Néoules is 1 bedroom listings, making up 31.6% of the market. This suggests a strong demand for properties suitable for couples or solo travelers.
- Together, 1 bedroom and 2 bedrooms properties represent 52.7% of the active Airbnb listings in Néoules, indicating a high concentration in these sizes.
- A significant 36.8% of listings offer 3+ bedrooms, catering to larger groups and families seeking more space in Néoules.
Néoules Vacation Rental Guest Capacity Trends (2025)
Distribution of Listings by Guest Capacity
Guest Capacity Insights for Néoules
- The most common guest capacity trend in Néoules vacation rentals is listings accommodating 8+ guests (26.3%). This suggests the primary traveler segment is likely larger groups.
- Properties designed for 8+ guests and 6 guests dominate the Néoules STR market, accounting for 47.4% of listings.
- 47.4% of properties accommodate 6+ guests, serving the market segment for larger families or group travel in Néoules.
- On average, properties in Néoules are equipped to host 5.0 guests.
Néoules Airbnb Booking Patterns (2025): Available vs. Booked Days
Available Days Distribution
Booked Days Distribution
Booking Pattern Insights for Néoules
- The most common availability pattern in Néoules falls within the 271-366 days range, representing 47.4% of listings. This suggests many properties have significant open periods on their calendars.
- Approximately 89.5% of listings show high availability (181+ days open annually), indicating potential for increased bookings or specific owner usage patterns.
- For booked days, the 31-90 days range is most frequent in Néoules (47.4%), reflecting common guest stay durations or potential owner blocking patterns.
- A notable 10.5% of properties secure long booking periods (181+ days booked per year), highlighting successful long-term rental strategies or significant owner usage.
Néoules Airbnb Minimum Stay Requirements Analysis
Distribution of Listings by Minimum Night Requirement
1 Night
4 listings
21.1% of total
2 Nights
5 listings
26.3% of total
3 Nights
3 listings
15.8% of total
4-6 Nights
1 listings
5.3% of total
7-29 Nights
5 listings
26.3% of total
30+ Nights
1 listings
5.3% of total
Key Insights
- The most prevalent minimum stay requirement in Néoules is 2 Nights, adopted by 26.3% of listings. This highlights the market's preference for shorter, flexible bookings.
Recommendations
- Align with the market by considering a 2 Nights minimum stay, as 26.3% of Néoules hosts use this setting.
- If feasible, allowing 1-night stays, especially midweek or during low season, could capture last-minute bookings, as only 21.1% currently do.
- Explore offering discounts for stays of 30+ nights to attract the 5.3% of the market seeking extended stays.
- Adjust minimum nights based on seasonality – potentially shorter during low season and longer during peak demand periods in Néoules.
Néoules Airbnb Cancellation Policy Trends Analysis (2025)
Flexible
3 listings
16.7% of total
Moderate
3 listings
16.7% of total
Firm
8 listings
44.4% of total
Strict
4 listings
22.2% of total
Cancellation Policy Insights for Néoules
- The prevailing Airbnb cancellation policy trend in Néoules is Firm, used by 44.4% of listings.
- A majority (66.6%) of hosts in Néoules utilize Firm or Strict policies, indicating a market where hosts prioritize booking security.
Recommendations for Hosts
- Consider adopting a Firm policy to align with the 44.4% market standard in Néoules.
- Regularly review your cancellation policy against competitors and market demand shifts in Néoules.
Néoules STR Booking Lead Time Analysis (2025)
Average Booking Lead Time by Month
Booking Lead Time Insights for Néoules
- The overall average booking lead time for vacation rentals in Néoules is 79 days.
- Guests book furthest in advance for stays during June (average 130 days), likely coinciding with peak travel demand or local events.
- The shortest booking windows occur for stays in January (average 13 days), indicating more last-minute travel plans during this time.
- Seasonally, Summer (116 days avg.) sees the longest lead times, while Winter (18 days avg.) has the shortest, reflecting typical travel planning cycles.
Recommendations for Hosts
- Use the overall average lead time (79 days) as a baseline for your pricing and availability strategy in Néoules.
- For June stays, consider implementing length-of-stay discounts or slightly higher rates for bookings made less than 130 days out to capitalize on advance planning.
- During January, focus on last-minute booking availability and promotions, as guests book with very short notice (13 days avg.).
- Target marketing efforts for the Summer season well in advance (at least 116 days) to capture early planners.
- Monitor your own booking lead times against these Néoules averages to identify opportunities for dynamic pricing adjustments.
Popular & Essential Airbnb Amenities in Néoules (2025)
Amenity Prevalence
Amenity Insights for Néoules
- Essential amenities in Néoules that guests expect include: Outdoor dining area, Hangers, Wifi, Free parking on premises. Lacking these (any) could significantly impact bookings.
- Popular amenities like Outdoor furniture, Kitchen, Dishes and silverware are common but not universal. Offering these can provide a competitive edge.
Recommendations for Hosts
- Ensure your listing includes all essential amenities for Néoules: Outdoor dining area, Hangers, Wifi, Free parking on premises.
- Consider adding popular differentiators like Outdoor furniture or Kitchen to increase appeal.
- Highlight unique or less common amenities you offer (e.g., hot tub, dedicated workspace, EV charger) in your listing description and photos.
- Regularly check competitor amenities in Néoules to stay competitive.
Néoules Airbnb Guest Demographics & Profile Analysis (2025)
Guest Profile Summary for Néoules
- The typical guest profile for Airbnb in Néoules consists of primarily domestic travelers (73%), often arriving from nearby Nice, typically belonging to the Post-2000s (Gen Z/Alpha) group (50%), primarily speaking French or English.
- Domestic travelers account for 72.5% of guests.
- Key international markets include France (72.5%) and Germany (8.8%).
- Top languages spoken are French (38.7%) followed by English (34.7%).
- A significant demographic segment is the Post-2000s (Gen Z/Alpha) group, representing 50% of guests.
Recommendations for Hosts
- Target domestic marketing efforts towards travelers from Nice and Paris.
- Tailor amenities and listing descriptions to appeal to the dominant Post-2000s (Gen Z/Alpha) demographic (e.g., highlight fast WiFi, smart home features, local guides).
- Highlight unique local experiences or amenities relevant to the primary guest profile.
- Consider seasonal promotions aligned with peak travel times for key origin markets.
Nearby Short-Term Rental Market Comparison
How does the Néoules Airbnb market stack up against its neighbors? Compare key performance metrics like average monthly revenue, ADR, and occupancy rates in surrounding areas to understand the broader regional STR landscape.
| Market | Active Properties | Monthly Revenue | Daily Rate | Avg. Occupancy |
|---|---|---|---|---|
| Monteu Roero | 16 | $4,432 | $540.14 | 36% |
| Ramatuelle | 213 | $3,891 | $670.10 | 41% |
| Saint-Jean-Cap-Ferrat | 107 | $3,844 | $424.21 | 46% |
| Saint-Tropez | 742 | $3,498 | $506.57 | 41% |
| Èze | 153 | $3,168 | $345.84 | 47% |
| Chantepérier | 20 | $3,057 | $281.60 | 37% |
| Opio | 40 | $3,057 | $540.62 | 37% |
| Villefranche-sur-Mer | 501 | $2,977 | $268.57 | 52% |
| Gassin | 384 | $2,939 | $434.44 | 40% |
| Gordes | 225 | $2,913 | $366.32 | 43% |