Murs Airbnb Market Analysis 2025: Short Term Rental Data & Vacation Rental Statistics in Provence-Alpes-Côte d'Azur, France
Is Airbnb profitable in Murs in 2025? Explore comprehensive Airbnb analytics for Murs, Provence-Alpes-Côte d'Azur, France to uncover income potential. This 2025 STR market report for Murs, based on AirROI data from April 2024 to March 2025, reveals key trends in the niche market of 33 active listings.
Whether you're considering an Airbnb investment in Murs, optimizing your existing vacation rental, or exploring rental arbitrage opportunities, understanding the Murs Airbnb data is crucial. Leveraging the low regulation environment is key to maximizing your short term rental income potential. Let's dive into the specifics.
Key Murs Airbnb Performance Metrics Overview
Monthly Airbnb Revenue Variations & Income Potential in Murs (2025)
Understanding the monthly revenue variations for Airbnb listings in Murs is key to maximizing your short term rental income potential. Seasonality significantly impacts earnings. Our analysis, based on data from the past 12 months, shows that the peak revenue month for STRs in Murs is typically August, while December often presents the lowest earnings, highlighting opportunities for strategic pricing adjustments during shoulder and low seasons. Explore the typical Airbnb income in Murs across different performance tiers:
- Best-in-class properties (Top 10%) achieve $9,002+ monthly, often utilizing dynamic pricing and superior guest experiences.
- Strong performing properties (Top 25%) earn $4,747 or more, indicating effective management and desirable locations/amenities.
- Typical properties (Median) generate around $2,208 per month, representing the average market performance.
- Entry-level properties (Bottom 25%) see earnings around $1,108, often with potential for optimization.
Average Monthly Airbnb Earnings Trend in Murs
Murs Airbnb Occupancy Rate Trends (2025)
Maximize your bookings by understanding the Murs STR occupancy trends. Seasonal demand shifts significantly influence how often properties are booked. Typically, Augustsees the highest demand (peak season occupancy), while March experiences the lowest (low season). Effective strategies, like adjusting minimum stays or offering promotions, can boost occupancy during slower periods. Here's how different property tiers perform in Murs:
- Best-in-class properties (Top 10%) achieve 72%+ occupancy, indicating high desirability and potentially optimized availability.
- Strong performing properties (Top 25%) maintain 52% or higher occupancy, suggesting good market fit and guest satisfaction.
- Typical properties (Median) have an occupancy rate around 30%.
- Entry-level properties (Bottom 25%) average 18% occupancy, potentially facing higher vacancy.
Average Monthly Occupancy Rate Trend in Murs
Average Daily Rate (ADR) Airbnb Trends in Murs (2025)
Effective short term rental pricing strategy in Murs involves understanding monthly ADR fluctuations. The Average Daily Rate (ADR) for Airbnb in Murs typically peaks in August and dips lowest during March. Leveraging Airbnb dynamic pricing tools or strategies based on this seasonality can significantly boost revenue. Here's a look at the typical nightly rates achieved:
- Best-in-class properties (Top 10%) command rates of $767+ per night, often due to premium features or locations.
- Strong performing properties (Top 25%) achieve nightly rates of $484 or more.
- Typical properties (Median) charge around $225 per night.
- Entry-level properties (Bottom 25%) earn around $131 per night.
Average Daily Rate (ADR) Trend by Month in Murs
Get Live Murs Market Intelligence 👇
Explore Real-time Analytics
Airbnb Seasonality Analysis & Trends in Murs (2025)
Peak Season (August, July, May)
- Revenue averages $5,978 per month
- Occupancy rates average 52.6%
- Daily rates average $400
Shoulder Season
- Revenue averages $3,437 per month
- Occupancy maintains around 37.6%
- Daily rates hold near $358
Low Season (February, March, December)
- Revenue drops to average $1,500 per month
- Occupancy decreases to average 20.0%
- Daily rates adjust to average $279
Seasonality Insights for Murs
- The Airbnb seasonality in Murs shows highly seasonal trends requiring careful strategy. While the sections above show seasonal averages, it's also insightful to look at the extremes:
- During the high season, the absolute peak month showcases Murs's highest earning potential, with monthly revenues capable of climbing to $7,126, occupancy reaching a high of 57.3%, and ADRs peaking at $403.
- Conversely, the slowest single month of the year, typically falling within the low season, marks the market's lowest point. In this month, revenue might dip to $1,181, occupancy could drop to 14.8%, and ADRs may adjust down to $274.
- Understanding both the seasonal averages and these monthly peaks and troughs in revenue, occupancy, and ADR is crucial for maximizing your Airbnb profit potential in Murs.
Seasonal Strategies for Maximizing Profit
- Peak Season: Maximize revenue through premium pricing and potentially longer minimum stays. Ensure high availability.
- Low Season: Offer competitive pricing, special promotions (e.g., extended stay discounts), and flexible cancellation policies. Target off-season travelers like remote workers or budget-conscious guests.
- Shoulder Seasons: Implement dynamic pricing that balances peak and low rates. Target weekend travelers or specific events. Offer slightly more flexible terms than peak season.
- Regularly analyze your own performance against these Murs seasonality benchmarks and adjust your pricing and availability strategy accordingly.
Best Areas for Airbnb Investment in Murs (2025)
Exploring the top neighborhoods for short-term rentals in Murs? This section highlights key areas, outlining why they are attractive for hosts and guests, along with notable local attractions. Consider these locations based on your target guest profile and investment strategy.
| Neighborhood / Area | Why Host Here? (Target Guests & Appeal) | Key Attractions & Landmarks |
|---|---|---|
| Murs Village Center | A charming Provençal village with picturesque streets and traditional architecture. Ideal for tourists looking to experience authentic rural France with local markets and small cafés. | Saint Michel Church, Local markets, Provence countryside, Nearby vineyards, Culinary workshops |
| Gordes | One of the most beautiful villages in France, perched on a hilltop with stunning views and historic architecture. A favorite among tourists for its beauty and proximity to other medieval sites. | Gordes Castle, Lavender fields, Village of Bories, Senanque Abbey, Art galleries |
| Roussillon | Famous for its ochre cliffs and beautiful scenery, Roussillon attracts visitors looking for art and nature. Great for hikers and artists seeking inspiration. | Ochre trail, Roussillon Village, Artisan shops, Vineyards, Scenic lookout points |
| L'Isle-sur-la-Sorgue | Known as the Venice of Provence, this town is famous for its antique markets and stunning waterways, drawing many visitors looking for unique finds and scenic beauty. | Antique market, Sorgue River, Local cafés, Isle-sur-la-Sorgue Sunday Market, Cultural festivals |
| Bonnieux | A picturesque village with lush landscapes and a rich history, perfect for visitors wanting to explore local culture and nature. | Bonnieux Church, Bicycle tours, Lavender fields, Vineyards, Historic olive mills |
| Apt | Situated in the heart of the Luberon, Apt is known for its historic heritage and proximity to lavender fields, making it a popular stop for tourists. | Apt Market, Lavender Museum, Cathedral of Saint-Anne, Scenic viewpoints, Nearby hiking trails |
| Pertuis | A lively town with a good mix of urban and rural charm, close to Lyon and other larger cities, making it a convenient base for exploring Provence. | Château de la Reine Jeanne, Local festivals, Wine tours, Nature parks, Historic sites |
| Cavaillon | Known for its cantaloupe and local produce, Cavaillon has a vibrant market and is close to many attractions in the Luberon region, appealing to foodie travelers. | Cavaillon Market, Saint Jacques Cathedral, Nearby vineyards, Provençal olive oil mills, Countryside activities |
Understanding Airbnb License Requirements & STR Laws in Murs (2025)
While Murs, Provence-Alpes-Côte d'Azur, France currently shows low STR regulations, specific Airbnb license requirements might still exist or change. Always verify the latest short term rental regulations and Airbnb license requirements directly with local government authorities for Murs to ensure full compliance before hosting.
(Source: AirROI data, 2025, finding no licensed listings among those analyzed)
Top Performing Airbnb Properties in Murs (2025)
Benchmark your potential! Explore examples of top-performing Airbnb properties in Mursbased on Trailing Twelve Month (TTM) revenue. Analyze their characteristics, revenue, occupancy rate, and ADR to understand what drives success in this market.

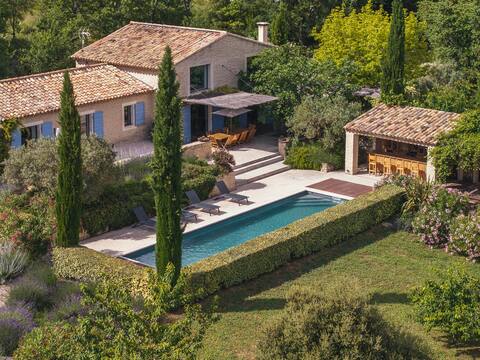
Villa Piscine Exceptional view
Entire Place • 5 bedrooms
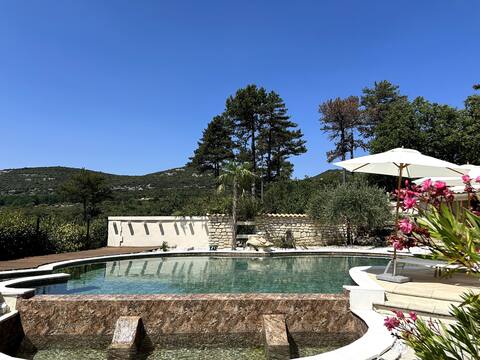
Beautiful Provencal Mas, between Gordes and Roussillon
Entire Place • 4 bedrooms
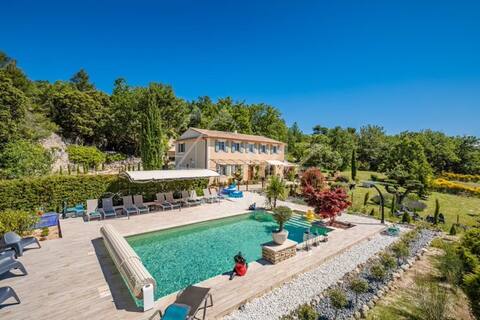
Maison provençale vue sur le Luberon, calme absolu
Entire Place • 5 bedrooms
Bastide provençale a Murs ( Gordes) Luberon
Entire Place • 5 bedrooms
Charming stone home
Entire Place • 3 bedrooms
Le Jas Gabriel 3*
Entire Place • 3 bedrooms
Note: Performance varies based on location, size, amenities, seasonality, and management quality. Data reflects the past 12 months.
Top Performing Airbnb Hosts in Murs (2025)
Learn from the best! This table showcases top-performing Airbnb hosts in Murs based on the number of properties managed and estimated total revenue over the past year. Analyze their scale and performance metrics.
| Host Name | Properties | Grossing Revenue | Stay Reviews | Avg Rating |
|---|---|---|---|---|
| Sophie | 1 | $110,782 | 6 | 4.83/5.0 |
| Pauline | 1 | $96,672 | 17 | 5.00/5.0 |
| Host #198145343 | 1 | $59,318 | 0 | 0.00/5.0 |
| Remy | 1 | $56,788 | 6 | 5.00/5.0 |
| Laure | 1 | $42,933 | 16 | 5.00/5.0 |
| Thierry | 1 | $40,423 | 14 | 5.00/5.0 |
| Host #445650021 | 1 | $32,411 | 0 | 0.00/5.0 |
| Laurence | 1 | $25,277 | 84 | 4.85/5.0 |
| Laetitia | 1 | $24,362 | 16 | 5.00/5.0 |
| Host #252920101 | 1 | $23,687 | 0 | 0.00/5.0 |
Analyzing the strategies of top hosts, such as their property selection, pricing, and guest communication, can offer valuable lessons for optimizing your own Airbnb operations in Murs.
Dive Deeper: Advanced Murs STR Market Data (2025)
Ready to unlock more insights? AirROI provides access to advanced metrics and comprehensive Airbnb data for Murs. Explore detailed analytics beyond this report to refine your investment strategy, optimize pricing, and maximize your vacation rental profits.
Explore Advanced MetricsMurs Short-Term Rental Market Composition (2025): Property & Room Types
Room Type Distribution
Property Type Distribution
Market Composition Insights for Murs
- The Murs Airbnb market composition is heavily skewed towards Entire Home/Apt listings, which make up 90.9% of the 33 active rentals. This indicates strong guest preference for privacy and space.
- Looking at the property type distribution in Murs, House properties are the most common (75.8%), reflecting the local real estate landscape.
- Houses represent a significant 75.8% portion, catering likely to families or larger groups.
- The presence of 12.1% Hotel/Boutique listings indicates integration with traditional hospitality.
Murs Airbnb Room Capacity Analysis (2025): Bedroom Distribution
Distribution of Listings by Number of Bedrooms
Room Capacity Insights for Murs
- The dominant room capacity in Murs is 1 bedroom listings, making up 36.4% of the market. This suggests a strong demand for properties suitable for couples or solo travelers.
- Together, 1 bedroom and 4 bedrooms properties represent 60.6% of the active Airbnb listings in Murs, indicating a high concentration in these sizes.
- A significant 51.5% of listings offer 3+ bedrooms, catering to larger groups and families seeking more space in Murs.
Murs Vacation Rental Guest Capacity Trends (2025)
Distribution of Listings by Guest Capacity
Guest Capacity Insights for Murs
- The most common guest capacity trend in Murs vacation rentals is listings accommodating 8+ guests (30.3%). This suggests the primary traveler segment is likely larger groups.
- Properties designed for 8+ guests and 2 guests dominate the Murs STR market, accounting for 54.5% of listings.
- 54.6% of properties accommodate 6+ guests, serving the market segment for larger families or group travel in Murs.
- On average, properties in Murs are equipped to host 5.2 guests.
Murs Airbnb Booking Patterns (2025): Available vs. Booked Days
Available Days Distribution
Booked Days Distribution
Booking Pattern Insights for Murs
- The most common availability pattern in Murs falls within the 271-366 days range, representing 66.7% of listings. This suggests many properties have significant open periods on their calendars.
- Approximately 97.0% of listings show high availability (181+ days open annually), indicating potential for increased bookings or specific owner usage patterns.
- For booked days, the 31-90 days range is most frequent in Murs (39.4%), reflecting common guest stay durations or potential owner blocking patterns.
- A notable 3.0% of properties secure long booking periods (181+ days booked per year), highlighting successful long-term rental strategies or significant owner usage.
Murs Airbnb Minimum Stay Requirements Analysis
Distribution of Listings by Minimum Night Requirement
1 Night
2 listings
6.1% of total
2 Nights
6 listings
18.2% of total
3 Nights
10 listings
30.3% of total
4-6 Nights
6 listings
18.2% of total
7-29 Nights
9 listings
27.3% of total
Key Insights
- The most prevalent minimum stay requirement in Murs is 3 Nights, adopted by 30.3% of listings. This highlights the market's preference for longer commitments.
Recommendations
- Align with the market by considering a 3 Nights minimum stay, as 30.3% of Murs hosts use this setting.
- If feasible, allowing 1-night stays, especially midweek or during low season, could capture last-minute bookings, as only 6.1% currently do.
- Adjust minimum nights based on seasonality – potentially shorter during low season and longer during peak demand periods in Murs.
Murs Airbnb Cancellation Policy Trends Analysis (2025)
Flexible
3 listings
13.6% of total
Moderate
6 listings
27.3% of total
Firm
6 listings
27.3% of total
Strict
7 listings
31.8% of total
Cancellation Policy Insights for Murs
- The prevailing Airbnb cancellation policy trend in Murs is Strict, used by 31.8% of listings.
- A majority (59.1%) of hosts in Murs utilize Firm or Strict policies, indicating a market where hosts prioritize booking security.
Recommendations for Hosts
- Consider adopting a Strict policy to align with the 31.8% market standard in Murs.
- With 31.8% using Strict terms, this is a viable option in Murs, particularly for high-value properties or during peak demand periods.
- Regularly review your cancellation policy against competitors and market demand shifts in Murs.
Murs STR Booking Lead Time Analysis (2025)
Average Booking Lead Time by Month
Booking Lead Time Insights for Murs
- The overall average booking lead time for vacation rentals in Murs is 63 days.
- Guests book furthest in advance for stays during July (average 142 days), likely coinciding with peak travel demand or local events.
- The shortest booking windows occur for stays in March (average 12 days), indicating more last-minute travel plans during this time.
- Seasonally, Summer (120 days avg.) sees the longest lead times, while Winter (59 days avg.) has the shortest, reflecting typical travel planning cycles.
Recommendations for Hosts
- Use the overall average lead time (63 days) as a baseline for your pricing and availability strategy in Murs.
- For July stays, consider implementing length-of-stay discounts or slightly higher rates for bookings made less than 142 days out to capitalize on advance planning.
- During March, focus on last-minute booking availability and promotions, as guests book with very short notice (12 days avg.).
- Target marketing efforts for the Summer season well in advance (at least 120 days) to capture early planners.
- Monitor your own booking lead times against these Murs averages to identify opportunities for dynamic pricing adjustments.
Popular & Essential Airbnb Amenities in Murs (2025)
Amenity Prevalence
Amenity Insights for Murs
- Essential amenities in Murs that guests expect include: Free parking on premises, Heating, TV, Wifi. Lacking these (any) could significantly impact bookings.
- Popular amenities like Kitchen, Washer, Smoke alarm are common but not universal. Offering these can provide a competitive edge.
Recommendations for Hosts
- Ensure your listing includes all essential amenities for Murs: Free parking on premises, Heating, TV, Wifi.
- Prioritize adding missing essentials: Wifi.
- Consider adding popular differentiators like Kitchen or Washer to increase appeal.
- Highlight unique or less common amenities you offer (e.g., hot tub, dedicated workspace, EV charger) in your listing description and photos.
- Regularly check competitor amenities in Murs to stay competitive.
Murs Airbnb Guest Demographics & Profile Analysis (2025)
Guest Profile Summary for Murs
- The typical guest profile for Airbnb in Murs consists of a mix of domestic (54%) and international guests, often arriving from nearby Paris, typically belonging to the Post-2000s (Gen Z/Alpha) group (50%), primarily speaking English or French.
- Domestic travelers account for 53.7% of guests.
- Key international markets include France (53.7%) and Germany (12.2%).
- Top languages spoken are English (34.9%) followed by French (32.5%).
- A significant demographic segment is the Post-2000s (Gen Z/Alpha) group, representing 50% of guests.
Recommendations for Hosts
- Balance marketing efforts between domestic and international channels based on the guest mix.
- Tailor amenities and listing descriptions to appeal to the dominant Post-2000s (Gen Z/Alpha) demographic (e.g., highlight fast WiFi, smart home features, local guides).
- Highlight unique local experiences or amenities relevant to the primary guest profile.
- Consider seasonal promotions aligned with peak travel times for key origin markets.
Nearby Short-Term Rental Market Comparison
How does the Murs Airbnb market stack up against its neighbors? Compare key performance metrics like average monthly revenue, ADR, and occupancy rates in surrounding areas to understand the broader regional STR landscape.
| Market | Active Properties | Monthly Revenue | Daily Rate | Avg. Occupancy |
|---|---|---|---|---|
| Divajeu | 19 | $3,941 | $410.65 | 42% |
| Ramatuelle | 213 | $3,891 | $670.10 | 41% |
| Saint-Tropez | 742 | $3,498 | $506.57 | 41% |
| Chantepérier | 20 | $3,057 | $281.60 | 37% |
| Opio | 40 | $3,057 | $540.62 | 37% |
| Gassin | 384 | $2,939 | $434.44 | 40% |
| Gordes | 225 | $2,913 | $366.32 | 43% |
| Redessan | 19 | $2,834 | $334.82 | 34% |
| Fontarèches | 11 | $2,802 | $525.31 | 34% |
| Ménerbes | 97 | $2,800 | $453.86 | 41% |