Mons Airbnb Market Analysis 2025: Short Term Rental Data & Vacation Rental Statistics in Provence-Alpes-Côte d'Azur, France
Is Airbnb profitable in Mons in 2025? Explore comprehensive Airbnb analytics for Mons, Provence-Alpes-Côte d'Azur, France to uncover income potential. This 2025 STR market report for Mons, based on AirROI data from April 2024 to March 2025, reveals key trends in the niche market of 20 active listings.
Whether you're considering an Airbnb investment in Mons, optimizing your existing vacation rental, or exploring rental arbitrage opportunities, understanding the Mons Airbnb data is crucial. Leveraging the low regulation environment is key to maximizing your short term rental income potential. Let's dive into the specifics.
Key Mons Airbnb Performance Metrics Overview
Monthly Airbnb Revenue Variations & Income Potential in Mons (2025)
Understanding the monthly revenue variations for Airbnb listings in Mons is key to maximizing your short term rental income potential. Seasonality significantly impacts earnings. Our analysis, based on data from the past 12 months, shows that the peak revenue month for STRs in Mons is typically August, while January often presents the lowest earnings, highlighting opportunities for strategic pricing adjustments during shoulder and low seasons. Explore the typical Airbnb income in Mons across different performance tiers:
- Best-in-class properties (Top 10%) achieve $3,624+ monthly, often utilizing dynamic pricing and superior guest experiences.
- Strong performing properties (Top 25%) earn $2,260 or more, indicating effective management and desirable locations/amenities.
- Typical properties (Median) generate around $1,028 per month, representing the average market performance.
- Entry-level properties (Bottom 25%) see earnings around $636, often with potential for optimization.
Average Monthly Airbnb Earnings Trend in Mons
Mons Airbnb Occupancy Rate Trends (2025)
Maximize your bookings by understanding the Mons STR occupancy trends. Seasonal demand shifts significantly influence how often properties are booked. Typically, Augustsees the highest demand (peak season occupancy), while January experiences the lowest (low season). Effective strategies, like adjusting minimum stays or offering promotions, can boost occupancy during slower periods. Here's how different property tiers perform in Mons:
- Best-in-class properties (Top 10%) achieve 61%+ occupancy, indicating high desirability and potentially optimized availability.
- Strong performing properties (Top 25%) maintain 41% or higher occupancy, suggesting good market fit and guest satisfaction.
- Typical properties (Median) have an occupancy rate around 27%.
- Entry-level properties (Bottom 25%) average 13% occupancy, potentially facing higher vacancy.
Average Monthly Occupancy Rate Trend in Mons
Average Daily Rate (ADR) Airbnb Trends in Mons (2025)
Effective short term rental pricing strategy in Mons involves understanding monthly ADR fluctuations. The Average Daily Rate (ADR) for Airbnb in Mons typically peaks in August and dips lowest during March. Leveraging Airbnb dynamic pricing tools or strategies based on this seasonality can significantly boost revenue. Here's a look at the typical nightly rates achieved:
- Best-in-class properties (Top 10%) command rates of $342+ per night, often due to premium features or locations.
- Strong performing properties (Top 25%) achieve nightly rates of $261 or more.
- Typical properties (Median) charge around $136 per night.
- Entry-level properties (Bottom 25%) earn around $97 per night.
Average Daily Rate (ADR) Trend by Month in Mons
Get Live Mons Market Intelligence 👇

Explore Real-time Analytics
Airbnb Seasonality Analysis & Trends in Mons (2025)
Peak Season (August, July, May)
- Revenue averages $3,152 per month
- Occupancy rates average 51.7%
- Daily rates average $245
Shoulder Season
- Revenue averages $1,377 per month
- Occupancy maintains around 28.2%
- Daily rates hold near $218
Low Season (January, February, March)
- Revenue drops to average $550 per month
- Occupancy decreases to average 11.6%
- Daily rates adjust to average $181
Seasonality Insights for Mons
- The Airbnb seasonality in Mons shows highly seasonal trends requiring careful strategy. While the sections above show seasonal averages, it's also insightful to look at the extremes:
- During the high season, the absolute peak month showcases Mons's highest earning potential, with monthly revenues capable of climbing to $3,627, occupancy reaching a high of 68.0%, and ADRs peaking at $251.
- Conversely, the slowest single month of the year, typically falling within the low season, marks the market's lowest point. In this month, revenue might dip to $275, occupancy could drop to 6.5%, and ADRs may adjust down to $173.
- Understanding both the seasonal averages and these monthly peaks and troughs in revenue, occupancy, and ADR is crucial for maximizing your Airbnb profit potential in Mons.
Seasonal Strategies for Maximizing Profit
- Peak Season: Maximize revenue through premium pricing and potentially longer minimum stays. Ensure high availability.
- Low Season: Offer competitive pricing, special promotions (e.g., extended stay discounts), and flexible cancellation policies. Target off-season travelers like remote workers or budget-conscious guests.
- Shoulder Seasons: Implement dynamic pricing that balances peak and low rates. Target weekend travelers or specific events. Offer slightly more flexible terms than peak season.
- Regularly analyze your own performance against these Mons seasonality benchmarks and adjust your pricing and availability strategy accordingly.
Best Areas for Airbnb Investment in Mons (2025)
Exploring the top neighborhoods for short-term rentals in Mons? This section highlights key areas, outlining why they are attractive for hosts and guests, along with notable local attractions. Consider these locations based on your target guest profile and investment strategy.
| Neighborhood / Area | Why Host Here? (Target Guests & Appeal) | Key Attractions & Landmarks |
|---|---|---|
| Centro Historico | The historic center of Mons is rich in history and architecture, making it a popular destination for tourists wanting to explore museums, galleries, and local culture. | Mons Memorial Museum, Grand Place, Collegiate Church of Saint Waltrude, Belfry of Mons, Doudou Festival, Museum of Fine Arts |
| Borinage | A unique area known for its mining history and UNESCO World Heritage sites. Ideal for guests interested in industrial heritage and exploring lesser-known attractions. | Le Grand Hornu, Museum of Mining, La Louvière's boat lifts, Cultural sites of the Borinage, Cinéy Théâtre |
| Mons International Congress Exhibition Centre (MICX) | A modern venue that attracts business travelers, conferences, and exhibitions. Ideal for corporate stays and those attending events. | MICX, Exhibition Halls, Business Networking Events, Nearby hotels and amenities |
| Parc du Waux-Hall | A beautiful park in Mons that attracts families and nature lovers. Ideal for weekend getaways and relaxation amid nature. | Waux-Hall Park, Playgrounds, Walking paths, Picnic areas, Cafés nearby |
| La Maison Van Gogh | A historic house where Vincent van Gogh lived, drawing in art enthusiasts and tourists interested in the artist's life and works. | Van Gogh's House, Art exhibitions, Cultural events, Guided tours |
| Basilique du Saint-Christophe | A stunning basilica attracting both religious tourists and architecture enthusiasts. Important site for local celebrations and events. | Basilica Architecture, Pilgrimage Site, Local Festivals, Cultural Tours |
| Le Parc Naturel Régional de la Scarpe-Escaut | A natural park ideal for outdoor activities, attracting nature lovers and hikers looking for serene landscapes. | Hiking Trails, Biking Routes, Wildlife Watching, Natural Beauty Spots |
| Espace de l'Annonceur | A cultural center that hosts events, performances, and exhibitions. Great for visitors looking for local entertainment and culture. | Art Exhibitions, Live Performances, Workshops, Food and Drink Events |
Understanding Airbnb License Requirements & STR Laws in Mons (2025)
While Mons, Provence-Alpes-Côte d'Azur, France currently shows low STR regulations, specific Airbnb license requirements might still exist or change. Always verify the latest short term rental regulations and Airbnb license requirements directly with local government authorities for Mons to ensure full compliance before hosting.
(Source: AirROI data, 2025, finding no licensed listings among those analyzed)
Top Performing Airbnb Properties in Mons (2025)
Benchmark your potential! Explore examples of top-performing Airbnb properties in Monsbased on Trailing Twelve Month (TTM) revenue. Analyze their characteristics, revenue, occupancy rate, and ADR to understand what drives success in this market.

Seventies architect's house with pool
Entire Place • 3 bedrooms
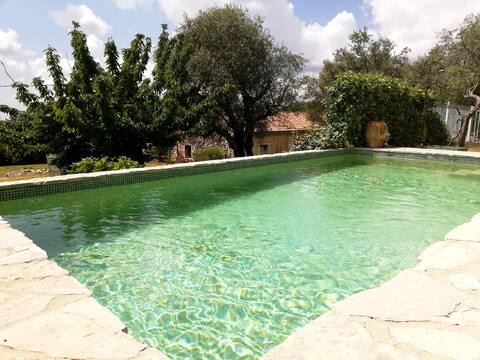
authentic Provencal house with private pool
Entire Place • 3 bedrooms
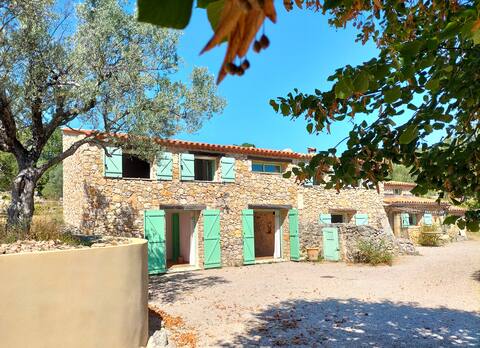
Lou Peiraverde
Entire Place • 3 bedrooms

Villa avec piscine privée parmi les oliviers
Entire Place • 4 bedrooms
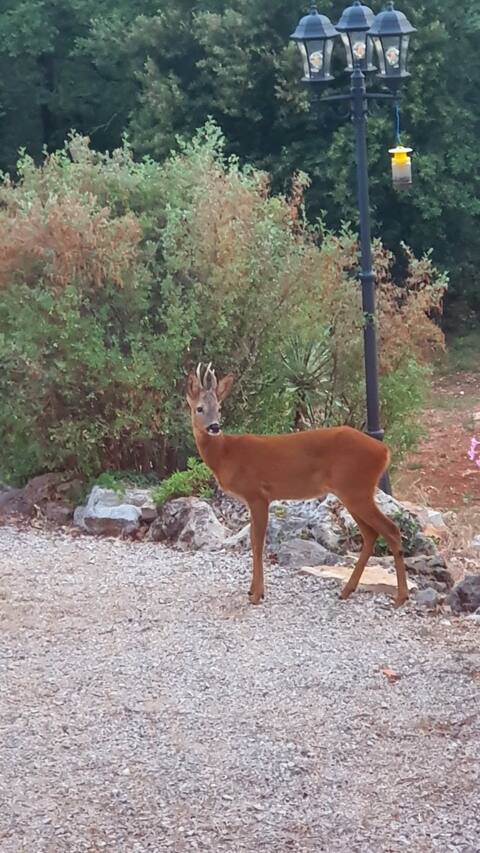
House in a relaxing estate.
Entire Place • 4 bedrooms
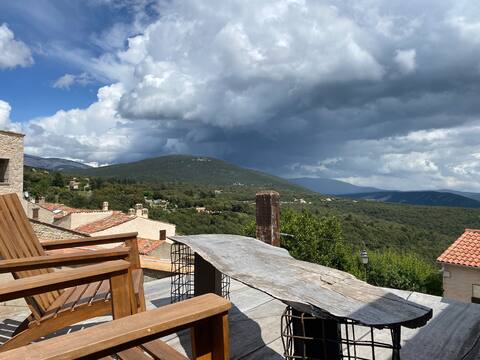
Quaint stone house
Entire Place • 1 bedroom
Note: Performance varies based on location, size, amenities, seasonality, and management quality. Data reflects the past 12 months.
Top Performing Airbnb Hosts in Mons (2025)
Learn from the best! This table showcases top-performing Airbnb hosts in Mons based on the number of properties managed and estimated total revenue over the past year. Analyze their scale and performance metrics.
| Host Name | Properties | Grossing Revenue | Stay Reviews | Avg Rating |
|---|---|---|---|---|
| Olivier & William | 1 | $31,689 | 42 | 4.86/5.0 |
| Magali | 1 | $31,656 | 114 | 4.99/5.0 |
| Delphine | 1 | $25,784 | 5 | 5.00/5.0 |
| Host #127199568 | 1 | $23,152 | 14 | 4.79/5.0 |
| Gilles | 1 | $21,994 | 4 | 5.00/5.0 |
| Fabien | 1 | $21,931 | 50 | 4.78/5.0 |
| Thierry François | 1 | $21,773 | 25 | 4.96/5.0 |
| Marie | 3 | $19,247 | 25 | 3.14/5.0 |
| Sylvie | 1 | $13,765 | 25 | 4.96/5.0 |
| Bernard | 1 | $8,626 | 7 | 4.86/5.0 |
Analyzing the strategies of top hosts, such as their property selection, pricing, and guest communication, can offer valuable lessons for optimizing your own Airbnb operations in Mons.
Dive Deeper: Advanced Mons STR Market Data (2025)
Ready to unlock more insights? AirROI provides access to advanced metrics and comprehensive Airbnb data for Mons. Explore detailed analytics beyond this report to refine your investment strategy, optimize pricing, and maximize your vacation rental profits.
Explore Advanced MetricsMons Short-Term Rental Market Composition (2025): Property & Room Types
Room Type Distribution
Property Type Distribution
Market Composition Insights for Mons
- The Mons Airbnb market composition is heavily skewed towards Entire Home/Apt listings, which make up 95% of the 20 active rentals. This indicates strong guest preference for privacy and space.
- Looking at the property type distribution in Mons, House properties are the most common (85%), reflecting the local real estate landscape.
- Houses represent a significant 85% portion, catering likely to families or larger groups.
Mons Airbnb Room Capacity Analysis (2025): Bedroom Distribution
Distribution of Listings by Number of Bedrooms
Room Capacity Insights for Mons
- The dominant room capacity in Mons is 1 bedroom listings, making up 30% of the market. This suggests a strong demand for properties suitable for couples or solo travelers.
- Together, 1 bedroom and 4 bedrooms properties represent 55.0% of the active Airbnb listings in Mons, indicating a high concentration in these sizes.
- A significant 50.0% of listings offer 3+ bedrooms, catering to larger groups and families seeking more space in Mons.
Mons Vacation Rental Guest Capacity Trends (2025)
Distribution of Listings by Guest Capacity
Guest Capacity Insights for Mons
- The most common guest capacity trend in Mons vacation rentals is listings accommodating 4 guests (35%). This suggests the primary traveler segment is likely small families or groups.
- Properties designed for 4 guests and 8+ guests dominate the Mons STR market, accounting for 65.0% of listings.
- 55.0% of properties accommodate 6+ guests, serving the market segment for larger families or group travel in Mons.
- On average, properties in Mons are equipped to host 5.5 guests.
Mons Airbnb Booking Patterns (2025): Available vs. Booked Days
Available Days Distribution
Booked Days Distribution
Booking Pattern Insights for Mons
- The most common availability pattern in Mons falls within the 271-366 days range, representing 80% of listings. This suggests many properties have significant open periods on their calendars.
- Approximately 90.0% of listings show high availability (181+ days open annually), indicating potential for increased bookings or specific owner usage patterns.
- For booked days, the 31-90 days range is most frequent in Mons (60%), reflecting common guest stay durations or potential owner blocking patterns.
- A notable 10.0% of properties secure long booking periods (181+ days booked per year), highlighting successful long-term rental strategies or significant owner usage.
Mons Airbnb Minimum Stay Requirements Analysis
Distribution of Listings by Minimum Night Requirement
2 Nights
2 listings
11.1% of total
3 Nights
6 listings
33.3% of total
4-6 Nights
7 listings
38.9% of total
7-29 Nights
2 listings
11.1% of total
30+ Nights
1 listings
5.6% of total
Key Insights
- The most prevalent minimum stay requirement in Mons is 4-6 Nights, adopted by 38.9% of listings. This highlights the market's preference for longer commitments.
- Very short stays (1-2 nights) are less common (11.1%), suggesting hosts prefer slightly longer bookings to optimize turnover.
Recommendations
- Align with the market by considering a 4-6 Nights minimum stay, as 38.9% of Mons hosts use this setting.
- Explore offering discounts for stays of 30+ nights to attract the 5.6% of the market seeking extended stays.
- Adjust minimum nights based on seasonality – potentially shorter during low season and longer during peak demand periods in Mons.
Mons Airbnb Cancellation Policy Trends Analysis (2025)
Flexible
3 listings
20% of total
Moderate
1 listings
6.7% of total
Firm
4 listings
26.7% of total
Strict
7 listings
46.7% of total
Cancellation Policy Insights for Mons
- The prevailing Airbnb cancellation policy trend in Mons is Strict, used by 46.7% of listings.
- A majority (73.4%) of hosts in Mons utilize Firm or Strict policies, indicating a market where hosts prioritize booking security.
Recommendations for Hosts
- Consider adopting a Strict policy to align with the 46.7% market standard in Mons.
- With 46.7% using Strict terms, this is a viable option in Mons, particularly for high-value properties or during peak demand periods.
- Regularly review your cancellation policy against competitors and market demand shifts in Mons.
Mons STR Booking Lead Time Analysis (2025)
Average Booking Lead Time by Month
Booking Lead Time Insights for Mons
- The overall average booking lead time for vacation rentals in Mons is 52 days.
- Guests book furthest in advance for stays during August (average 74 days), likely coinciding with peak travel demand or local events.
- The shortest booking windows occur for stays in February (average 4 days), indicating more last-minute travel plans during this time.
- Seasonally, Summer (63 days avg.) sees the longest lead times, while Winter (12 days avg.) has the shortest, reflecting typical travel planning cycles.
Recommendations for Hosts
- Use the overall average lead time (52 days) as a baseline for your pricing and availability strategy in Mons.
- For August stays, consider implementing length-of-stay discounts or slightly higher rates for bookings made less than 74 days out to capitalize on advance planning.
- During February, focus on last-minute booking availability and promotions, as guests book with very short notice (4 days avg.).
- Target marketing efforts for the Summer season well in advance (at least 63 days) to capture early planners.
- Monitor your own booking lead times against these Mons averages to identify opportunities for dynamic pricing adjustments.
Popular & Essential Airbnb Amenities in Mons (2025)
Amenity Prevalence
Amenity Insights for Mons
- Essential amenities in Mons that guests expect include: Kitchen, Washer, Smoke alarm. Lacking these (any) could significantly impact bookings.
- Popular amenities like Hot water, Wifi, Heating are common but not universal. Offering these can provide a competitive edge.
- Warning: Wifi is not universally provided but is considered essential globally. Ensure reliable Wifi is offered.
Recommendations for Hosts
- Ensure your listing includes all essential amenities for Mons: Kitchen, Washer, Smoke alarm.
- Prioritize adding missing essentials: Smoke alarm.
- Consider adding popular differentiators like Hot water or Wifi to increase appeal.
- Highlight unique or less common amenities you offer (e.g., hot tub, dedicated workspace, EV charger) in your listing description and photos.
- Regularly check competitor amenities in Mons to stay competitive.
Mons Airbnb Guest Demographics & Profile Analysis (2025)
Guest Profile Summary for Mons
- The typical guest profile for Airbnb in Mons consists of a mix of domestic (44%) and international guests, with top international origins including Germany, typically belonging to the Post-2000s (Gen Z/Alpha) group (50%), primarily speaking English or French.
- Domestic travelers account for 44.0% of guests.
- Key international markets include France (44%) and Germany (14%).
- Top languages spoken are English (33.6%) followed by French (26.2%).
- A significant demographic segment is the Post-2000s (Gen Z/Alpha) group, representing 50% of guests.
Recommendations for Hosts
- Balance marketing efforts between domestic and international channels based on the guest mix.
- Tailor amenities and listing descriptions to appeal to the dominant Post-2000s (Gen Z/Alpha) demographic (e.g., highlight fast WiFi, smart home features, local guides).
- Highlight unique local experiences or amenities relevant to the primary guest profile.
- Consider seasonal promotions aligned with peak travel times for key origin markets.
Nearby Short-Term Rental Market Comparison
How does the Mons Airbnb market stack up against its neighbors? Compare key performance metrics like average monthly revenue, ADR, and occupancy rates in surrounding areas to understand the broader regional STR landscape.
| Market | Active Properties | Monthly Revenue | Daily Rate | Avg. Occupancy |
|---|---|---|---|---|
| Monteu Roero | 16 | $4,432 | $540.14 | 36% |
| Ramatuelle | 213 | $3,891 | $670.10 | 41% |
| Saint-Jean-Cap-Ferrat | 107 | $3,844 | $424.21 | 46% |
| Saint-Tropez | 742 | $3,498 | $506.57 | 41% |
| Èze | 153 | $3,168 | $345.84 | 47% |
| Chantepérier | 20 | $3,057 | $281.60 | 37% |
| Opio | 40 | $3,057 | $540.62 | 37% |
| Villefranche-sur-Mer | 501 | $2,977 | $268.57 | 52% |
| Gassin | 384 | $2,939 | $434.44 | 40% |
| Gordes | 225 | $2,913 | $366.32 | 43% |