Mollégès Airbnb Market Analysis 2025: Short Term Rental Data & Vacation Rental Statistics in Provence-Alpes-Côte d'Azur, France
Is Airbnb profitable in Mollégès in 2025? Explore comprehensive Airbnb analytics for Mollégès, Provence-Alpes-Côte d'Azur, France to uncover income potential. This 2025 STR market report for Mollégès, based on AirROI data from April 2024 to March 2025, reveals key trends in the niche market of 52 active listings.
Whether you're considering an Airbnb investment in Mollégès, optimizing your existing vacation rental, or exploring rental arbitrage opportunities, understanding the Mollégès Airbnb data is crucial. Understanding the local regulations is key to maximizing your short term rental income potential. Let's dive into the specifics.
Key Mollégès Airbnb Performance Metrics Overview
Monthly Airbnb Revenue Variations & Income Potential in Mollégès (2025)
Understanding the monthly revenue variations for Airbnb listings in Mollégès is key to maximizing your short term rental income potential. Seasonality significantly impacts earnings. Our analysis, based on data from the past 12 months, shows that the peak revenue month for STRs in Mollégès is typically August, while January often presents the lowest earnings, highlighting opportunities for strategic pricing adjustments during shoulder and low seasons. Explore the typical Airbnb income in Mollégès across different performance tiers:
- Best-in-class properties (Top 10%) achieve $5,539+ monthly, often utilizing dynamic pricing and superior guest experiences.
- Strong performing properties (Top 25%) earn $3,232 or more, indicating effective management and desirable locations/amenities.
- Typical properties (Median) generate around $1,968 per month, representing the average market performance.
- Entry-level properties (Bottom 25%) see earnings around $1,004, often with potential for optimization.
Average Monthly Airbnb Earnings Trend in Mollégès
Mollégès Airbnb Occupancy Rate Trends (2025)
Maximize your bookings by understanding the Mollégès STR occupancy trends. Seasonal demand shifts significantly influence how often properties are booked. Typically, Augustsees the highest demand (peak season occupancy), while December experiences the lowest (low season). Effective strategies, like adjusting minimum stays or offering promotions, can boost occupancy during slower periods. Here's how different property tiers perform in Mollégès:
- Best-in-class properties (Top 10%) achieve 74%+ occupancy, indicating high desirability and potentially optimized availability.
- Strong performing properties (Top 25%) maintain 62% or higher occupancy, suggesting good market fit and guest satisfaction.
- Typical properties (Median) have an occupancy rate around 39%.
- Entry-level properties (Bottom 25%) average 20% occupancy, potentially facing higher vacancy.
Average Monthly Occupancy Rate Trend in Mollégès
Average Daily Rate (ADR) Airbnb Trends in Mollégès (2025)
Effective short term rental pricing strategy in Mollégès involves understanding monthly ADR fluctuations. The Average Daily Rate (ADR) for Airbnb in Mollégès typically peaks in July and dips lowest during March. Leveraging Airbnb dynamic pricing tools or strategies based on this seasonality can significantly boost revenue. Here's a look at the typical nightly rates achieved:
- Best-in-class properties (Top 10%) command rates of $402+ per night, often due to premium features or locations.
- Strong performing properties (Top 25%) achieve nightly rates of $278 or more.
- Typical properties (Median) charge around $139 per night.
- Entry-level properties (Bottom 25%) earn around $87 per night.
Average Daily Rate (ADR) Trend by Month in Mollégès
Get Live Mollégès Market Intelligence 👇

Explore Real-time Analytics
Airbnb Seasonality Analysis & Trends in Mollégès (2025)
Peak Season (August, July, May)
- Revenue averages $4,152 per month
- Occupancy rates average 57.1%
- Daily rates average $266
Shoulder Season
- Revenue averages $2,651 per month
- Occupancy maintains around 41.6%
- Daily rates hold near $238
Low Season (January, March, December)
- Revenue drops to average $1,609 per month
- Occupancy decreases to average 27.2%
- Daily rates adjust to average $209
Seasonality Insights for Mollégès
- The Airbnb seasonality in Mollégès shows highly seasonal trends requiring careful strategy. While the sections above show seasonal averages, it's also insightful to look at the extremes:
- During the high season, the absolute peak month showcases Mollégès's highest earning potential, with monthly revenues capable of climbing to $4,403, occupancy reaching a high of 67.1%, and ADRs peaking at $272.
- Conversely, the slowest single month of the year, typically falling within the low season, marks the market's lowest point. In this month, revenue might dip to $1,551, occupancy could drop to 24.9%, and ADRs may adjust down to $206.
- Understanding both the seasonal averages and these monthly peaks and troughs in revenue, occupancy, and ADR is crucial for maximizing your Airbnb profit potential in Mollégès.
Seasonal Strategies for Maximizing Profit
- Peak Season: Maximize revenue through premium pricing and potentially longer minimum stays. Ensure high availability.
- Low Season: Offer competitive pricing, special promotions (e.g., extended stay discounts), and flexible cancellation policies. Target off-season travelers like remote workers or budget-conscious guests.
- Shoulder Seasons: Implement dynamic pricing that balances peak and low rates. Target weekend travelers or specific events. Offer slightly more flexible terms than peak season.
- Regularly analyze your own performance against these Mollégès seasonality benchmarks and adjust your pricing and availability strategy accordingly.
Best Areas for Airbnb Investment in Mollégès (2025)
Exploring the top neighborhoods for short-term rentals in Mollégès? This section highlights key areas, outlining why they are attractive for hosts and guests, along with notable local attractions. Consider these locations based on your target guest profile and investment strategy.
| Neighborhood / Area | Why Host Here? (Target Guests & Appeal) | Key Attractions & Landmarks |
|---|---|---|
| Village Center | The heart of Mollégès with local shops, cafes, and a charming atmosphere. Perfect for travelers wanting to experience authentic Provençal life and proximity to local attractions. | Local Market, Église Saint-Denis, Nearby vineyards, Café des Sports, Parks and squares |
| Luberon National Park | Spectacular natural park offering stunning scenery and outdoor activities. Attracts nature lovers and hikers looking to explore the beauty of Provence. | Hiking trails, Lavender fields, Scenic viewpoints, Charming villages, Cycling routes |
| Avignon | Historic city famous for its Palace of the Popes and annual theater festival. A short drive from Mollégès, making it ideal for tourists visiting the region's cultural highlights. | Palais des Papes, Pont Saint-Bénézet, Avignon Festival, Place de l'Horloge, Local gastronomy |
| Saint-Rémy-de-Provence | Picturesque town known for its art and history, including connections to Van Gogh. It's a prime spot for art lovers and those exploring historical Provence. | Van Gogh's painting sites, Antique shops, Local markets, Roman ruins, Charming streets |
| Les Baux-de-Provence | Stunning hilltop village with breathtaking views and historical significance. Popular for its medieval architecture and scenic beauty. | Château des Baux, Carrières de Lumières, Art exhibitions, Local crafts, Scenic viewpoints |
| Arles | Rich in Roman history and a UNESCO World Heritage Site. Attracts tourists with its ancient ruins and vibrant cultural scene. | Roman Amphitheater, Van Gogh's Arles, Musee de l'Arles Antique, Local festivals, Charming cafes |
| Nîmes | Known for its well-preserved Roman monuments and vibrant atmosphere. Attracts history buffs and tourists exploring the south of France. | Arena of Nîmes, Maison Carrée, Jardins de la Fontaine, Les Halles market, Roman temples |
| Avignon's Surroundings | Lovely countryside areas surrounding the city filled with vineyards, olive groves, and quaint villages. Ideal for those wanting to enjoy the tranquility of Provence. | Vineyard tours, Olive oil tastings, Charming countryside villages, Scenic drives, Local festivals |
Understanding Airbnb License Requirements & STR Laws in Mollégès (2025)
With 17% of listings showing registration in 2025, understanding potential Airbnb license requirements is crucial in Mollégès. Always verify the latest short term rental regulations and Airbnb license requirements directly with local government authorities for Mollégès to ensure full compliance before hosting.
(Source: AirROI data, 2025, based on 17% licensed listings)
Top Performing Airbnb Properties in Mollégès (2025)
Benchmark your potential! Explore examples of top-performing Airbnb properties in Mollégèsbased on Trailing Twelve Month (TTM) revenue. Analyze their characteristics, revenue, occupancy rate, and ADR to understand what drives success in this market.
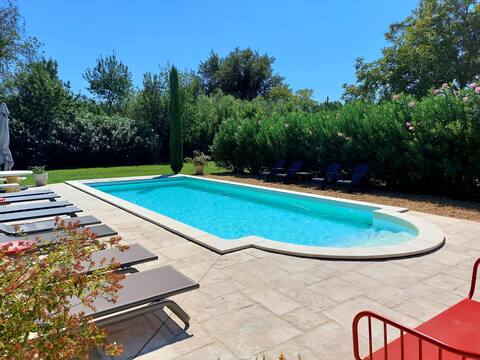
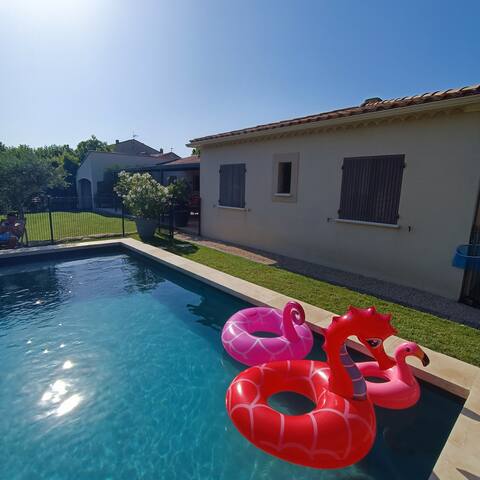
Quiet, view of the Alpilles, heated pool
Entire Place • 4 bedrooms
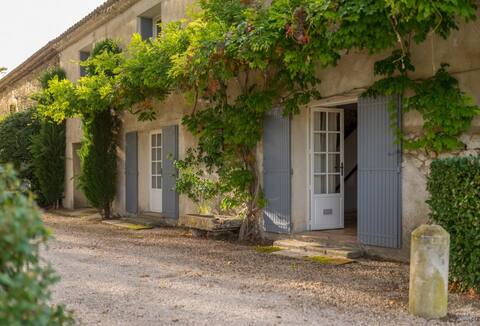
Maison En Pierre
Entire Place • 6 bedrooms
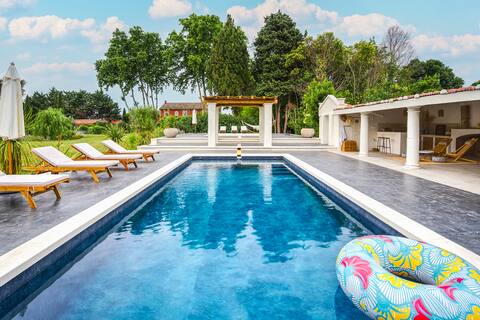
Proveçal Villa with private pool and tennis court
Entire Place • 4 bedrooms
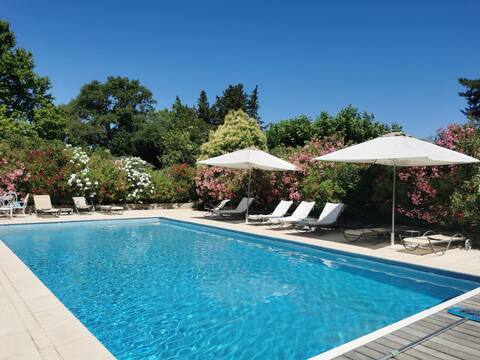
Provencal villa with private pool
Entire Place • 3 bedrooms
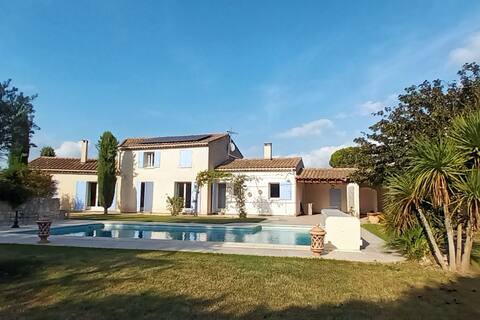
Family villa & pool near St Remy de Prov
Entire Place • 4 bedrooms
Air-conditioned farmhouse heated pool near the Alpilles
Entire Place • 2 bedrooms
Note: Performance varies based on location, size, amenities, seasonality, and management quality. Data reflects the past 12 months.
Top Performing Airbnb Hosts in Mollégès (2025)
Learn from the best! This table showcases top-performing Airbnb hosts in Mollégès based on the number of properties managed and estimated total revenue over the past year. Analyze their scale and performance metrics.
| Host Name | Properties | Grossing Revenue | Stay Reviews | Avg Rating |
|---|---|---|---|---|
| Sandrine | 7 | $153,837 | 214 | 4.20/5.0 |
| Jean | 1 | $75,902 | 28 | 4.89/5.0 |
| Host #449488095 | 1 | $72,268 | 0 | 0.00/5.0 |
| Bernadette | 2 | $49,522 | 92 | 5.00/5.0 |
| Sonia | 1 | $46,980 | 3 | 5.00/5.0 |
| Edmond | 1 | $46,819 | 14 | 4.86/5.0 |
| Amélie | 1 | $36,212 | 10 | 5.00/5.0 |
| Gérard | 1 | $34,869 | 17 | 5.00/5.0 |
| Karine | 1 | $30,951 | 4 | 5.00/5.0 |
| Alexandra | 1 | $29,023 | 28 | 5.00/5.0 |
Analyzing the strategies of top hosts, such as their property selection, pricing, and guest communication, can offer valuable lessons for optimizing your own Airbnb operations in Mollégès.
Dive Deeper: Advanced Mollégès STR Market Data (2025)
Ready to unlock more insights? AirROI provides access to advanced metrics and comprehensive Airbnb data for Mollégès. Explore detailed analytics beyond this report to refine your investment strategy, optimize pricing, and maximize your vacation rental profits.
Explore Advanced MetricsMollégès Short-Term Rental Market Composition (2025): Property & Room Types
Room Type Distribution
Property Type Distribution
Market Composition Insights for Mollégès
- The Mollégès Airbnb market composition is heavily skewed towards Entire Home/Apt listings, which make up 94.2% of the 52 active rentals. This indicates strong guest preference for privacy and space.
- Looking at the property type distribution in Mollégès, House properties are the most common (84.6%), reflecting the local real estate landscape.
- Houses represent a significant 84.6% portion, catering likely to families or larger groups.
- The presence of 5.8% Hotel/Boutique listings indicates integration with traditional hospitality.
- Smaller segments like apartment/condo, outdoor/unique (combined 3.8%) offer potential for unique stay experiences.
Mollégès Airbnb Room Capacity Analysis (2025): Bedroom Distribution
Distribution of Listings by Number of Bedrooms
Room Capacity Insights for Mollégès
- The dominant room capacity in Mollégès is 2 bedrooms listings, making up 32.7% of the market. This suggests a strong demand for properties suitable for couples or solo travelers.
- Together, 2 bedrooms and 1 bedroom properties represent 57.7% of the active Airbnb listings in Mollégès, indicating a high concentration in these sizes.
- A significant 38.5% of listings offer 3+ bedrooms, catering to larger groups and families seeking more space in Mollégès.
Mollégès Vacation Rental Guest Capacity Trends (2025)
Distribution of Listings by Guest Capacity
Guest Capacity Insights for Mollégès
- The most common guest capacity trend in Mollégès vacation rentals is listings accommodating 4 guests (32.7%). This suggests the primary traveler segment is likely small families or groups.
- Properties designed for 4 guests and 6 guests dominate the Mollégès STR market, accounting for 51.9% of listings.
- 40.3% of properties accommodate 6+ guests, serving the market segment for larger families or group travel in Mollégès.
- On average, properties in Mollégès are equipped to host 4.8 guests.
Mollégès Airbnb Booking Patterns (2025): Available vs. Booked Days
Available Days Distribution
Booked Days Distribution
Booking Pattern Insights for Mollégès
- The most common availability pattern in Mollégès falls within the 271-366 days range, representing 48.1% of listings. This suggests many properties have significant open periods on their calendars.
- Approximately 88.5% of listings show high availability (181+ days open annually), indicating potential for increased bookings or specific owner usage patterns.
- For booked days, the 91-180 days range is most frequent in Mollégès (40.4%), reflecting common guest stay durations or potential owner blocking patterns.
- A notable 15.4% of properties secure long booking periods (181+ days booked per year), highlighting successful long-term rental strategies or significant owner usage.
Mollégès Airbnb Minimum Stay Requirements Analysis
Distribution of Listings by Minimum Night Requirement
1 Night
2 listings
4.3% of total
2 Nights
7 listings
15.2% of total
3 Nights
7 listings
15.2% of total
4-6 Nights
14 listings
30.4% of total
7-29 Nights
9 listings
19.6% of total
30+ Nights
7 listings
15.2% of total
Key Insights
- The most prevalent minimum stay requirement in Mollégès is 4-6 Nights, adopted by 30.4% of listings. This highlights the market's preference for longer commitments.
- Very short stays (1-2 nights) are less common (19.5%), suggesting hosts prefer slightly longer bookings to optimize turnover.
- A significant segment (15.2%) caters to monthly stays (30+ nights) in Mollégès, pointing to opportunities in the extended-stay market.
Recommendations
- Align with the market by considering a 4-6 Nights minimum stay, as 30.4% of Mollégès hosts use this setting.
- If feasible, allowing 1-night stays, especially midweek or during low season, could capture last-minute bookings, as only 4.3% currently do.
- Explore offering discounts for stays of 30+ nights to attract the 15.2% of the market seeking extended stays.
- Adjust minimum nights based on seasonality – potentially shorter during low season and longer during peak demand periods in Mollégès.
Mollégès Airbnb Cancellation Policy Trends Analysis (2025)
Flexible
6 listings
14.3% of total
Moderate
7 listings
16.7% of total
Firm
24 listings
57.1% of total
Strict
5 listings
11.9% of total
Cancellation Policy Insights for Mollégès
- The prevailing Airbnb cancellation policy trend in Mollégès is Firm, used by 57.1% of listings.
- A majority (69.0%) of hosts in Mollégès utilize Firm or Strict policies, indicating a market where hosts prioritize booking security.
Recommendations for Hosts
- Consider adopting a Firm policy to align with the 57.1% market standard in Mollégès.
- Using a Strict policy might deter some guests, as only 11.9% of listings use it. Evaluate if potential revenue protection outweighs possible lower booking rates.
- Regularly review your cancellation policy against competitors and market demand shifts in Mollégès.
Mollégès STR Booking Lead Time Analysis (2025)
Average Booking Lead Time by Month
Booking Lead Time Insights for Mollégès
- The overall average booking lead time for vacation rentals in Mollégès is 84 days.
- Guests book furthest in advance for stays during July (average 130 days), likely coinciding with peak travel demand or local events.
- The shortest booking windows occur for stays in March (average 21 days), indicating more last-minute travel plans during this time.
- Seasonally, Summer (118 days avg.) sees the longest lead times, while Winter (27 days avg.) has the shortest, reflecting typical travel planning cycles.
Recommendations for Hosts
- Use the overall average lead time (84 days) as a baseline for your pricing and availability strategy in Mollégès.
- For July stays, consider implementing length-of-stay discounts or slightly higher rates for bookings made less than 130 days out to capitalize on advance planning.
- Target marketing efforts for the Summer season well in advance (at least 118 days) to capture early planners.
- Monitor your own booking lead times against these Mollégès averages to identify opportunities for dynamic pricing adjustments.
Popular & Essential Airbnb Amenities in Mollégès (2025)
Amenity Prevalence
Amenity Insights for Mollégès
- Essential amenities in Mollégès that guests expect include: Kitchen, Wifi, TV, Hot water, Heating, Air conditioning. Lacking these (any) could significantly impact bookings.
- Popular amenities like Coffee maker, Free parking on premises, Dishes and silverware are common but not universal. Offering these can provide a competitive edge.
Recommendations for Hosts
- Ensure your listing includes all essential amenities for Mollégès: Kitchen, Wifi, TV, Hot water, Heating, Air conditioning.
- Prioritize adding missing essentials: Kitchen, Wifi, TV, Hot water, Heating, Air conditioning.
- Consider adding popular differentiators like Coffee maker or Free parking on premises to increase appeal.
- Highlight unique or less common amenities you offer (e.g., hot tub, dedicated workspace, EV charger) in your listing description and photos.
- Regularly check competitor amenities in Mollégès to stay competitive.
Mollégès Airbnb Guest Demographics & Profile Analysis (2025)
Guest Profile Summary for Mollégès
- The typical guest profile for Airbnb in Mollégès consists of primarily domestic travelers (66%), often arriving from nearby Paris, typically belonging to the Post-2000s (Gen Z/Alpha) group (50%), primarily speaking French or English.
- Domestic travelers account for 66.4% of guests.
- Key international markets include France (66.4%) and Germany (7.5%).
- Top languages spoken are French (40.9%) followed by English (34.2%).
- A significant demographic segment is the Post-2000s (Gen Z/Alpha) group, representing 50% of guests.
Recommendations for Hosts
- Target domestic marketing efforts towards travelers from Paris and Lille.
- Tailor amenities and listing descriptions to appeal to the dominant Post-2000s (Gen Z/Alpha) demographic (e.g., highlight fast WiFi, smart home features, local guides).
- Highlight unique local experiences or amenities relevant to the primary guest profile.
- Consider seasonal promotions aligned with peak travel times for key origin markets.
Nearby Short-Term Rental Market Comparison
How does the Mollégès Airbnb market stack up against its neighbors? Compare key performance metrics like average monthly revenue, ADR, and occupancy rates in surrounding areas to understand the broader regional STR landscape.
| Market | Active Properties | Monthly Revenue | Daily Rate | Avg. Occupancy |
|---|---|---|---|---|
| Villeneuvette | 13 | $4,150 | $337.56 | 44% |
| Divajeu | 19 | $3,941 | $410.65 | 42% |
| Chantepérier | 20 | $3,057 | $281.60 | 37% |
| Rupià | 11 | $3,046 | $386.95 | 40% |
| Gordes | 225 | $2,913 | $366.32 | 43% |
| Redessan | 19 | $2,834 | $334.82 | 34% |
| Fontarèches | 11 | $2,802 | $525.31 | 34% |
| Ménerbes | 97 | $2,800 | $453.86 | 41% |
| La Bruguière | 14 | $2,732 | $277.64 | 50% |
| Soyans | 12 | $2,721 | $193.55 | 45% |