Le Bar-sur-Loup Airbnb Market Analysis 2025: Short Term Rental Data & Vacation Rental Statistics in Provence-Alpes-Côte d'Azur, France
Is Airbnb profitable in Le Bar-sur-Loup in 2025? Explore comprehensive Airbnb analytics for Le Bar-sur-Loup, Provence-Alpes-Côte d'Azur, France to uncover income potential. This 2025 STR market report for Le Bar-sur-Loup, based on AirROI data from April 2024 to March 2025, reveals key trends in the niche market of 54 active listings.
Whether you're considering an Airbnb investment in Le Bar-sur-Loup, optimizing your existing vacation rental, or exploring rental arbitrage opportunities, understanding the Le Bar-sur-Loup Airbnb data is crucial. Leveraging the low regulation environment is key to maximizing your short term rental income potential. Let's dive into the specifics.
Key Le Bar-sur-Loup Airbnb Performance Metrics Overview
Monthly Airbnb Revenue Variations & Income Potential in Le Bar-sur-Loup (2025)
Understanding the monthly revenue variations for Airbnb listings in Le Bar-sur-Loup is key to maximizing your short term rental income potential. Seasonality significantly impacts earnings. Our analysis, based on data from the past 12 months, shows that the peak revenue month for STRs in Le Bar-sur-Loup is typically August, while November often presents the lowest earnings, highlighting opportunities for strategic pricing adjustments during shoulder and low seasons. Explore the typical Airbnb income in Le Bar-sur-Loup across different performance tiers:
- Best-in-class properties (Top 10%) achieve $4,348+ monthly, often utilizing dynamic pricing and superior guest experiences.
- Strong performing properties (Top 25%) earn $2,417 or more, indicating effective management and desirable locations/amenities.
- Typical properties (Median) generate around $1,395 per month, representing the average market performance.
- Entry-level properties (Bottom 25%) see earnings around $743, often with potential for optimization.
Average Monthly Airbnb Earnings Trend in Le Bar-sur-Loup
Le Bar-sur-Loup Airbnb Occupancy Rate Trends (2025)
Maximize your bookings by understanding the Le Bar-sur-Loup STR occupancy trends. Seasonal demand shifts significantly influence how often properties are booked. Typically, Augustsees the highest demand (peak season occupancy), while March experiences the lowest (low season). Effective strategies, like adjusting minimum stays or offering promotions, can boost occupancy during slower periods. Here's how different property tiers perform in Le Bar-sur-Loup:
- Best-in-class properties (Top 10%) achieve 79%+ occupancy, indicating high desirability and potentially optimized availability.
- Strong performing properties (Top 25%) maintain 58% or higher occupancy, suggesting good market fit and guest satisfaction.
- Typical properties (Median) have an occupancy rate around 34%.
- Entry-level properties (Bottom 25%) average 19% occupancy, potentially facing higher vacancy.
Average Monthly Occupancy Rate Trend in Le Bar-sur-Loup
Average Daily Rate (ADR) Airbnb Trends in Le Bar-sur-Loup (2025)
Effective short term rental pricing strategy in Le Bar-sur-Loup involves understanding monthly ADR fluctuations. The Average Daily Rate (ADR) for Airbnb in Le Bar-sur-Loup typically peaks in July and dips lowest during November. Leveraging Airbnb dynamic pricing tools or strategies based on this seasonality can significantly boost revenue. Here's a look at the typical nightly rates achieved:
- Best-in-class properties (Top 10%) command rates of $403+ per night, often due to premium features or locations.
- Strong performing properties (Top 25%) achieve nightly rates of $209 or more.
- Typical properties (Median) charge around $111 per night.
- Entry-level properties (Bottom 25%) earn around $80 per night.
Average Daily Rate (ADR) Trend by Month in Le Bar-sur-Loup
Get Live Le Bar-sur-Loup Market Intelligence 👇

Explore Real-time Analytics
Airbnb Seasonality Analysis & Trends in Le Bar-sur-Loup (2025)
Peak Season (August, July, September)
- Revenue averages $3,463 per month
- Occupancy rates average 57.6%
- Daily rates average $215
Shoulder Season
- Revenue averages $1,987 per month
- Occupancy maintains around 36.7%
- Daily rates hold near $183
Low Season (February, March, November)
- Revenue drops to average $952 per month
- Occupancy decreases to average 29.0%
- Daily rates adjust to average $141
Seasonality Insights for Le Bar-sur-Loup
- The Airbnb seasonality in Le Bar-sur-Loup shows highly seasonal trends requiring careful strategy. While the sections above show seasonal averages, it's also insightful to look at the extremes:
- During the high season, the absolute peak month showcases Le Bar-sur-Loup's highest earning potential, with monthly revenues capable of climbing to $4,238, occupancy reaching a high of 65.8%, and ADRs peaking at $222.
- Conversely, the slowest single month of the year, typically falling within the low season, marks the market's lowest point. In this month, revenue might dip to $754, occupancy could drop to 23.2%, and ADRs may adjust down to $138.
- Understanding both the seasonal averages and these monthly peaks and troughs in revenue, occupancy, and ADR is crucial for maximizing your Airbnb profit potential in Le Bar-sur-Loup.
Seasonal Strategies for Maximizing Profit
- Peak Season: Maximize revenue through premium pricing and potentially longer minimum stays. Ensure high availability.
- Low Season: Offer competitive pricing, special promotions (e.g., extended stay discounts), and flexible cancellation policies. Target off-season travelers like remote workers or budget-conscious guests.
- Shoulder Seasons: Implement dynamic pricing that balances peak and low rates. Target weekend travelers or specific events. Offer slightly more flexible terms than peak season.
- Regularly analyze your own performance against these Le Bar-sur-Loup seasonality benchmarks and adjust your pricing and availability strategy accordingly.
Best Areas for Airbnb Investment in Le Bar-sur-Loup (2025)
Exploring the top neighborhoods for short-term rentals in Le Bar-sur-Loup? This section highlights key areas, outlining why they are attractive for hosts and guests, along with notable local attractions. Consider these locations based on your target guest profile and investment strategy.
| Neighborhood / Area | Why Host Here? (Target Guests & Appeal) | Key Attractions & Landmarks |
|---|---|---|
| Le Bar-sur-Loup Village | Charming Provençal village with traditional architecture and a relaxed atmosphere. Popular for tourists seeking an authentic French experience alongside beautiful views of the countryside. | Le Château de Le Bar-sur-Loup, Local markets, Provence hiking trails, Saint Vincent Church, Cultural festivals |
| Nearby Grasse | Famous for its perfume industry and historical significance. Attracts tourists interested in fragrances and history, making it an ideal spot for Airbnb hosting. | Fragonard Perfume Factory, International Perfume Museum, Old Town of Grasse, Cathédrale Notre-Dame-du-Puy, Parc Naturel Régional des Préalpes d'Azur |
| Civette | A scenic area close to nature, perfect for those who appreciate outdoor activities like hiking and cycling. Ideal for nature lovers and families. | Hiking trails, Natural parks, Scenic viewpoints, Violet production farms, Local wineries |
| Vence | Known for its historical sites and stunning views of the Côte d'Azur. A favored destination for tourists seeking art and culture in a beautiful setting. | Château de Villeneuve, Vence Cathedral, Matisse Chapel, The Maeght Foundation, Historic old town |
| Saint-Paul-de-Vence | One of the most famous medieval towns in France with art galleries, shops, and cafes. A hotspot for artistic tourists and photography enthusiasts. | Fondation Maeght, Saint-Paul Village, Art galleries and studios, Historical architecture, Cafés with spectacular views |
| Tourrettes-sur-Loup | Known for its picturesque streets and as the 'Violet Village' due to its flowers. It's great for those looking for a peaceful retreat near nature. | Violet Festival, Medieval streets, Local craft shops, Nearby hiking trails, Views over the Riviera |
| Nice (just a short drive away) | One of the largest cities on the French Riviera, known for its stunning beaches, nightlife, and cultural attractions. A popular and bustling destination for tourists. | Promenade des Anglais, Old Town (Vieux Nice), Cimiez Palace, Nice Carnival, Beaches and nightlife |
| Cannes (also nearby) | Famous for the Cannes Film Festival and luxury tourism. Ideal location for hosting short-term rentals for affluent travelers. | La Croisette, Cannes Film Festival, Palais des Festivals, The Suquet, Cannes Beaches |
Understanding Airbnb License Requirements & STR Laws in Le Bar-sur-Loup (2025)
While Le Bar-sur-Loup, Provence-Alpes-Côte d'Azur, France currently shows low STR regulations, specific Airbnb license requirements might still exist or change. Always verify the latest short term rental regulations and Airbnb license requirements directly with local government authorities for Le Bar-sur-Loup to ensure full compliance before hosting.
(Source: AirROI data, 2025, based on 9% licensed listings)
Top Performing Airbnb Properties in Le Bar-sur-Loup (2025)
Benchmark your potential! Explore examples of top-performing Airbnb properties in Le Bar-sur-Loupbased on Trailing Twelve Month (TTM) revenue. Analyze their characteristics, revenue, occupancy rate, and ADR to understand what drives success in this market.
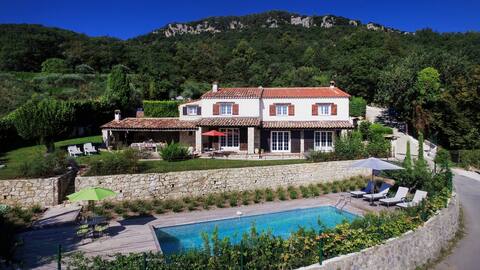
Provencal villa, serene setting, panoramic views
Entire Place • 4 bedrooms
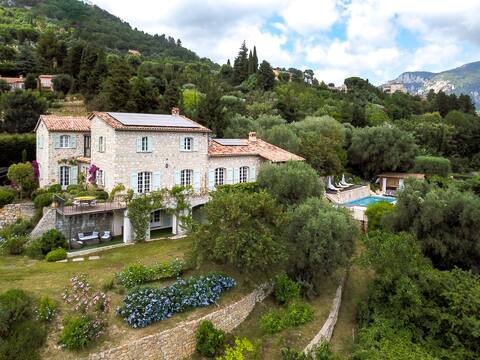
Luxury villa with heated pool, aircon and views
Entire Place • 6 bedrooms

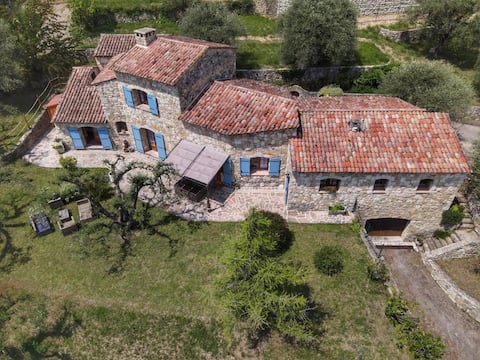
Amazing 6 bedroom villa with private pool
Entire Place • 6 bedrooms
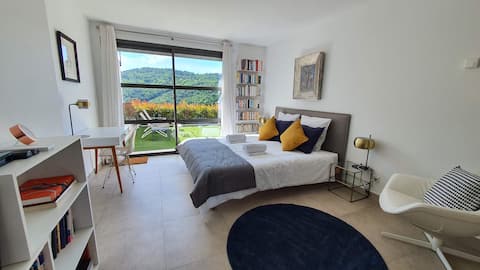
Olive grove between the sea and the mountain
Entire Place • 3 bedrooms
Villa Zola Appartment
Entire Place • 2 bedrooms
Sea and Mountain - Château XVI - Apartment 5 Pers
Entire Place • 3 bedrooms
Note: Performance varies based on location, size, amenities, seasonality, and management quality. Data reflects the past 12 months.
Top Performing Airbnb Hosts in Le Bar-sur-Loup (2025)
Learn from the best! This table showcases top-performing Airbnb hosts in Le Bar-sur-Loup based on the number of properties managed and estimated total revenue over the past year. Analyze their scale and performance metrics.
| Host Name | Properties | Grossing Revenue | Stay Reviews | Avg Rating |
|---|---|---|---|---|
| Milly | 5 | $84,676 | 103 | 4.94/5.0 |
| Francois | 1 | $81,915 | 55 | 4.84/5.0 |
| Nohra | 1 | $77,481 | 8 | 4.88/5.0 |
| Lise | 1 | $76,736 | 17 | 4.71/5.0 |
| Yoko | 2 | $71,627 | 109 | 4.99/5.0 |
| Christèle | 3 | $62,914 | 139 | 4.95/5.0 |
| Christine | 1 | $52,384 | 40 | 5.00/5.0 |
| Philippe | 2 | $42,538 | 27 | 2.50/5.0 |
| Steeve Et Céline | 1 | $36,522 | 14 | 4.86/5.0 |
| Severine | 1 | $27,769 | 118 | 4.86/5.0 |
Analyzing the strategies of top hosts, such as their property selection, pricing, and guest communication, can offer valuable lessons for optimizing your own Airbnb operations in Le Bar-sur-Loup.
Dive Deeper: Advanced Le Bar-sur-Loup STR Market Data (2025)
Ready to unlock more insights? AirROI provides access to advanced metrics and comprehensive Airbnb data for Le Bar-sur-Loup. Explore detailed analytics beyond this report to refine your investment strategy, optimize pricing, and maximize your vacation rental profits.
Explore Advanced MetricsLe Bar-sur-Loup Short-Term Rental Market Composition (2025): Property & Room Types
Room Type Distribution
Property Type Distribution
Market Composition Insights for Le Bar-sur-Loup
- The Le Bar-sur-Loup Airbnb market composition is heavily skewed towards Entire Home/Apt listings, which make up 94.4% of the 54 active rentals. This indicates strong guest preference for privacy and space.
- Looking at the property type distribution in Le Bar-sur-Loup, House properties are the most common (46.3%), reflecting the local real estate landscape.
- Houses represent a significant 46.3% portion, catering likely to families or larger groups.
- The presence of 9.3% Hotel/Boutique listings indicates integration with traditional hospitality.
- Smaller segments like unique stays, others, outdoor/unique (combined 7.5%) offer potential for unique stay experiences.
Le Bar-sur-Loup Airbnb Room Capacity Analysis (2025): Bedroom Distribution
Distribution of Listings by Number of Bedrooms
Room Capacity Insights for Le Bar-sur-Loup
- The dominant room capacity in Le Bar-sur-Loup is 1 bedroom listings, making up 42.6% of the market. This suggests a strong demand for properties suitable for couples or solo travelers.
- Together, 1 bedroom and 2 bedrooms properties represent 68.5% of the active Airbnb listings in Le Bar-sur-Loup, indicating a high concentration in these sizes.
Le Bar-sur-Loup Vacation Rental Guest Capacity Trends (2025)
Distribution of Listings by Guest Capacity
Guest Capacity Insights for Le Bar-sur-Loup
- The most common guest capacity trend in Le Bar-sur-Loup vacation rentals is listings accommodating 2 guests (38.9%). This suggests the primary traveler segment is likely couples or solo travelers.
- Properties designed for 2 guests and 4 guests dominate the Le Bar-sur-Loup STR market, accounting for 57.4% of listings.
- 24.1% of properties accommodate 6+ guests, serving the market segment for larger families or group travel in Le Bar-sur-Loup.
- On average, properties in Le Bar-sur-Loup are equipped to host 4.0 guests.
Le Bar-sur-Loup Airbnb Booking Patterns (2025): Available vs. Booked Days
Available Days Distribution
Booked Days Distribution
Booking Pattern Insights for Le Bar-sur-Loup
- The most common availability pattern in Le Bar-sur-Loup falls within the 271-366 days range, representing 44.4% of listings. This suggests many properties have significant open periods on their calendars.
- Approximately 77.7% of listings show high availability (181+ days open annually), indicating potential for increased bookings or specific owner usage patterns.
- For booked days, the 91-180 days range is most frequent in Le Bar-sur-Loup (42.6%), reflecting common guest stay durations or potential owner blocking patterns.
- A notable 22.3% of properties secure long booking periods (181+ days booked per year), highlighting successful long-term rental strategies or significant owner usage.
Le Bar-sur-Loup Airbnb Minimum Stay Requirements Analysis
Distribution of Listings by Minimum Night Requirement
1 Night
4 listings
8.5% of total
2 Nights
13 listings
27.7% of total
3 Nights
9 listings
19.1% of total
4-6 Nights
13 listings
27.7% of total
7-29 Nights
3 listings
6.4% of total
30+ Nights
5 listings
10.6% of total
Key Insights
- The most prevalent minimum stay requirement in Le Bar-sur-Loup is 2 Nights, adopted by 27.7% of listings. This highlights the market's preference for shorter, flexible bookings.
- A significant segment (10.6%) caters to monthly stays (30+ nights) in Le Bar-sur-Loup, pointing to opportunities in the extended-stay market.
Recommendations
- Align with the market by considering a 2 Nights minimum stay, as 27.7% of Le Bar-sur-Loup hosts use this setting.
- If feasible, allowing 1-night stays, especially midweek or during low season, could capture last-minute bookings, as only 8.5% currently do.
- Explore offering discounts for stays of 30+ nights to attract the 10.6% of the market seeking extended stays.
- Adjust minimum nights based on seasonality – potentially shorter during low season and longer during peak demand periods in Le Bar-sur-Loup.
Le Bar-sur-Loup Airbnb Cancellation Policy Trends Analysis (2025)
Flexible
11 listings
25% of total
Moderate
13 listings
29.5% of total
Firm
8 listings
18.2% of total
Strict
12 listings
27.3% of total
Cancellation Policy Insights for Le Bar-sur-Loup
- The prevailing Airbnb cancellation policy trend in Le Bar-sur-Loup is Moderate, used by 29.5% of listings.
- There's a relatively balanced mix between guest-friendly (54.5%) and stricter (45.5%) policies, offering choices for different guest needs.
Recommendations for Hosts
- Consider adopting a Moderate policy to align with the 29.5% market standard in Le Bar-sur-Loup.
- Regularly review your cancellation policy against competitors and market demand shifts in Le Bar-sur-Loup.
Le Bar-sur-Loup STR Booking Lead Time Analysis (2025)
Average Booking Lead Time by Month
Booking Lead Time Insights for Le Bar-sur-Loup
- The overall average booking lead time for vacation rentals in Le Bar-sur-Loup is 72 days.
- Guests book furthest in advance for stays during May (average 108 days), likely coinciding with peak travel demand or local events.
- The shortest booking windows occur for stays in November (average 29 days), indicating more last-minute travel plans during this time.
- Seasonally, Summer (82 days avg.) sees the longest lead times, while Winter (51 days avg.) has the shortest, reflecting typical travel planning cycles.
Recommendations for Hosts
- Use the overall average lead time (72 days) as a baseline for your pricing and availability strategy in Le Bar-sur-Loup.
- For May stays, consider implementing length-of-stay discounts or slightly higher rates for bookings made less than 108 days out to capitalize on advance planning.
- Target marketing efforts for the Summer season well in advance (at least 82 days) to capture early planners.
- Monitor your own booking lead times against these Le Bar-sur-Loup averages to identify opportunities for dynamic pricing adjustments.
Popular & Essential Airbnb Amenities in Le Bar-sur-Loup (2025)
Amenity Prevalence
Amenity Insights for Le Bar-sur-Loup
- Essential amenities in Le Bar-sur-Loup that guests expect include: Kitchen, Hot water. Lacking these (any) could significantly impact bookings.
- Popular amenities like Heating, Wifi, Dishes and silverware are common but not universal. Offering these can provide a competitive edge.
- Warning: Wifi is not universally provided but is considered essential globally. Ensure reliable Wifi is offered.
Recommendations for Hosts
- Ensure your listing includes all essential amenities for Le Bar-sur-Loup: Kitchen, Hot water.
- Prioritize adding missing essentials: Kitchen, Hot water.
- Consider adding popular differentiators like Heating or Wifi to increase appeal.
- Highlight unique or less common amenities you offer (e.g., hot tub, dedicated workspace, EV charger) in your listing description and photos.
- Regularly check competitor amenities in Le Bar-sur-Loup to stay competitive.
Le Bar-sur-Loup Airbnb Guest Demographics & Profile Analysis (2025)
Guest Profile Summary for Le Bar-sur-Loup
- The typical guest profile for Airbnb in Le Bar-sur-Loup consists of a mix of domestic (48%) and international guests, with top international origins including Germany, typically belonging to the Post-2000s (Gen Z/Alpha) group (50%), primarily speaking English or French.
- Domestic travelers account for 47.6% of guests.
- Key international markets include France (47.6%) and Germany (15%).
- Top languages spoken are English (34.8%) followed by French (30.1%).
- A significant demographic segment is the Post-2000s (Gen Z/Alpha) group, representing 50% of guests.
Recommendations for Hosts
- Balance marketing efforts between domestic and international channels based on the guest mix.
- Tailor amenities and listing descriptions to appeal to the dominant Post-2000s (Gen Z/Alpha) demographic (e.g., highlight fast WiFi, smart home features, local guides).
- Highlight unique local experiences or amenities relevant to the primary guest profile.
- Consider seasonal promotions aligned with peak travel times for key origin markets.
Nearby Short-Term Rental Market Comparison
How does the Le Bar-sur-Loup Airbnb market stack up against its neighbors? Compare key performance metrics like average monthly revenue, ADR, and occupancy rates in surrounding areas to understand the broader regional STR landscape.
| Market | Active Properties | Monthly Revenue | Daily Rate | Avg. Occupancy |
|---|---|---|---|---|
| Monteu Roero | 16 | $4,432 | $540.14 | 36% |
| Ramatuelle | 213 | $3,891 | $670.10 | 41% |
| Saint-Jean-Cap-Ferrat | 107 | $3,844 | $424.21 | 46% |
| Saint-Tropez | 742 | $3,498 | $506.57 | 41% |
| Èze | 153 | $3,168 | $345.84 | 47% |
| Chantepérier | 20 | $3,057 | $281.60 | 37% |
| Opio | 40 | $3,057 | $540.62 | 37% |
| Villefranche-sur-Mer | 501 | $2,977 | $268.57 | 52% |
| Gassin | 384 | $2,939 | $434.44 | 40% |
| Gordes | 225 | $2,913 | $366.32 | 43% |