Hyères Airbnb Market Analysis 2025: Short Term Rental Data & Vacation Rental Statistics in Provence-Alpes-Côte d'Azur, France
Is Airbnb profitable in Hyères in 2025? Explore comprehensive Airbnb analytics for Hyères, Provence-Alpes-Côte d'Azur, France to uncover income potential. This 2025 STR market report for Hyères, based on AirROI data from April 2024 to March 2025, reveals key trends in the bustling market of 2,003 active listings.
Whether you're considering an Airbnb investment in Hyères, optimizing your existing vacation rental, or exploring rental arbitrage opportunities, understanding the Hyères Airbnb data is crucial. Leveraging the low regulation environment is key to maximizing your short term rental income potential. Let's dive into the specifics.
Key Hyères Airbnb Performance Metrics Overview
Monthly Airbnb Revenue Variations & Income Potential in Hyères (2025)
Understanding the monthly revenue variations for Airbnb listings in Hyères is key to maximizing your short term rental income potential. Seasonality significantly impacts earnings. Our analysis, based on data from the past 12 months, shows that the peak revenue month for STRs in Hyères is typically August, while January often presents the lowest earnings, highlighting opportunities for strategic pricing adjustments during shoulder and low seasons. Explore the typical Airbnb income in Hyères across different performance tiers:
- Best-in-class properties (Top 10%) achieve $3,661+ monthly, often utilizing dynamic pricing and superior guest experiences.
- Strong performing properties (Top 25%) earn $2,261 or more, indicating effective management and desirable locations/amenities.
- Typical properties (Median) generate around $1,343 per month, representing the average market performance.
- Entry-level properties (Bottom 25%) see earnings around $688, often with potential for optimization.
Average Monthly Airbnb Earnings Trend in Hyères
Hyères Airbnb Occupancy Rate Trends (2025)
Maximize your bookings by understanding the Hyères STR occupancy trends. Seasonal demand shifts significantly influence how often properties are booked. Typically, Augustsees the highest demand (peak season occupancy), while January experiences the lowest (low season). Effective strategies, like adjusting minimum stays or offering promotions, can boost occupancy during slower periods. Here's how different property tiers perform in Hyères:
- Best-in-class properties (Top 10%) achieve 78%+ occupancy, indicating high desirability and potentially optimized availability.
- Strong performing properties (Top 25%) maintain 60% or higher occupancy, suggesting good market fit and guest satisfaction.
- Typical properties (Median) have an occupancy rate around 39%.
- Entry-level properties (Bottom 25%) average 19% occupancy, potentially facing higher vacancy.
Average Monthly Occupancy Rate Trend in Hyères
Average Daily Rate (ADR) Airbnb Trends in Hyères (2025)
Effective short term rental pricing strategy in Hyères involves understanding monthly ADR fluctuations. The Average Daily Rate (ADR) for Airbnb in Hyères typically peaks in August and dips lowest during March. Leveraging Airbnb dynamic pricing tools or strategies based on this seasonality can significantly boost revenue. Here's a look at the typical nightly rates achieved:
- Best-in-class properties (Top 10%) command rates of $267+ per night, often due to premium features or locations.
- Strong performing properties (Top 25%) achieve nightly rates of $157 or more.
- Typical properties (Median) charge around $103 per night.
- Entry-level properties (Bottom 25%) earn around $74 per night.
Average Daily Rate (ADR) Trend by Month in Hyères
Get Live Hyères Market Intelligence 👇

Explore Real-time Analytics
Airbnb Seasonality Analysis & Trends in Hyères (2025)
Peak Season (August, July, June)
- Revenue averages $3,013 per month
- Occupancy rates average 55.5%
- Daily rates average $163
Shoulder Season
- Revenue averages $1,744 per month
- Occupancy maintains around 39.1%
- Daily rates hold near $147
Low Season (January, February, March)
- Revenue drops to average $1,011 per month
- Occupancy decreases to average 29.6%
- Daily rates adjust to average $137
Seasonality Insights for Hyères
- The Airbnb seasonality in Hyères shows highly seasonal trends requiring careful strategy. While the sections above show seasonal averages, it's also insightful to look at the extremes:
- During the high season, the absolute peak month showcases Hyères's highest earning potential, with monthly revenues capable of climbing to $3,609, occupancy reaching a high of 69.4%, and ADRs peaking at $165.
- Conversely, the slowest single month of the year, typically falling within the low season, marks the market's lowest point. In this month, revenue might dip to $973, occupancy could drop to 26.7%, and ADRs may adjust down to $136.
- Understanding both the seasonal averages and these monthly peaks and troughs in revenue, occupancy, and ADR is crucial for maximizing your Airbnb profit potential in Hyères.
Seasonal Strategies for Maximizing Profit
- Peak Season: Maximize revenue through premium pricing and potentially longer minimum stays. Ensure high availability.
- Low Season: Offer competitive pricing, special promotions (e.g., extended stay discounts), and flexible cancellation policies. Target off-season travelers like remote workers or budget-conscious guests.
- Shoulder Seasons: Implement dynamic pricing that balances peak and low rates. Target weekend travelers or specific events. Offer slightly more flexible terms than peak season.
- Regularly analyze your own performance against these Hyères seasonality benchmarks and adjust your pricing and availability strategy accordingly.
Best Areas for Airbnb Investment in Hyères (2025)
Exploring the top neighborhoods for short-term rentals in Hyères? This section highlights key areas, outlining why they are attractive for hosts and guests, along with notable local attractions. Consider these locations based on your target guest profile and investment strategy.
| Neighborhood / Area | Why Host Here? (Target Guests & Appeal) | Key Attractions & Landmarks |
|---|---|---|
| Port Saint Pierre | A picturesque area known for its marina and stunning views of the Mediterranean. Ideal for tourists looking for sailing experiences and coastal relaxation. | Port de Hyères, Hyères beaches, strolling along the seaside, restaurants with local seafood, water sports activities |
| l'île de Porquerolles | A beautiful island destination with pristine beaches and nature reserves. Perfect for eco-tourism and those looking to escape into nature while enjoying outdoor activities. | Plage Notre-Dame, Porquerolles National Park, biking trails, vines and vineyards, the picturesque village |
| Giens Peninsula | Famous for its unique landscapes, beaches, and villages. A draw for both beach lovers and those interested in hiking and exploring coastal paths. | Les Oliviers beach, Mediterranean flora and fauna, hiking along coastal paths, the village of Giens, water sports hubs |
| Hyères Old Town | The historic center of Hyères full of charm, medieval architecture and picturesque streets. Appeals to tourists interested in history and local culture. | Castle of Hyères, Old Town streets, local markets, historic churches, art galleries |
| La Capte | A serene area with beautiful beaches and a relaxed atmosphere. Attracts families and couples looking for a quieter beach experience. | Plage de la Capte, windy beach walks, local cafes, scenic picnic spots, family-friendly beaches |
| Les Salins | Known for its salt marshes and rich wildlife, this area attracts nature enthusiasts and those looking for unique geographical features. | Les Salins beach, birdwatching, nature reserves, salt production heritage, biking along the coastline |
| Cavalière | A charming seaside neighborhood with small golden sandy beaches, popular with families and those looking for a laid-back beach holiday. | Cavalière beach, beachside restaurants, family-friendly accommodation, water sports rentals, coastal pathways |
| Hyères Port | The vibrant port area with a variety of restaurants and bars, offering lively nightlife and connectivity to boat trips and excursions. | Marina of Hyères, restaurants with views of the harbor, boat excursions to islands, nightlife venues, local events |
Understanding Airbnb License Requirements & STR Laws in Hyères (2025)
While Hyères, Provence-Alpes-Côte d'Azur, France currently shows low STR regulations, specific Airbnb license requirements might still exist or change. Always verify the latest short term rental regulations and Airbnb license requirements directly with local government authorities for Hyères to ensure full compliance before hosting.
(Source: AirROI data, 2025, based on 7% licensed listings)
Top Performing Airbnb Properties in Hyères (2025)
Benchmark your potential! Explore examples of top-performing Airbnb properties in Hyèresbased on Trailing Twelve Month (TTM) revenue. Analyze their characteristics, revenue, occupancy rate, and ADR to understand what drives success in this market.

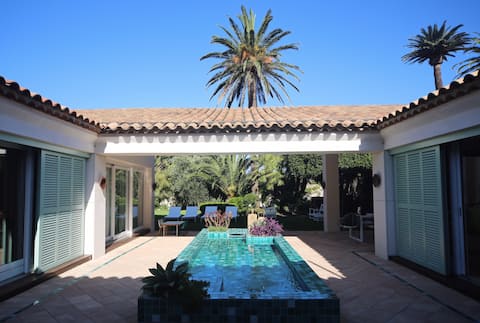
Sublime Villa PALMA Sea View Heated Pool Sauna
Entire Place • 4 bedrooms
Unique- Beautiful Villa in Porquerolles
Entire Place • 7 bedrooms
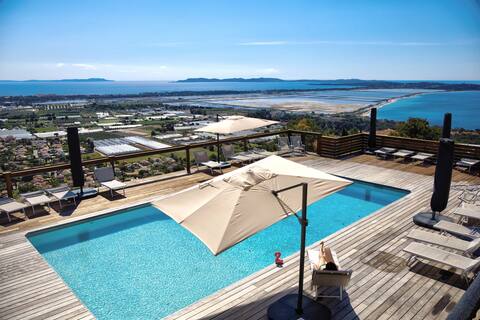
Set of luxury exceptional sea view 24P+ 2Enf
Entire Place • 13 bedrooms
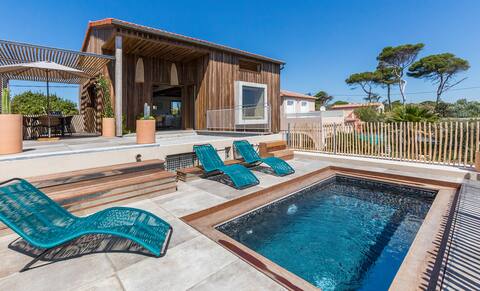
Architect villa on the beachfront in La Capte
Entire Place • 4 bedrooms
Villa Mer Piscine - Port Niel- 10 adultes 6 enfts
Entire Place • 6 bedrooms

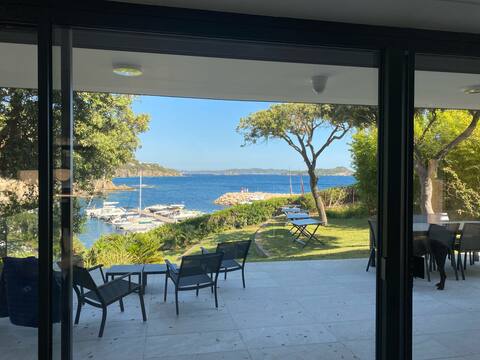
Villa La Sarrazine • Port du Niel • Sea View
Entire Place • 5 bedrooms
Note: Performance varies based on location, size, amenities, seasonality, and management quality. Data reflects the past 12 months.
Top Performing Airbnb Hosts in Hyères (2025)
Learn from the best! This table showcases top-performing Airbnb hosts in Hyères based on the number of properties managed and estimated total revenue over the past year. Analyze their scale and performance metrics.
| Host Name | Properties | Grossing Revenue | Stay Reviews | Avg Rating |
|---|---|---|---|---|
| Grégory & Alexandra Lopez | 73 | $1,080,485 | 1643 | 3.86/5.0 |
| Host #454250580 | 7 | $439,152 | 1 | 0.00/5.0 |
| Christophe | 18 | $353,956 | 1233 | 4.32/5.0 |
| Hacena - Interhome Group | 33 | $318,829 | 76 | 1.84/5.0 |
| Sabrina | 4 | $278,701 | 64 | 3.55/5.0 |
| Anne Et Anita | 20 | $270,754 | 302 | 3.77/5.0 |
| Christopher | 10 | $263,597 | 536 | 4.16/5.0 |
| Alan | 5 | $261,115 | 56 | 4.89/5.0 |
| Hyeres Conciergerie | 33 | $248,685 | 244 | 2.32/5.0 |
| Celine | 12 | $233,925 | 500 | 4.53/5.0 |
Analyzing the strategies of top hosts, such as their property selection, pricing, and guest communication, can offer valuable lessons for optimizing your own Airbnb operations in Hyères.
Dive Deeper: Advanced Hyères STR Market Data (2025)
Ready to unlock more insights? AirROI provides access to advanced metrics and comprehensive Airbnb data for Hyères. Explore detailed analytics beyond this report to refine your investment strategy, optimize pricing, and maximize your vacation rental profits.
Explore Advanced MetricsHyères Short-Term Rental Market Composition (2025): Property & Room Types
Room Type Distribution
Property Type Distribution
Market Composition Insights for Hyères
- The Hyères Airbnb market composition is heavily skewed towards Entire Home/Apt listings, which make up 95.3% of the 2,003 active rentals. This indicates strong guest preference for privacy and space.
- Looking at the property type distribution in Hyères, Apartment/Condo properties are the most common (66.4%), reflecting the local real estate landscape.
- Houses represent a significant 27.9% portion, catering likely to families or larger groups.
- Smaller segments like hotel/boutique, outdoor/unique, others, unique stays (combined 5.6%) offer potential for unique stay experiences.
Hyères Airbnb Room Capacity Analysis (2025): Bedroom Distribution
Distribution of Listings by Number of Bedrooms
Room Capacity Insights for Hyères
- The dominant room capacity in Hyères is 1 bedroom listings, making up 42.9% of the market. This suggests a strong demand for properties suitable for couples or solo travelers.
- Together, 1 bedroom and 2 bedrooms properties represent 67.6% of the active Airbnb listings in Hyères, indicating a high concentration in these sizes.
Hyères Vacation Rental Guest Capacity Trends (2025)
Distribution of Listings by Guest Capacity
Guest Capacity Insights for Hyères
- The most common guest capacity trend in Hyères vacation rentals is listings accommodating 4 guests (39.1%). This suggests the primary traveler segment is likely small families or groups.
- Properties designed for 4 guests and 2 guests dominate the Hyères STR market, accounting for 60.1% of listings.
- 24.8% of properties accommodate 6+ guests, serving the market segment for larger families or group travel in Hyères.
- On average, properties in Hyères are equipped to host 4.2 guests.
Hyères Airbnb Booking Patterns (2025): Available vs. Booked Days
Available Days Distribution
Booked Days Distribution
Booking Pattern Insights for Hyères
- The most common availability pattern in Hyères falls within the 271-366 days range, representing 50.9% of listings. This suggests many properties have significant open periods on their calendars.
- Approximately 84.0% of listings show high availability (181+ days open annually), indicating potential for increased bookings or specific owner usage patterns.
- For booked days, the 91-180 days range is most frequent in Hyères (33.8%), reflecting common guest stay durations or potential owner blocking patterns.
- A notable 16.8% of properties secure long booking periods (181+ days booked per year), highlighting successful long-term rental strategies or significant owner usage.
Hyères Airbnb Minimum Stay Requirements Analysis
Distribution of Listings by Minimum Night Requirement
1 Night
246 listings
13.2% of total
2 Nights
443 listings
23.7% of total
3 Nights
351 listings
18.8% of total
4-6 Nights
418 listings
22.4% of total
7-29 Nights
233 listings
12.5% of total
30+ Nights
179 listings
9.6% of total
Key Insights
- The most prevalent minimum stay requirement in Hyères is 2 Nights, adopted by 23.7% of listings. This highlights the market's preference for shorter, flexible bookings.
Recommendations
- Align with the market by considering a 2 Nights minimum stay, as 23.7% of Hyères hosts use this setting.
- If feasible, allowing 1-night stays, especially midweek or during low season, could capture last-minute bookings, as only 13.2% currently do.
- Explore offering discounts for stays of 30+ nights to attract the 9.6% of the market seeking extended stays.
- Adjust minimum nights based on seasonality – potentially shorter during low season and longer during peak demand periods in Hyères.
Hyères Airbnb Cancellation Policy Trends Analysis (2025)
Non-refundable
14 listings
0.8% of total
Super Strict 30 Days
29 listings
1.7% of total
Super Strict 60 Days
6 listings
0.4% of total
Refundable
10 listings
0.6% of total
Flexible
249 listings
14.9% of total
Moderate
422 listings
25.2% of total
Firm
424 listings
25.3% of total
Strict
519 listings
31% of total
Cancellation Policy Insights for Hyères
- The prevailing Airbnb cancellation policy trend in Hyères is Strict, used by 31% of listings.
- A majority (56.3%) of hosts in Hyères utilize Firm or Strict policies, indicating a market where hosts prioritize booking security.
Recommendations for Hosts
- Consider adopting a Strict policy to align with the 31% market standard in Hyères.
- With 31% using Strict terms, this is a viable option in Hyères, particularly for high-value properties or during peak demand periods.
- Regularly review your cancellation policy against competitors and market demand shifts in Hyères.
Hyères STR Booking Lead Time Analysis (2025)
Average Booking Lead Time by Month
Booking Lead Time Insights for Hyères
- The overall average booking lead time for vacation rentals in Hyères is 56 days.
- Guests book furthest in advance for stays during July (average 92 days), likely coinciding with peak travel demand or local events.
- The shortest booking windows occur for stays in March (average 31 days), indicating more last-minute travel plans during this time.
- Seasonally, Summer (85 days avg.) sees the longest lead times, while Winter (36 days avg.) has the shortest, reflecting typical travel planning cycles.
Recommendations for Hosts
- Use the overall average lead time (56 days) as a baseline for your pricing and availability strategy in Hyères.
- For July stays, consider implementing length-of-stay discounts or slightly higher rates for bookings made less than 92 days out to capitalize on advance planning.
- Target marketing efforts for the Summer season well in advance (at least 85 days) to capture early planners.
- Monitor your own booking lead times against these Hyères averages to identify opportunities for dynamic pricing adjustments.
Popular & Essential Airbnb Amenities in Hyères (2025)
Amenity Prevalence
Amenity Insights for Hyères
- Essential amenities in Hyères that guests expect include: Kitchen. Lacking these (this) could significantly impact bookings.
- Popular amenities like Heating, TV, Hot water are common but not universal. Offering these can provide a competitive edge.
- Warning: Wifi is not universally provided but is considered essential globally. Ensure reliable Wifi is offered.
Recommendations for Hosts
- Ensure your listing includes all essential amenities for Hyères: Kitchen.
- Prioritize adding missing essentials: Kitchen.
- Consider adding popular differentiators like Heating or TV to increase appeal.
- Highlight unique or less common amenities you offer (e.g., hot tub, dedicated workspace, EV charger) in your listing description and photos.
- Regularly check competitor amenities in Hyères to stay competitive.
Hyères Airbnb Guest Demographics & Profile Analysis (2025)
Guest Profile Summary for Hyères
- The typical guest profile for Airbnb in Hyères consists of primarily domestic travelers (75%), often arriving from nearby Paris, typically belonging to the Post-2000s (Gen Z/Alpha) group (50%), primarily speaking French or English.
- Domestic travelers account for 75.3% of guests.
- Key international markets include France (75.3%) and Germany (6%).
- Top languages spoken are French (38.4%) followed by English (33.6%).
- A significant demographic segment is the Post-2000s (Gen Z/Alpha) group, representing 50% of guests.
Recommendations for Hosts
- Target domestic marketing efforts towards travelers from Paris and Lyon.
- Tailor amenities and listing descriptions to appeal to the dominant Post-2000s (Gen Z/Alpha) demographic (e.g., highlight fast WiFi, smart home features, local guides).
- Highlight unique local experiences or amenities relevant to the primary guest profile.
- Consider seasonal promotions aligned with peak travel times for key origin markets.
Nearby Short-Term Rental Market Comparison
How does the Hyères Airbnb market stack up against its neighbors? Compare key performance metrics like average monthly revenue, ADR, and occupancy rates in surrounding areas to understand the broader regional STR landscape.
| Market | Active Properties | Monthly Revenue | Daily Rate | Avg. Occupancy |
|---|---|---|---|---|
| Monteu Roero | 16 | $4,432 | $540.14 | 36% |
| Ramatuelle | 213 | $3,891 | $670.10 | 41% |
| Saint-Jean-Cap-Ferrat | 107 | $3,844 | $424.21 | 46% |
| Saint-Tropez | 742 | $3,498 | $506.57 | 41% |
| Èze | 153 | $3,168 | $345.84 | 47% |
| Chantepérier | 20 | $3,057 | $281.60 | 37% |
| Opio | 40 | $3,057 | $540.62 | 37% |
| Villefranche-sur-Mer | 501 | $2,977 | $268.57 | 52% |
| Gassin | 384 | $2,939 | $434.44 | 40% |
| Gordes | 225 | $2,913 | $366.32 | 43% |