Gorbio Airbnb Market Analysis 2025: Short Term Rental Data & Vacation Rental Statistics in Provence-Alpes-Côte d'Azur, France
Is Airbnb profitable in Gorbio in 2025? Explore comprehensive Airbnb analytics for Gorbio, Provence-Alpes-Côte d'Azur, France to uncover income potential. This 2025 STR market report for Gorbio, based on AirROI data from April 2024 to March 2025, reveals key trends in the niche market of 20 active listings.
Whether you're considering an Airbnb investment in Gorbio, optimizing your existing vacation rental, or exploring rental arbitrage opportunities, understanding the Gorbio Airbnb data is crucial. Leveraging the low regulation environment is key to maximizing your short term rental income potential. Let's dive into the specifics.
Key Gorbio Airbnb Performance Metrics Overview
Monthly Airbnb Revenue Variations & Income Potential in Gorbio (2025)
Understanding the monthly revenue variations for Airbnb listings in Gorbio is key to maximizing your short term rental income potential. Seasonality significantly impacts earnings. Our analysis, based on data from the past 12 months, shows that the peak revenue month for STRs in Gorbio is typically August, while January often presents the lowest earnings, highlighting opportunities for strategic pricing adjustments during shoulder and low seasons. Explore the typical Airbnb income in Gorbio across different performance tiers:
- Best-in-class properties (Top 10%) achieve $3,831+ monthly, often utilizing dynamic pricing and superior guest experiences.
- Strong performing properties (Top 25%) earn $2,259 or more, indicating effective management and desirable locations/amenities.
- Typical properties (Median) generate around $1,553 per month, representing the average market performance.
- Entry-level properties (Bottom 25%) see earnings around $1,043, often with potential for optimization.
Average Monthly Airbnb Earnings Trend in Gorbio
Gorbio Airbnb Occupancy Rate Trends (2025)
Maximize your bookings by understanding the Gorbio STR occupancy trends. Seasonal demand shifts significantly influence how often properties are booked. Typically, Augustsees the highest demand (peak season occupancy), while November experiences the lowest (low season). Effective strategies, like adjusting minimum stays or offering promotions, can boost occupancy during slower periods. Here's how different property tiers perform in Gorbio:
- Best-in-class properties (Top 10%) achieve 74%+ occupancy, indicating high desirability and potentially optimized availability.
- Strong performing properties (Top 25%) maintain 60% or higher occupancy, suggesting good market fit and guest satisfaction.
- Typical properties (Median) have an occupancy rate around 43%.
- Entry-level properties (Bottom 25%) average 31% occupancy, potentially facing higher vacancy.
Average Monthly Occupancy Rate Trend in Gorbio
Average Daily Rate (ADR) Airbnb Trends in Gorbio (2025)
Effective short term rental pricing strategy in Gorbio involves understanding monthly ADR fluctuations. The Average Daily Rate (ADR) for Airbnb in Gorbio typically peaks in July and dips lowest during March. Leveraging Airbnb dynamic pricing tools or strategies based on this seasonality can significantly boost revenue. Here's a look at the typical nightly rates achieved:
- Best-in-class properties (Top 10%) command rates of $236+ per night, often due to premium features or locations.
- Strong performing properties (Top 25%) achieve nightly rates of $128 or more.
- Typical properties (Median) charge around $101 per night.
- Entry-level properties (Bottom 25%) earn around $81 per night.
Average Daily Rate (ADR) Trend by Month in Gorbio
Get Live Gorbio Market Intelligence 👇

Explore Real-time Analytics
Airbnb Seasonality Analysis & Trends in Gorbio (2025)
Peak Season (August, July, June)
- Revenue averages $3,523 per month
- Occupancy rates average 68.4%
- Daily rates average $174
Shoulder Season
- Revenue averages $2,221 per month
- Occupancy maintains around 42.0%
- Daily rates hold near $170
Low Season (January, February, March)
- Revenue drops to average $1,060 per month
- Occupancy decreases to average 29.8%
- Daily rates adjust to average $163
Seasonality Insights for Gorbio
- The Airbnb seasonality in Gorbio shows highly seasonal trends requiring careful strategy. While the sections above show seasonal averages, it's also insightful to look at the extremes:
- During the high season, the absolute peak month showcases Gorbio's highest earning potential, with monthly revenues capable of climbing to $3,700, occupancy reaching a high of 82.7%, and ADRs peaking at $176.
- Conversely, the slowest single month of the year, typically falling within the low season, marks the market's lowest point. In this month, revenue might dip to $866, occupancy could drop to 24.1%, and ADRs may adjust down to $159.
- Understanding both the seasonal averages and these monthly peaks and troughs in revenue, occupancy, and ADR is crucial for maximizing your Airbnb profit potential in Gorbio.
Seasonal Strategies for Maximizing Profit
- Peak Season: Maximize revenue through premium pricing and potentially longer minimum stays. Ensure high availability.
- Low Season: Offer competitive pricing, special promotions (e.g., extended stay discounts), and flexible cancellation policies. Target off-season travelers like remote workers or budget-conscious guests.
- Shoulder Seasons: Implement dynamic pricing that balances peak and low rates. Target weekend travelers or specific events. Offer slightly more flexible terms than peak season.
- Regularly analyze your own performance against these Gorbio seasonality benchmarks and adjust your pricing and availability strategy accordingly.
Best Areas for Airbnb Investment in Gorbio (2025)
Exploring the top neighborhoods for short-term rentals in Gorbio? This section highlights key areas, outlining why they are attractive for hosts and guests, along with notable local attractions. Consider these locations based on your target guest profile and investment strategy.
| Neighborhood / Area | Why Host Here? (Target Guests & Appeal) | Key Attractions & Landmarks |
|---|---|---|
| Gorbio Village | Charming medieval village with stunning views, ideal for those seeking a quaint Provencal experience. Close to larger cities yet retains a unique character and local charm. | Historic Gorbio Castle, Local artisan shops, Scenic hiking trails, Beautiful countryside, Traditional Provencal architecture |
| Menton | Known as the 'Pearl of France', Menton offers a coastal resort experience with beautiful beaches and gardens. Popular among tourists for its mild climate and Italian influence. | Basilica of Saint Michael, Val Rahmeh Botanical Garden, Menton Beaches, Lemon Festival, Old Town |
| Roquebrune-Cap-Martin | A picturesque coastal commune renowned for its stunning Mediterranean views and diverse landscape, perfect for investing in luxury vacation rentals close to Monaco. | Roquebrune Castle, Cap Martin beaches, Walking trails along the coast, Italian Riviera close by |
| Saint-Jean-Cap-Ferrat | An upscale destination known for luxury villas and beautiful landscapes, ideal for high-end Airbnb listings targeting affluent travelers. | Villa Ephrussi de Rothschild, Saint-Jean Beach, Cap Ferrat Coastal Walk, Grande Corniche views |
| Beaulieu-sur-Mer | A scenic town between Nice and Monaco, known for its lovely waterfront and charm, attracting visitors for its relaxing atmosphere and Mediterranean lifestyle. | Villa Kerylos, Beaulieu beaches, Market Square, St. Michael's Church |
| Nice | The capital of the French Riviera, with an extensive promenade, rich culture, and diverse attractions, ensuring a steady influx of tourists year-round. | Promenade des Anglais, Old Town (Vieux Nice), Castle Hill, Marc Chagall National Museum, Cours Saleya Market |
| Villefranche-sur-Mer | A picturesque harbor town known for its stunning bay and heritage, offering a charming alternative to the bustling Nice with a close-knit local vibe. | Citadel of Villefranche, Beautiful beaches, Old Town harbor, Coastal hiking paths |
| Cap d'Ail | Nestled between Monaco and Nice, this small commune offers access to pristine beaches and stunning coastal views, making it appealing for renters looking for seaside getaways. | Plage de la Marquet, Rondelli Beach, Coastal trails, Nearby access to Monaco attractions |
Understanding Airbnb License Requirements & STR Laws in Gorbio (2025)
While Gorbio, Provence-Alpes-Côte d'Azur, France currently shows low STR regulations, specific Airbnb license requirements might still exist or change. Always verify the latest short term rental regulations and Airbnb license requirements directly with local government authorities for Gorbio to ensure full compliance before hosting.
(Source: AirROI data, 2025, based on 5% licensed listings)
Top Performing Airbnb Properties in Gorbio (2025)
Benchmark your potential! Explore examples of top-performing Airbnb properties in Gorbiobased on Trailing Twelve Month (TTM) revenue. Analyze their characteristics, revenue, occupancy rate, and ADR to understand what drives success in this market.

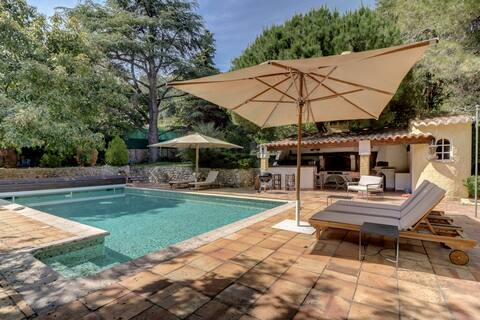
Family Home with great View!
Entire Place • 5 bedrooms
Villa de vacances privée
Entire Place • 5 bedrooms
3 rooms crossing the mountain sea, 60 m2, quiet
Entire Place • 2 bedrooms
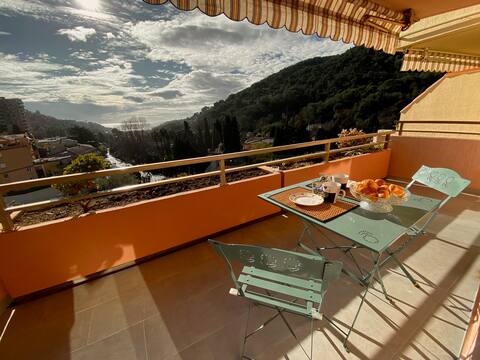
Stunning T2 condominium with swimming pool
Entire Place • 1 bedroom
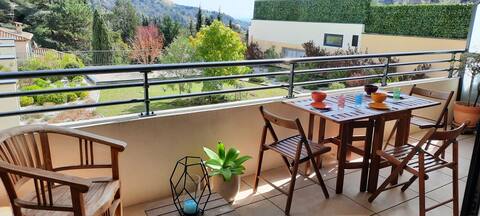
Beautiful apartment, pool, parking.
Entire Place • 1 bedroom
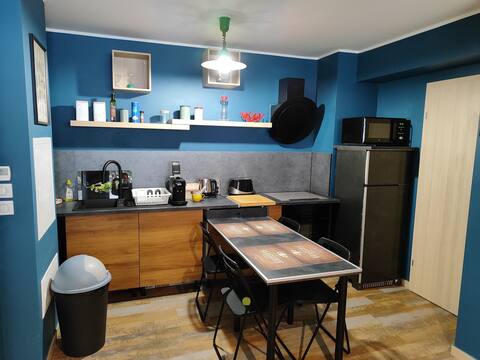
Petit havre de paix Provençal
Entire Place • 1 bedroom
Note: Performance varies based on location, size, amenities, seasonality, and management quality. Data reflects the past 12 months.
Top Performing Airbnb Hosts in Gorbio (2025)
Learn from the best! This table showcases top-performing Airbnb hosts in Gorbio based on the number of properties managed and estimated total revenue over the past year. Analyze their scale and performance metrics.
| Host Name | Properties | Grossing Revenue | Stay Reviews | Avg Rating |
|---|---|---|---|---|
| Olessia | 1 | $140,864 | 34 | 4.97/5.0 |
| Host #248606554 | 1 | $32,867 | 5 | 4.80/5.0 |
| Regis | 1 | $28,301 | 10 | 5.00/5.0 |
| Béatrice | 1 | $23,688 | 89 | 4.80/5.0 |
| Wendy | 2 | $22,720 | 58 | 4.93/5.0 |
| Cyril Tony Brother | 1 | $22,258 | 117 | 4.56/5.0 |
| Kathryn | 1 | $20,714 | 111 | 4.93/5.0 |
| Celine | 1 | $19,545 | 61 | 4.80/5.0 |
| Cédric | 1 | $18,460 | 49 | 4.88/5.0 |
| Marie-France | 1 | $18,212 | 84 | 4.87/5.0 |
Analyzing the strategies of top hosts, such as their property selection, pricing, and guest communication, can offer valuable lessons for optimizing your own Airbnb operations in Gorbio.
Dive Deeper: Advanced Gorbio STR Market Data (2025)
Ready to unlock more insights? AirROI provides access to advanced metrics and comprehensive Airbnb data for Gorbio. Explore detailed analytics beyond this report to refine your investment strategy, optimize pricing, and maximize your vacation rental profits.
Explore Advanced MetricsGorbio Short-Term Rental Market Composition (2025): Property & Room Types
Room Type Distribution
Property Type Distribution
Market Composition Insights for Gorbio
- The Gorbio Airbnb market composition is heavily skewed towards Entire Home/Apt listings, which make up 95% of the 20 active rentals. This indicates strong guest preference for privacy and space.
- Looking at the property type distribution in Gorbio, Apartment/Condo properties are the most common (60%), reflecting the local real estate landscape.
- Houses represent a significant 40% portion, catering likely to families or larger groups.
Gorbio Airbnb Room Capacity Analysis (2025): Bedroom Distribution
Distribution of Listings by Number of Bedrooms
Room Capacity Insights for Gorbio
- The dominant room capacity in Gorbio is 1 bedroom listings, making up 60% of the market. This suggests a strong demand for properties suitable for couples or solo travelers.
- Together, 1 bedroom and 2 bedrooms properties represent 80.0% of the active Airbnb listings in Gorbio, indicating a high concentration in these sizes.
- With over half the market (60%) consisting of studios or 1-bedroom units, Gorbio is particularly well-suited for individuals or couples.
Gorbio Vacation Rental Guest Capacity Trends (2025)
Distribution of Listings by Guest Capacity
Guest Capacity Insights for Gorbio
- The most common guest capacity trend in Gorbio vacation rentals is listings accommodating 4 guests (45%). This suggests the primary traveler segment is likely small families or groups.
- Properties designed for 4 guests and 2 guests dominate the Gorbio STR market, accounting for 60.0% of listings.
- On average, properties in Gorbio are equipped to host 4.0 guests.
Gorbio Airbnb Booking Patterns (2025): Available vs. Booked Days
Available Days Distribution
Booked Days Distribution
Booking Pattern Insights for Gorbio
- The most common availability pattern in Gorbio falls within the 181-270 days range, representing 40% of listings. This suggests many properties have significant open periods on their calendars.
- Approximately 65.0% of listings show high availability (181+ days open annually), indicating potential for increased bookings or specific owner usage patterns.
- For booked days, the 91-180 days range is most frequent in Gorbio (40%), reflecting common guest stay durations or potential owner blocking patterns.
- A notable 35.0% of properties secure long booking periods (181+ days booked per year), highlighting successful long-term rental strategies or significant owner usage.
Gorbio Airbnb Minimum Stay Requirements Analysis
Distribution of Listings by Minimum Night Requirement
1 Night
2 listings
10.5% of total
2 Nights
8 listings
42.1% of total
3 Nights
3 listings
15.8% of total
4-6 Nights
3 listings
15.8% of total
7-29 Nights
2 listings
10.5% of total
30+ Nights
1 listings
5.3% of total
Key Insights
- The most prevalent minimum stay requirement in Gorbio is 2 Nights, adopted by 42.1% of listings. This highlights the market's preference for shorter, flexible bookings.
Recommendations
- Align with the market by considering a 2 Nights minimum stay, as 42.1% of Gorbio hosts use this setting.
- If feasible, allowing 1-night stays, especially midweek or during low season, could capture last-minute bookings, as only 10.5% currently do.
- A 2-night minimum appears standard (42.1%). Consider this for weekends or peak periods.
- Explore offering discounts for stays of 30+ nights to attract the 5.3% of the market seeking extended stays.
- Adjust minimum nights based on seasonality – potentially shorter during low season and longer during peak demand periods in Gorbio.
Gorbio Airbnb Cancellation Policy Trends Analysis (2025)
Flexible
2 listings
11.1% of total
Moderate
5 listings
27.8% of total
Firm
6 listings
33.3% of total
Strict
5 listings
27.8% of total
Cancellation Policy Insights for Gorbio
- The prevailing Airbnb cancellation policy trend in Gorbio is Firm, used by 33.3% of listings.
- A majority (61.1%) of hosts in Gorbio utilize Firm or Strict policies, indicating a market where hosts prioritize booking security.
Recommendations for Hosts
- Consider adopting a Firm policy to align with the 33.3% market standard in Gorbio.
- Regularly review your cancellation policy against competitors and market demand shifts in Gorbio.
Gorbio STR Booking Lead Time Analysis (2025)
Average Booking Lead Time by Month
Booking Lead Time Insights for Gorbio
- The overall average booking lead time for vacation rentals in Gorbio is 58 days.
- Guests book furthest in advance for stays during July (average 122 days), likely coinciding with peak travel demand or local events.
- The shortest booking windows occur for stays in November (average 27 days), indicating more last-minute travel plans during this time.
- Seasonally, Summer (98 days avg.) sees the longest lead times, while Fall (45 days avg.) has the shortest, reflecting typical travel planning cycles.
Recommendations for Hosts
- Use the overall average lead time (58 days) as a baseline for your pricing and availability strategy in Gorbio.
- For July stays, consider implementing length-of-stay discounts or slightly higher rates for bookings made less than 122 days out to capitalize on advance planning.
- Target marketing efforts for the Summer season well in advance (at least 98 days) to capture early planners.
- Monitor your own booking lead times against these Gorbio averages to identify opportunities for dynamic pricing adjustments.
Popular & Essential Airbnb Amenities in Gorbio (2025)
Amenity Prevalence
Amenity Insights for Gorbio
- Essential amenities in Gorbio that guests expect include: Hot water. Lacking these (this) could significantly impact bookings.
- Popular amenities like Kitchen, Heating, TV are common but not universal. Offering these can provide a competitive edge.
Recommendations for Hosts
- Ensure your listing includes all essential amenities for Gorbio: Hot water.
- Prioritize adding missing essentials: Hot water.
- Consider adding popular differentiators like Kitchen or Heating to increase appeal.
- Highlight unique or less common amenities you offer (e.g., hot tub, dedicated workspace, EV charger) in your listing description and photos.
- Regularly check competitor amenities in Gorbio to stay competitive.
Gorbio Airbnb Guest Demographics & Profile Analysis (2025)
Guest Profile Summary for Gorbio
- The typical guest profile for Airbnb in Gorbio consists of primarily domestic travelers (65%), often arriving from nearby England, typically belonging to the Post-2000s (Gen Z/Alpha) group (50%), primarily speaking French or English.
- Domestic travelers account for 65.4% of guests.
- Key international markets include France (65.4%) and Germany (7%).
- Top languages spoken are French (35%) followed by English (32.1%).
- A significant demographic segment is the Post-2000s (Gen Z/Alpha) group, representing 50% of guests.
Recommendations for Hosts
- Target domestic marketing efforts towards travelers from England and Marseille.
- Tailor amenities and listing descriptions to appeal to the dominant Post-2000s (Gen Z/Alpha) demographic (e.g., highlight fast WiFi, smart home features, local guides).
- Highlight unique local experiences or amenities relevant to the primary guest profile.
- Consider seasonal promotions aligned with peak travel times for key origin markets.
Nearby Short-Term Rental Market Comparison
How does the Gorbio Airbnb market stack up against its neighbors? Compare key performance metrics like average monthly revenue, ADR, and occupancy rates in surrounding areas to understand the broader regional STR landscape.
| Market | Active Properties | Monthly Revenue | Daily Rate | Avg. Occupancy |
|---|---|---|---|---|
| Monteu Roero | 16 | $4,432 | $540.14 | 36% |
| Ramatuelle | 213 | $3,891 | $670.10 | 41% |
| Saint-Jean-Cap-Ferrat | 107 | $3,844 | $424.21 | 46% |
| Cossano Belbo | 13 | $3,632 | $284.21 | 42% |
| Saint-Tropez | 742 | $3,498 | $506.57 | 41% |
| Cassinasco | 18 | $3,219 | $545.40 | 41% |
| Èze | 153 | $3,168 | $345.84 | 47% |
| Opio | 40 | $3,057 | $540.62 | 37% |
| Villefranche-sur-Mer | 501 | $2,977 | $268.57 | 52% |
| Gassin | 384 | $2,939 | $434.44 | 40% |