Gap Airbnb Market Analysis 2025: Short Term Rental Data & Vacation Rental Statistics in Provence-Alpes-Côte d'Azur, France
Is Airbnb profitable in Gap in 2025? Explore comprehensive Airbnb analytics for Gap, Provence-Alpes-Côte d'Azur, France to uncover income potential. This 2025 STR market report for Gap, based on AirROI data from April 2024 to March 2025, reveals key trends in the market of 328 active listings.
Whether you're considering an Airbnb investment in Gap, optimizing your existing vacation rental, or exploring rental arbitrage opportunities, understanding the Gap Airbnb data is crucial. Leveraging the low regulation environment is key to maximizing your short term rental income potential. Let's dive into the specifics.
Key Gap Airbnb Performance Metrics Overview
Monthly Airbnb Revenue Variations & Income Potential in Gap (2025)
Understanding the monthly revenue variations for Airbnb listings in Gap is key to maximizing your short term rental income potential. Seasonality significantly impacts earnings. Our analysis, based on data from the past 12 months, shows that the peak revenue month for STRs in Gap is typically August, while March often presents the lowest earnings, highlighting opportunities for strategic pricing adjustments during shoulder and low seasons. Explore the typical Airbnb income in Gap across different performance tiers:
- Best-in-class properties (Top 10%) achieve $2,513+ monthly, often utilizing dynamic pricing and superior guest experiences.
- Strong performing properties (Top 25%) earn $1,608 or more, indicating effective management and desirable locations/amenities.
- Typical properties (Median) generate around $1,004 per month, representing the average market performance.
- Entry-level properties (Bottom 25%) see earnings around $536, often with potential for optimization.
Average Monthly Airbnb Earnings Trend in Gap
Gap Airbnb Occupancy Rate Trends (2025)
Maximize your bookings by understanding the Gap STR occupancy trends. Seasonal demand shifts significantly influence how often properties are booked. Typically, Augustsees the highest demand (peak season occupancy), while April experiences the lowest (low season). Effective strategies, like adjusting minimum stays or offering promotions, can boost occupancy during slower periods. Here's how different property tiers perform in Gap:
- Best-in-class properties (Top 10%) achieve 84%+ occupancy, indicating high desirability and potentially optimized availability.
- Strong performing properties (Top 25%) maintain 67% or higher occupancy, suggesting good market fit and guest satisfaction.
- Typical properties (Median) have an occupancy rate around 45%.
- Entry-level properties (Bottom 25%) average 22% occupancy, potentially facing higher vacancy.
Average Monthly Occupancy Rate Trend in Gap
Average Daily Rate (ADR) Airbnb Trends in Gap (2025)
Effective short term rental pricing strategy in Gap involves understanding monthly ADR fluctuations. The Average Daily Rate (ADR) for Airbnb in Gap typically peaks in January and dips lowest during September. Leveraging Airbnb dynamic pricing tools or strategies based on this seasonality can significantly boost revenue. Here's a look at the typical nightly rates achieved:
- Best-in-class properties (Top 10%) command rates of $148+ per night, often due to premium features or locations.
- Strong performing properties (Top 25%) achieve nightly rates of $100 or more.
- Typical properties (Median) charge around $69 per night.
- Entry-level properties (Bottom 25%) earn around $51 per night.
Average Daily Rate (ADR) Trend by Month in Gap
Get Live Gap Market Intelligence 👇

Explore Real-time Analytics
Airbnb Seasonality Analysis & Trends in Gap (2025)
Peak Season (August, July, May)
- Revenue averages $1,487 per month
- Occupancy rates average 52.6%
- Daily rates average $88
Shoulder Season
- Revenue averages $1,225 per month
- Occupancy maintains around 44.1%
- Daily rates hold near $88
Low Season (March, October, November)
- Revenue drops to average $954 per month
- Occupancy decreases to average 41.1%
- Daily rates adjust to average $86
Seasonality Insights for Gap
- The Airbnb seasonality in Gap shows moderate seasonality with distinct peak and low periods. While the sections above show seasonal averages, it's also insightful to look at the extremes:
- During the high season, the absolute peak month showcases Gap's highest earning potential, with monthly revenues capable of climbing to $1,662, occupancy reaching a high of 62.6%, and ADRs peaking at $94.
- Conversely, the slowest single month of the year, typically falling within the low season, marks the market's lowest point. In this month, revenue might dip to $869, occupancy could drop to 37.1%, and ADRs may adjust down to $85.
- Understanding both the seasonal averages and these monthly peaks and troughs in revenue, occupancy, and ADR is crucial for maximizing your Airbnb profit potential in Gap.
Seasonal Strategies for Maximizing Profit
- Peak Season: Maximize revenue through premium pricing and potentially longer minimum stays. Ensure high availability.
- Low Season: Offer competitive pricing, special promotions (e.g., extended stay discounts), and flexible cancellation policies. Target off-season travelers like remote workers or budget-conscious guests.
- Shoulder Seasons: Implement dynamic pricing that balances peak and low rates. Target weekend travelers or specific events. Offer slightly more flexible terms than peak season.
- Regularly analyze your own performance against these Gap seasonality benchmarks and adjust your pricing and availability strategy accordingly.
Best Areas for Airbnb Investment in Gap (2025)
Exploring the top neighborhoods for short-term rentals in Gap? This section highlights key areas, outlining why they are attractive for hosts and guests, along with notable local attractions. Consider these locations based on your target guest profile and investment strategy.
| Neighborhood / Area | Why Host Here? (Target Guests & Appeal) | Key Attractions & Landmarks |
|---|---|---|
| Gap City Center | The vibrant hub of Gap, featuring local shops, restaurants, and cultural attractions. It provides a perfect base for visitors looking to explore the region's natural beauty and historical sites. | Saint-Rémy Cathedral, Gap Museum, Centre Historique de Gap, Parc de la Pépinière, Château de Charance |
| Écrins National Park | A popular destination for outdoor enthusiasts, offering stunning mountain scenery, hiking, and winter sports. Attracts tourists looking for adventure and nature experiences. | Glacier Blanc, Lac des Poses, La Bérarde, Hiking Trails, Climbing Routes |
| Lake Serre-Ponçon | A picturesque lake surrounded by mountains, perfect for water sports, hiking, and cycling. Ideal for families and those seeking relaxation and outdoor activities. | Serre-Ponçon Lake, Gilles de La Tourette Point, Water sports activities, Beach areas, Biking paths |
| Champsaur Valley | Known for its beautiful landscapes and traditional villages, this area is great for visitors interested in hiking, skiing, and cultural experiences. | Champsaur Ski Resort, Village of St. Bonnet-en-Champsaur, Hiking Trails, Champsaur History Museum, Villard de Lans |
| Le Dévoluy | A ski and mountain biking region that draws visitors in both winter and summer. Offers great amenities and access to the slopes. | Superdévoluy Ski Resort, La Joue du Loup, Mountain Biking Trails, Hiking Paths, Local Restaurants |
| Orcieres-Merlette | A well-known ski resort with year-round activities, catering to tourists looking for both winter sports and summer hiking adventures. | Orcières 1850 Ski Resort, Parcours Aventure, Spa and Wellness, Hiking Trails, Local Festivals |
| Mont Guillaume | A stunning area for hiking and nature walks, attracting visitors keen on exploring remote and tranquil outdoor settings. | Mont Guillaume Peak, Hiking Routes, Scenic Viewpoints, Flora and Fauna Diversity |
| Villeneuve | A charming alpine village near Gap, offering a laid-back atmosphere with good access to skiing and outdoor pursuits, perfect for those seeking a peaceful getaway. | Villeneuve Ski Resort, Local Markets, Artisan Shops, Scenic Trails, Community Events |
Understanding Airbnb License Requirements & STR Laws in Gap (2025)
While Gap, Provence-Alpes-Côte d'Azur, France currently shows low STR regulations, specific Airbnb license requirements might still exist or change. Always verify the latest short term rental regulations and Airbnb license requirements directly with local government authorities for Gap to ensure full compliance before hosting.
(Source: AirROI data, 2025, based on 7% licensed listings)
Top Performing Airbnb Properties in Gap (2025)
Benchmark your potential! Explore examples of top-performing Airbnb properties in Gapbased on Trailing Twelve Month (TTM) revenue. Analyze their characteristics, revenue, occupancy rate, and ADR to understand what drives success in this market.
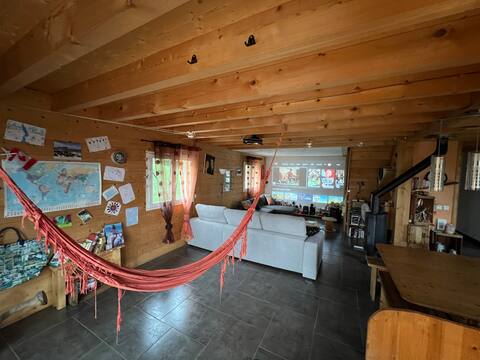
Maison en Bois à Gap
Entire Place • 4 bedrooms

Perched cabin with nature sauna
Entire Place • 1 bedroom
Cabanes du Dauphiné - Shed - Spa in option
Entire Place • 2 bedrooms

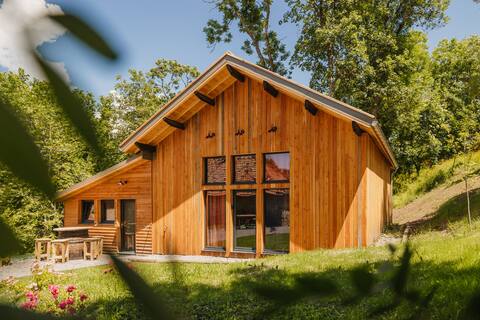
Belle Villa 5 min from Gap in a peacefull area
Entire Place • 4 bedrooms

Large T5 with terrace overlooking the mountains
Entire Place • 4 bedrooms
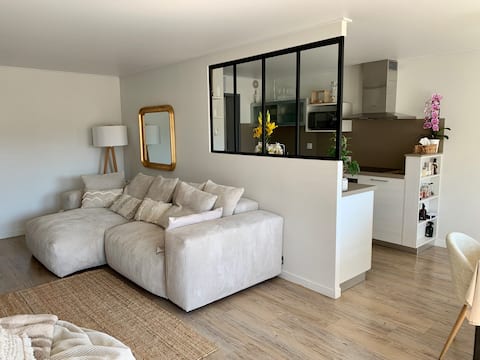
Cozy quiet apartment near CV
Entire Place • 2 bedrooms
Note: Performance varies based on location, size, amenities, seasonality, and management quality. Data reflects the past 12 months.
Top Performing Airbnb Hosts in Gap (2025)
Learn from the best! This table showcases top-performing Airbnb hosts in Gap based on the number of properties managed and estimated total revenue over the past year. Analyze their scale and performance metrics.
| Host Name | Properties | Grossing Revenue | Stay Reviews | Avg Rating |
|---|---|---|---|---|
| CleHA | 8 | $240,592 | 537 | 4.83/5.0 |
| Thomas | 9 | $233,751 | 375 | 4.79/5.0 |
| Les Gîtes | 5 | $84,947 | 412 | 4.67/5.0 |
| Julie | 6 | $82,480 | 279 | 4.62/5.0 |
| Marion | 8 | $54,877 | 9 | 1.17/5.0 |
| Fabrice | 1 | $54,014 | 170 | 4.95/5.0 |
| Celine | 1 | $53,608 | 78 | 4.97/5.0 |
| Line | 4 | $44,162 | 95 | 4.78/5.0 |
| Alexandre | 1 | $41,479 | 309 | 4.83/5.0 |
| Clémence | 1 | $38,935 | 19 | 5.00/5.0 |
Analyzing the strategies of top hosts, such as their property selection, pricing, and guest communication, can offer valuable lessons for optimizing your own Airbnb operations in Gap.
Dive Deeper: Advanced Gap STR Market Data (2025)
Ready to unlock more insights? AirROI provides access to advanced metrics and comprehensive Airbnb data for Gap. Explore detailed analytics beyond this report to refine your investment strategy, optimize pricing, and maximize your vacation rental profits.
Explore Advanced MetricsGap Short-Term Rental Market Composition (2025): Property & Room Types
Room Type Distribution
Property Type Distribution
Market Composition Insights for Gap
- The Gap Airbnb market composition is heavily skewed towards Entire Home/Apt listings, which make up 80.5% of the 328 active rentals. This indicates strong guest preference for privacy and space.
- Looking at the property type distribution in Gap, Apartment/Condo properties are the most common (56.4%), reflecting the local real estate landscape.
- Houses represent a significant 35.4% portion, catering likely to families or larger groups.
- Smaller segments like hotel/boutique, outdoor/unique, unique stays, others (combined 8.2%) offer potential for unique stay experiences.
Gap Airbnb Room Capacity Analysis (2025): Bedroom Distribution
Distribution of Listings by Number of Bedrooms
Room Capacity Insights for Gap
- The dominant room capacity in Gap is 1 bedroom listings, making up 41.8% of the market. This suggests a strong demand for properties suitable for couples or solo travelers.
- Together, 1 bedroom and 2 bedrooms properties represent 59.8% of the active Airbnb listings in Gap, indicating a high concentration in these sizes.
Gap Vacation Rental Guest Capacity Trends (2025)
Distribution of Listings by Guest Capacity
Guest Capacity Insights for Gap
- The most common guest capacity trend in Gap vacation rentals is listings accommodating 2 guests (32.3%). This suggests the primary traveler segment is likely couples or solo travelers.
- Properties designed for 2 guests and 4 guests dominate the Gap STR market, accounting for 59.1% of listings.
- 19.5% of properties accommodate 6+ guests, serving the market segment for larger families or group travel in Gap.
- On average, properties in Gap are equipped to host 3.3 guests.
Gap Airbnb Booking Patterns (2025): Available vs. Booked Days
Available Days Distribution
Booked Days Distribution
Booking Pattern Insights for Gap
- The most common availability pattern in Gap falls within the 271-366 days range, representing 40.2% of listings. This suggests many properties have significant open periods on their calendars.
- Approximately 71.3% of listings show high availability (181+ days open annually), indicating potential for increased bookings or specific owner usage patterns.
- For booked days, the 91-180 days range is most frequent in Gap (31.4%), reflecting common guest stay durations or potential owner blocking patterns.
- A notable 30.5% of properties secure long booking periods (181+ days booked per year), highlighting successful long-term rental strategies or significant owner usage.
Gap Airbnb Minimum Stay Requirements Analysis
Distribution of Listings by Minimum Night Requirement
1 Night
104 listings
33.9% of total
2 Nights
91 listings
29.6% of total
3 Nights
33 listings
10.7% of total
4-6 Nights
29 listings
9.4% of total
7-29 Nights
7 listings
2.3% of total
30+ Nights
43 listings
14% of total
Key Insights
- The most prevalent minimum stay requirement in Gap is 1 Night, adopted by 33.9% of listings. This highlights the market's preference for shorter, flexible bookings.
- A strong majority (63.5%) of the Gap Airbnb data shows acceptance of very short stays (1-2 nights), indicating a dynamic, high-turnover market.
- A significant segment (14%) caters to monthly stays (30+ nights) in Gap, pointing to opportunities in the extended-stay market.
Recommendations
- Align with the market by considering a 1 Night minimum stay, as 33.9% of Gap hosts use this setting.
- Explore offering discounts for stays of 30+ nights to attract the 14% of the market seeking extended stays.
- Adjust minimum nights based on seasonality – potentially shorter during low season and longer during peak demand periods in Gap.
Gap Airbnb Cancellation Policy Trends Analysis (2025)
Non-refundable
2 listings
0.7% of total
Refundable
1 listings
0.4% of total
Flexible
92 listings
32.9% of total
Moderate
99 listings
35.4% of total
Firm
40 listings
14.3% of total
Strict
46 listings
16.4% of total
Cancellation Policy Insights for Gap
- The prevailing Airbnb cancellation policy trend in Gap is Moderate, used by 35.4% of listings.
- There's a relatively balanced mix between guest-friendly (68.3%) and stricter (30.7%) policies, offering choices for different guest needs.
Recommendations for Hosts
- Consider adopting a Moderate policy to align with the 35.4% market standard in Gap.
- Regularly review your cancellation policy against competitors and market demand shifts in Gap.
Gap STR Booking Lead Time Analysis (2025)
Average Booking Lead Time by Month
Booking Lead Time Insights for Gap
- The overall average booking lead time for vacation rentals in Gap is 46 days.
- Guests book furthest in advance for stays during July (average 74 days), likely coinciding with peak travel demand or local events.
- The shortest booking windows occur for stays in October (average 31 days), indicating more last-minute travel plans during this time.
- Seasonally, Summer (63 days avg.) sees the longest lead times, while Fall (37 days avg.) has the shortest, reflecting typical travel planning cycles.
Recommendations for Hosts
- Use the overall average lead time (46 days) as a baseline for your pricing and availability strategy in Gap.
- For July stays, consider implementing length-of-stay discounts or slightly higher rates for bookings made less than 74 days out to capitalize on advance planning.
- Target marketing efforts for the Summer season well in advance (at least 63 days) to capture early planners.
- Monitor your own booking lead times against these Gap averages to identify opportunities for dynamic pricing adjustments.
Popular & Essential Airbnb Amenities in Gap (2025)
Amenity Prevalence
Amenity Insights for Gap
- Essential amenities in Gap that guests expect include: Heating. Lacking these (this) could significantly impact bookings.
- Popular amenities like Kitchen, Hot water, Smoke alarm are common but not universal. Offering these can provide a competitive edge.
- Warning: Wifi is not universally provided but is considered essential globally. Ensure reliable Wifi is offered.
Recommendations for Hosts
- Ensure your listing includes all essential amenities for Gap: Heating.
- Prioritize adding missing essentials: Heating.
- Consider adding popular differentiators like Kitchen or Hot water to increase appeal.
- Highlight unique or less common amenities you offer (e.g., hot tub, dedicated workspace, EV charger) in your listing description and photos.
- Regularly check competitor amenities in Gap to stay competitive.
Gap Airbnb Guest Demographics & Profile Analysis (2025)
Guest Profile Summary for Gap
- The typical guest profile for Airbnb in Gap consists of primarily domestic travelers (83%), often arriving from nearby Marseille, typically belonging to the Post-2000s (Gen Z/Alpha) group (50%), primarily speaking French or English.
- Domestic travelers account for 83.2% of guests.
- Key international markets include France (83.2%) and Italy (2.1%).
- Top languages spoken are French (42.1%) followed by English (32.5%).
- A significant demographic segment is the Post-2000s (Gen Z/Alpha) group, representing 50% of guests.
Recommendations for Hosts
- Target domestic marketing efforts towards travelers from Marseille and Paris.
- Tailor amenities and listing descriptions to appeal to the dominant Post-2000s (Gen Z/Alpha) demographic (e.g., highlight fast WiFi, smart home features, local guides).
- Highlight unique local experiences or amenities relevant to the primary guest profile.
- Consider seasonal promotions aligned with peak travel times for key origin markets.
Nearby Short-Term Rental Market Comparison
How does the Gap Airbnb market stack up against its neighbors? Compare key performance metrics like average monthly revenue, ADR, and occupancy rates in surrounding areas to understand the broader regional STR landscape.
| Market | Active Properties | Monthly Revenue | Daily Rate | Avg. Occupancy |
|---|---|---|---|---|
| Les Clefs | 30 | $5,741 | $323.11 | 44% |
| Monteu Roero | 16 | $4,432 | $540.14 | 36% |
| Manigod | 194 | $4,127 | $427.80 | 40% |
| Ramatuelle | 213 | $3,891 | $670.10 | 41% |
| Saint-Jean-Cap-Ferrat | 107 | $3,844 | $424.21 | 46% |
| Saint-Tropez | 742 | $3,498 | $506.57 | 41% |
| Saint-Nicolas-la-Chapelle | 27 | $3,381 | $375.70 | 43% |
| Charvonnex | 11 | $3,212 | $228.03 | 56% |
| Èze | 153 | $3,168 | $345.84 | 47% |
| Veyrier-du-Lac | 134 | $3,139 | $430.47 | 43% |