Falicon Airbnb Market Analysis 2025: Short Term Rental Data & Vacation Rental Statistics in Provence-Alpes-Côte d'Azur, France
Is Airbnb profitable in Falicon in 2025? Explore comprehensive Airbnb analytics for Falicon, Provence-Alpes-Côte d'Azur, France to uncover income potential. This 2025 STR market report for Falicon, based on AirROI data from April 2024 to March 2025, reveals key trends in the niche market of 18 active listings.
Whether you're considering an Airbnb investment in Falicon, optimizing your existing vacation rental, or exploring rental arbitrage opportunities, understanding the Falicon Airbnb data is crucial. Understanding the local regulations is key to maximizing your short term rental income potential. Let's dive into the specifics.
Key Falicon Airbnb Performance Metrics Overview
Monthly Airbnb Revenue Variations & Income Potential in Falicon (2025)
Understanding the monthly revenue variations for Airbnb listings in Falicon is key to maximizing your short term rental income potential. Seasonality significantly impacts earnings. Our analysis, based on data from the past 12 months, shows that the peak revenue month for STRs in Falicon is typically July, while November often presents the lowest earnings, highlighting opportunities for strategic pricing adjustments during shoulder and low seasons. Explore the typical Airbnb income in Falicon across different performance tiers:
- Best-in-class properties (Top 10%) achieve $7,422+ monthly, often utilizing dynamic pricing and superior guest experiences.
- Strong performing properties (Top 25%) earn $4,302 or more, indicating effective management and desirable locations/amenities.
- Typical properties (Median) generate around $1,637 per month, representing the average market performance.
- Entry-level properties (Bottom 25%) see earnings around $960, often with potential for optimization.
Average Monthly Airbnb Earnings Trend in Falicon
Falicon Airbnb Occupancy Rate Trends (2025)
Maximize your bookings by understanding the Falicon STR occupancy trends. Seasonal demand shifts significantly influence how often properties are booked. Typically, Julysees the highest demand (peak season occupancy), while November experiences the lowest (low season). Effective strategies, like adjusting minimum stays or offering promotions, can boost occupancy during slower periods. Here's how different property tiers perform in Falicon:
- Best-in-class properties (Top 10%) achieve 44%+ occupancy, indicating high desirability and potentially optimized availability.
- Strong performing properties (Top 25%) maintain 34% or higher occupancy, suggesting good market fit and guest satisfaction.
- Typical properties (Median) have an occupancy rate around 20%.
- Entry-level properties (Bottom 25%) average 14% occupancy, potentially facing higher vacancy.
Average Monthly Occupancy Rate Trend in Falicon
Average Daily Rate (ADR) Airbnb Trends in Falicon (2025)
Effective short term rental pricing strategy in Falicon involves understanding monthly ADR fluctuations. The Average Daily Rate (ADR) for Airbnb in Falicon typically peaks in February and dips lowest during April. Leveraging Airbnb dynamic pricing tools or strategies based on this seasonality can significantly boost revenue. Here's a look at the typical nightly rates achieved:
- Best-in-class properties (Top 10%) command rates of $673+ per night, often due to premium features or locations.
- Strong performing properties (Top 25%) achieve nightly rates of $354 or more.
- Typical properties (Median) charge around $168 per night.
- Entry-level properties (Bottom 25%) earn around $108 per night.
Average Daily Rate (ADR) Trend by Month in Falicon
Get Live Falicon Market Intelligence 👇
Explore Real-time Analytics
Airbnb Seasonality Analysis & Trends in Falicon (2025)
Peak Season (July, May, August)
- Revenue averages $5,896 per month
- Occupancy rates average 46.6%
- Daily rates average $277
Shoulder Season
- Revenue averages $2,823 per month
- Occupancy maintains around 21.2%
- Daily rates hold near $296
Low Season (January, March, November)
- Revenue drops to average $682 per month
- Occupancy decreases to average 9.8%
- Daily rates adjust to average $339
Seasonality Insights for Falicon
- The Airbnb seasonality in Falicon shows highly seasonal trends requiring careful strategy. While the sections above show seasonal averages, it's also insightful to look at the extremes:
- During the high season, the absolute peak month showcases Falicon's highest earning potential, with monthly revenues capable of climbing to $7,543, occupancy reaching a high of 59.3%, and ADRs peaking at $343.
- Conversely, the slowest single month of the year, typically falling within the low season, marks the market's lowest point. In this month, revenue might dip to $415, occupancy could drop to 4.4%, and ADRs may adjust down to $270.
- Understanding both the seasonal averages and these monthly peaks and troughs in revenue, occupancy, and ADR is crucial for maximizing your Airbnb profit potential in Falicon.
Seasonal Strategies for Maximizing Profit
- Peak Season: Maximize revenue through premium pricing and potentially longer minimum stays. Ensure high availability.
- Low Season: Offer competitive pricing, special promotions (e.g., extended stay discounts), and flexible cancellation policies. Target off-season travelers like remote workers or budget-conscious guests.
- Shoulder Seasons: Implement dynamic pricing that balances peak and low rates. Target weekend travelers or specific events. Offer slightly more flexible terms than peak season.
- Regularly analyze your own performance against these Falicon seasonality benchmarks and adjust your pricing and availability strategy accordingly.
Best Areas for Airbnb Investment in Falicon (2025)
Exploring the top neighborhoods for short-term rentals in Falicon? This section highlights key areas, outlining why they are attractive for hosts and guests, along with notable local attractions. Consider these locations based on your target guest profile and investment strategy.
| Neighborhood / Area | Why Host Here? (Target Guests & Appeal) | Key Attractions & Landmarks |
|---|---|---|
| Falicon Village | Charming Provençal village with narrow streets and scenic views. A peaceful escape close to Nice and the French Riviera, popular among tourists looking for a tranquil experience. | St. Peter's Church, Falicon Hill, The Mediterranean views, Local Provençal markets |
| Nice Promenade des Anglais | Famous waterfront avenue in Nice with beautiful beaches and stunning views. A top destination for tourists seeking sun, sand, and vibrant city life. | Promenade des Anglais, Nice Old Town, Castle Hill, Nice Carnival, Flower Market |
| Colline du Château | Historic hill offering stunning panoramic views of Nice and the coastline. A picturesque spot that attracts both tourists and nature lovers. | Castle ruins, Park and gardens, Views of the Baie des Anges |
| Vieux Nice (Old Town) | The historic heart of Nice filled with narrow streets, colorful buildings, and local shops. A vibrant area full of culture and authentic Provençal atmosphere. | Cours Saleya Market, Nice Cathedral, Palais Lascaris, Local restaurants and cafes |
| Mont Boron | Residential neighborhood with beautiful villas and parks, known for its scenic coastal views and proximity to the city center. Attractive to visitors wanting a quieter stay near Nice. | Mont Boron Park, Nice Port, Views of Villefranche-sur-Mer |
| Cimiez | Upscale neighborhood known for its beautiful architecture, historical sites, and museums. Popular with those interested in culture and history while enjoying the amenities of Nice. | Roman Ruins, Matisse Museum, Cimiez Monastery, Gardens |
| Villefranche-sur-Mer | Charming coastal town just a short drive from Nice, known for its picturesque harbor and vibrant Mediterranean atmosphere. A favorite for tourists looking for a seaside escape. | Villefranche Beach, Old Town, Saint Peter Chapel, Chapelle de Saint-Elme |
| Eze Village | A medieval village perched high above the sea, offering stunning views and a unique historical ambiance. Attracts tourists looking for a memorable experience near the French Riviera. | Eze Botanical Garden, Château de la Chèvre d'Or, Fragonard Perfume Factory, Narrow cobblestone streets |
Understanding Airbnb License Requirements & STR Laws in Falicon (2025)
With 17% of listings showing registration in 2025, understanding potential Airbnb license requirements is crucial in Falicon. Always verify the latest short term rental regulations and Airbnb license requirements directly with local government authorities for Falicon to ensure full compliance before hosting.
(Source: AirROI data, 2025, based on 17% licensed listings)
Top Performing Airbnb Properties in Falicon (2025)
Benchmark your potential! Explore examples of top-performing Airbnb properties in Faliconbased on Trailing Twelve Month (TTM) revenue. Analyze their characteristics, revenue, occupancy rate, and ADR to understand what drives success in this market.
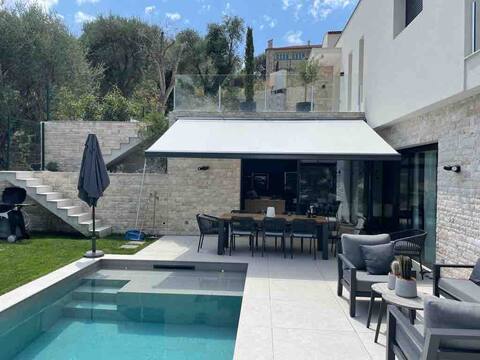
9 pcs villa classified 4* with swimming pool 10' from Nice
Entire Place • 7 bedrooms
3* villa top accommodation with private pool
Entire Place • 4 bedrooms

Architect villa sea view 15min from Nice
Entire Place • 4 bedrooms
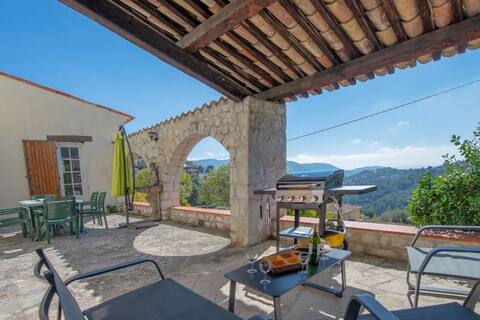
Villa Falicon Sea View/Pool, A/C and BBQ
Entire Place • 3 bedrooms
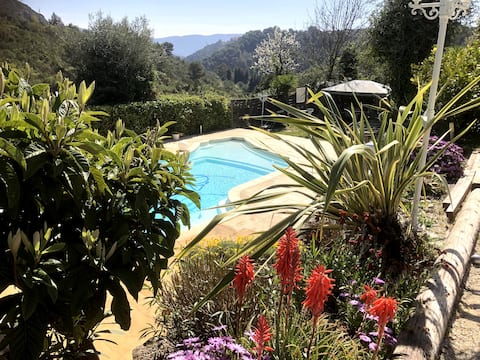
Stunning villa for an unforgettable holiday
Entire Place • 4 bedrooms
La Bergerie Sea View and Pool - Close to Nice
Entire Place • 1 bedroom
Note: Performance varies based on location, size, amenities, seasonality, and management quality. Data reflects the past 12 months.
Top Performing Airbnb Hosts in Falicon (2025)
Learn from the best! This table showcases top-performing Airbnb hosts in Falicon based on the number of properties managed and estimated total revenue over the past year. Analyze their scale and performance metrics.
| Host Name | Properties | Grossing Revenue | Stay Reviews | Avg Rating |
|---|---|---|---|---|
| Aurélia Et Stéphane | 1 | $96,368 | 12 | 4.92/5.0 |
| Charles | 1 | $58,563 | 123 | 4.92/5.0 |
| Sylvie | 1 | $54,483 | 9 | 4.67/5.0 |
| Magali | 1 | $32,348 | 3 | 5.00/5.0 |
| Régis | 1 | $19,577 | 3 | 5.00/5.0 |
| Christine | 3 | $16,649 | 18 | 4.71/5.0 |
| Héléna | 1 | $13,943 | 17 | 4.53/5.0 |
| Host #14573623 | 1 | $12,142 | 0 | 0.00/5.0 |
| Melanie | 1 | $10,613 | 6 | 4.17/5.0 |
| Véronique | 1 | $9,363 | 7 | 4.43/5.0 |
Analyzing the strategies of top hosts, such as their property selection, pricing, and guest communication, can offer valuable lessons for optimizing your own Airbnb operations in Falicon.
Dive Deeper: Advanced Falicon STR Market Data (2025)
Ready to unlock more insights? AirROI provides access to advanced metrics and comprehensive Airbnb data for Falicon. Explore detailed analytics beyond this report to refine your investment strategy, optimize pricing, and maximize your vacation rental profits.
Explore Advanced MetricsFalicon Short-Term Rental Market Composition (2025): Property & Room Types
Room Type Distribution
Property Type Distribution
Market Composition Insights for Falicon
- The Falicon Airbnb market composition is heavily skewed towards Entire Home/Apt listings, which make up 94.4% of the 18 active rentals. This indicates strong guest preference for privacy and space.
- Looking at the property type distribution in Falicon, House properties are the most common (72.2%), reflecting the local real estate landscape.
- Houses represent a significant 72.2% portion, catering likely to families or larger groups.
- The presence of 5.6% Hotel/Boutique listings indicates integration with traditional hospitality.
Falicon Airbnb Room Capacity Analysis (2025): Bedroom Distribution
Distribution of Listings by Number of Bedrooms
Room Capacity Insights for Falicon
- The dominant room capacity in Falicon is 1 bedroom listings, making up 33.3% of the market. This suggests a strong demand for properties suitable for couples or solo travelers.
- Together, 1 bedroom and 3 bedrooms properties represent 55.5% of the active Airbnb listings in Falicon, indicating a high concentration in these sizes.
- A significant 50.0% of listings offer 3+ bedrooms, catering to larger groups and families seeking more space in Falicon.
Falicon Vacation Rental Guest Capacity Trends (2025)
Distribution of Listings by Guest Capacity
Guest Capacity Insights for Falicon
- The most common guest capacity trend in Falicon vacation rentals is listings accommodating 6 guests (33.3%). This suggests the primary traveler segment is likely larger groups.
- Properties designed for 6 guests and 4 guests dominate the Falicon STR market, accounting for 61.1% of listings.
- 50.0% of properties accommodate 6+ guests, serving the market segment for larger families or group travel in Falicon.
- On average, properties in Falicon are equipped to host 5.1 guests.
Falicon Airbnb Booking Patterns (2025): Available vs. Booked Days
Available Days Distribution
Booked Days Distribution
Booking Pattern Insights for Falicon
- The most common availability pattern in Falicon falls within the 271-366 days range, representing 83.3% of listings. This suggests many properties have significant open periods on their calendars.
- Approximately 100.0% of listings show high availability (181+ days open annually), indicating potential for increased bookings or specific owner usage patterns.
- For booked days, the 1-30 days range is most frequent in Falicon (50%), reflecting common guest stay durations or potential owner blocking patterns.
Falicon Airbnb Minimum Stay Requirements Analysis
Distribution of Listings by Minimum Night Requirement
1 Night
3 listings
16.7% of total
2 Nights
6 listings
33.3% of total
3 Nights
2 listings
11.1% of total
4-6 Nights
5 listings
27.8% of total
7-29 Nights
2 listings
11.1% of total
Key Insights
- The most prevalent minimum stay requirement in Falicon is 2 Nights, adopted by 33.3% of listings. This highlights the market's preference for shorter, flexible bookings.
Recommendations
- Align with the market by considering a 2 Nights minimum stay, as 33.3% of Falicon hosts use this setting.
- If feasible, allowing 1-night stays, especially midweek or during low season, could capture last-minute bookings, as only 16.7% currently do.
- A 2-night minimum appears standard (33.3%). Consider this for weekends or peak periods.
- Adjust minimum nights based on seasonality – potentially shorter during low season and longer during peak demand periods in Falicon.
Falicon Airbnb Cancellation Policy Trends Analysis (2025)
Flexible
3 listings
18.8% of total
Moderate
7 listings
43.8% of total
Firm
2 listings
12.5% of total
Strict
4 listings
25% of total
Cancellation Policy Insights for Falicon
- The prevailing Airbnb cancellation policy trend in Falicon is Moderate, used by 43.8% of listings.
- There's a relatively balanced mix between guest-friendly (62.6%) and stricter (37.5%) policies, offering choices for different guest needs.
Recommendations for Hosts
- Consider adopting a Moderate policy to align with the 43.8% market standard in Falicon.
- Regularly review your cancellation policy against competitors and market demand shifts in Falicon.
Falicon STR Booking Lead Time Analysis (2025)
Average Booking Lead Time by Month
Booking Lead Time Insights for Falicon
- The overall average booking lead time for vacation rentals in Falicon is 55 days.
- Guests book furthest in advance for stays during April (average 94 days), likely coinciding with peak travel demand or local events.
- The shortest booking windows occur for stays in December (average 10 days), indicating more last-minute travel plans during this time.
- Seasonally, Fall (77 days avg.) sees the longest lead times, while Winter (29 days avg.) has the shortest, reflecting typical travel planning cycles.
Recommendations for Hosts
- Use the overall average lead time (55 days) as a baseline for your pricing and availability strategy in Falicon.
- For April stays, consider implementing length-of-stay discounts or slightly higher rates for bookings made less than 94 days out to capitalize on advance planning.
- During December, focus on last-minute booking availability and promotions, as guests book with very short notice (10 days avg.).
- Target marketing efforts for the Fall season well in advance (at least 77 days) to capture early planners.
- Monitor your own booking lead times against these Falicon averages to identify opportunities for dynamic pricing adjustments.
Popular & Essential Airbnb Amenities in Falicon (2025)
Amenity Prevalence
Amenity Insights for Falicon
- Essential amenities in Falicon that guests expect include: Wifi. Lacking these (this) could significantly impact bookings.
- Popular amenities like Kitchen, Heating, TV are common but not universal. Offering these can provide a competitive edge.
Recommendations for Hosts
- Ensure your listing includes all essential amenities for Falicon: Wifi.
- Consider adding popular differentiators like Kitchen or Heating to increase appeal.
- Highlight unique or less common amenities you offer (e.g., hot tub, dedicated workspace, EV charger) in your listing description and photos.
- Regularly check competitor amenities in Falicon to stay competitive.
Falicon Airbnb Guest Demographics & Profile Analysis (2025)
Guest Profile Summary for Falicon
- The typical guest profile for Airbnb in Falicon consists of predominantly international visitors (66%), with top international origins including Germany, typically belonging to the Post-2000s (Gen Z/Alpha) group (50%), primarily speaking English or French.
- Domestic travelers account for 34.0% of guests.
- Key international markets include France (34%) and Germany (10%).
- Top languages spoken are English (35.7%) followed by French (24.3%).
- A significant demographic segment is the Post-2000s (Gen Z/Alpha) group, representing 50% of guests.
Recommendations for Hosts
- Focus marketing internationally, particularly towards travelers from Germany.
- Tailor amenities and listing descriptions to appeal to the dominant Post-2000s (Gen Z/Alpha) demographic (e.g., highlight fast WiFi, smart home features, local guides).
- Highlight unique local experiences or amenities relevant to the primary guest profile.
- Consider seasonal promotions aligned with peak travel times for key origin markets.
Nearby Short-Term Rental Market Comparison
How does the Falicon Airbnb market stack up against its neighbors? Compare key performance metrics like average monthly revenue, ADR, and occupancy rates in surrounding areas to understand the broader regional STR landscape.
| Market | Active Properties | Monthly Revenue | Daily Rate | Avg. Occupancy |
|---|---|---|---|---|
| Monteu Roero | 16 | $4,432 | $540.14 | 36% |
| Ramatuelle | 213 | $3,891 | $670.10 | 41% |
| Saint-Jean-Cap-Ferrat | 107 | $3,844 | $424.21 | 46% |
| Cossano Belbo | 13 | $3,632 | $284.21 | 42% |
| Saint-Tropez | 742 | $3,498 | $506.57 | 41% |
| Cassinasco | 18 | $3,219 | $545.40 | 41% |
| Èze | 153 | $3,168 | $345.84 | 47% |
| Opio | 40 | $3,057 | $540.62 | 37% |
| Villefranche-sur-Mer | 501 | $2,977 | $268.57 | 52% |
| Gassin | 384 | $2,939 | $434.44 | 40% |