Buissard Airbnb Market Analysis 2025: Short Term Rental Data & Vacation Rental Statistics in Provence-Alpes-Côte d'Azur, France
Is Airbnb profitable in Buissard in 2025? Explore comprehensive Airbnb analytics for Buissard, Provence-Alpes-Côte d'Azur, France to uncover income potential. This 2025 STR market report for Buissard, based on AirROI data from April 2024 to March 2025, reveals key trends in the niche market of 17 active listings.
Whether you're considering an Airbnb investment in Buissard, optimizing your existing vacation rental, or exploring rental arbitrage opportunities, understanding the Buissard Airbnb data is crucial. Leveraging the low regulation environment is key to maximizing your short term rental income potential. Let's dive into the specifics.
Key Buissard Airbnb Performance Metrics Overview
Monthly Airbnb Revenue Variations & Income Potential in Buissard (2025)
Understanding the monthly revenue variations for Airbnb listings in Buissard is key to maximizing your short term rental income potential. Seasonality significantly impacts earnings. Our analysis, based on data from the past 12 months, shows that the peak revenue month for STRs in Buissard is typically February, while April often presents the lowest earnings, highlighting opportunities for strategic pricing adjustments during shoulder and low seasons. Explore the typical Airbnb income in Buissard across different performance tiers:
- Best-in-class properties (Top 10%) achieve $1,741+ monthly, often utilizing dynamic pricing and superior guest experiences.
- Strong performing properties (Top 25%) earn $875 or more, indicating effective management and desirable locations/amenities.
- Typical properties (Median) generate around $435 per month, representing the average market performance.
- Entry-level properties (Bottom 25%) see earnings around $164, often with potential for optimization.
Average Monthly Airbnb Earnings Trend in Buissard
Buissard Airbnb Occupancy Rate Trends (2025)
Maximize your bookings by understanding the Buissard STR occupancy trends. Seasonal demand shifts significantly influence how often properties are booked. Typically, Augustsees the highest demand (peak season occupancy), while April experiences the lowest (low season). Effective strategies, like adjusting minimum stays or offering promotions, can boost occupancy during slower periods. Here's how different property tiers perform in Buissard:
- Best-in-class properties (Top 10%) achieve 59%+ occupancy, indicating high desirability and potentially optimized availability.
- Strong performing properties (Top 25%) maintain 40% or higher occupancy, suggesting good market fit and guest satisfaction.
- Typical properties (Median) have an occupancy rate around 26%.
- Entry-level properties (Bottom 25%) average 15% occupancy, potentially facing higher vacancy.
Average Monthly Occupancy Rate Trend in Buissard
Average Daily Rate (ADR) Airbnb Trends in Buissard (2025)
Effective short term rental pricing strategy in Buissard involves understanding monthly ADR fluctuations. The Average Daily Rate (ADR) for Airbnb in Buissard typically peaks in December and dips lowest during November. Leveraging Airbnb dynamic pricing tools or strategies based on this seasonality can significantly boost revenue. Here's a look at the typical nightly rates achieved:
- Best-in-class properties (Top 10%) command rates of $107+ per night, often due to premium features or locations.
- Strong performing properties (Top 25%) achieve nightly rates of $83 or more.
- Typical properties (Median) charge around $51 per night.
- Entry-level properties (Bottom 25%) earn around $31 per night.
Average Daily Rate (ADR) Trend by Month in Buissard
Get Live Buissard Market Intelligence 👇

Explore Real-time Analytics
Airbnb Seasonality Analysis & Trends in Buissard (2025)
Peak Season (February, March, August)
- Revenue averages $1,321 per month
- Occupancy rates average 44.6%
- Daily rates average $67
Shoulder Season
- Revenue averages $786 per month
- Occupancy maintains around 30.8%
- Daily rates hold near $64
Low Season (April, October, November)
- Revenue drops to average $390 per month
- Occupancy decreases to average 18.8%
- Daily rates adjust to average $58
Seasonality Insights for Buissard
- The Airbnb seasonality in Buissard shows highly seasonal trends requiring careful strategy. While the sections above show seasonal averages, it's also insightful to look at the extremes:
- During the high season, the absolute peak month showcases Buissard's highest earning potential, with monthly revenues capable of climbing to $1,652, occupancy reaching a high of 55.2%, and ADRs peaking at $71.
- Conversely, the slowest single month of the year, typically falling within the low season, marks the market's lowest point. In this month, revenue might dip to $345, occupancy could drop to 15.0%, and ADRs may adjust down to $53.
- Understanding both the seasonal averages and these monthly peaks and troughs in revenue, occupancy, and ADR is crucial for maximizing your Airbnb profit potential in Buissard.
Seasonal Strategies for Maximizing Profit
- Peak Season: Maximize revenue through premium pricing and potentially longer minimum stays. Ensure high availability.
- Low Season: Offer competitive pricing, special promotions (e.g., extended stay discounts), and flexible cancellation policies. Target off-season travelers like remote workers or budget-conscious guests.
- Shoulder Seasons: Implement dynamic pricing that balances peak and low rates. Target weekend travelers or specific events. Offer slightly more flexible terms than peak season.
- Regularly analyze your own performance against these Buissard seasonality benchmarks and adjust your pricing and availability strategy accordingly.
Best Areas for Airbnb Investment in Buissard (2025)
Exploring the top neighborhoods for short-term rentals in Buissard? This section highlights key areas, outlining why they are attractive for hosts and guests, along with notable local attractions. Consider these locations based on your target guest profile and investment strategy.
| Neighborhood / Area | Why Host Here? (Target Guests & Appeal) | Key Attractions & Landmarks |
|---|---|---|
| Gordes | A picturesque hilltop village known for its stunning stone architecture and beautiful landscapes, Gordes attracts visitors seeking charm and tranquility in the heart of Provence. | Abbaye de Senanque, Château de Gordes, Village de Gordes, Lavender fields, Local markets |
| Roussillon | Famous for its vibrant ochre cliffs and beautiful scenery, Roussillon draws art lovers and nature enthusiasts, making it a popular choice for Airbnb hosts. | Ochre Trail, Roussillon village, Art galleries, Local artisans shops, Pension des Ocres |
| Apt | As a popular Provençal town, Apt is known for its rich history and proximity to the Luberon mountains. It’s a great base for exploring the surrounding countryside. | Apt market, Cathedral of Saint Anne, Museum of Apt, Luberon Natural Park, Lavender fields |
| L'Isle-sur-la-Sorgue | Often referred to as the 'Venice of Provence', this town is famous for its canals and antique markets, making it a prime destination for tourists. | Antique shops, Canal walks, Sorgue river, Brocante markets, Provençal restaurants |
| Saint-Rémy-de-Provence | Known for its artistic history and Roman ruins, this charming town attracts tourists looking to experience the culture and beauty of Provence. | Saint Paul de Mausole, Alpilles mountains, Van Gogh's sites, Local wineries, Provencal markets |
| Avignon | A historic city famous for the Palais des Papes and its annual theater festival, Avignon is a hotspot for both culture enthusiasts and tourists. | Palais des Papes, Pont Saint-Bénézet, Avignon Festival, Avignon Cathedral, Rooftop views |
| Cavaillon | A small town with a rich history and beautiful surroundings, Cavaillon is known for its melons and offers a quieter alternative to larger tourist spots. | Cavaillon synagogue, Saint Jacques Chapel, Apt-Cavaillon canal, Food markets, Green spaces |
| Mérindol | A hidden gem in the region, this village is known for its stunning views and proximity to nature, ideal for visitors seeking peace and quiet. | Views of the Luberon, Village church, Nearby hiking trails, Local vineyards, Charming streets |
Understanding Airbnb License Requirements & STR Laws in Buissard (2025)
While Buissard, Provence-Alpes-Côte d'Azur, France currently shows low STR regulations, specific Airbnb license requirements might still exist or change. Always verify the latest short term rental regulations and Airbnb license requirements directly with local government authorities for Buissard to ensure full compliance before hosting.
(Source: AirROI data, 2025, finding no licensed listings among those analyzed)
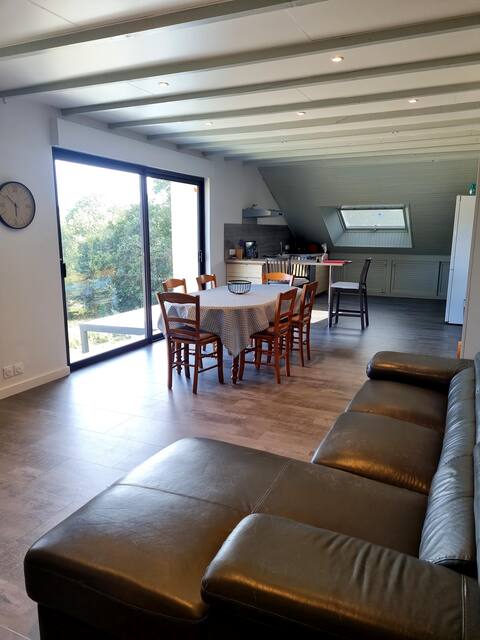
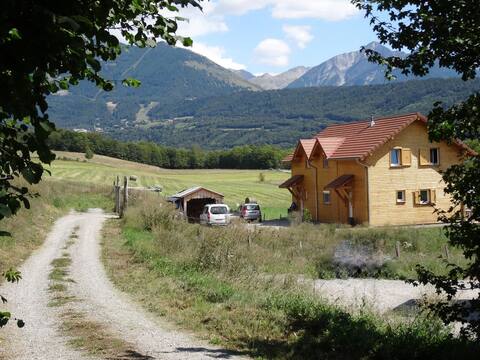
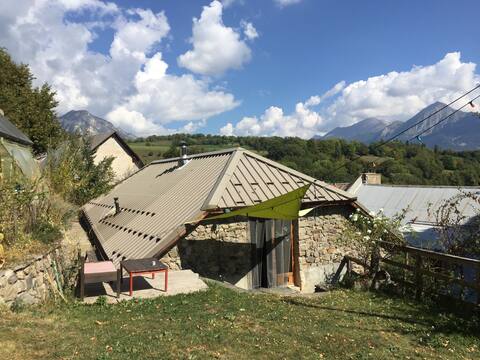
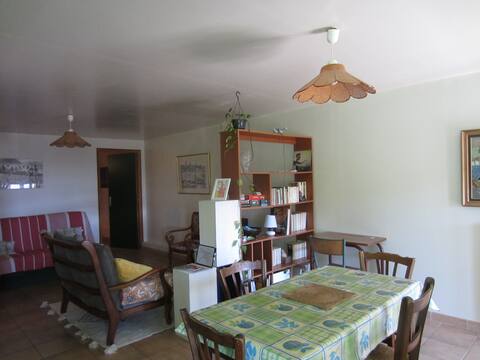
Top Performing Airbnb Properties in Buissard (2025)
Benchmark your potential! Explore examples of top-performing Airbnb properties in Buissardbased on Trailing Twelve Month (TTM) revenue. Analyze their characteristics, revenue, occupancy rate, and ADR to understand what drives success in this market.
Gîte de l 'Auche, at the farm 6 to 8 people
Entire Place • 5 bedrooms

cottage le panache au chalet les squiruils
Entire Place • 1 bedroom
Gîte Les Chalvettes -Champsaur
Entire Place • 2 bedrooms
Authentic and quiet mountain accommodation
Entire Place • 3 bedrooms

Studio 2 to 4 people
Entire Place • 1 bedroom
Grand appart à la montagne
Entire Place • 1 bedroom
Note: Performance varies based on location, size, amenities, seasonality, and management quality. Data reflects the past 12 months.
Top Performing Airbnb Hosts in Buissard (2025)
Learn from the best! This table showcases top-performing Airbnb hosts in Buissard based on the number of properties managed and estimated total revenue over the past year. Analyze their scale and performance metrics.
| Host Name | Properties | Grossing Revenue | Stay Reviews | Avg Rating |
|---|---|---|---|---|
| Marie-Chloé | 1 | $20,064 | 125 | 4.94/5.0 |
| Janine | 2 | $12,155 | 73 | 4.79/5.0 |
| Christine | 1 | $10,495 | 99 | 4.90/5.0 |
| Christel | 1 | $9,464 | 27 | 4.89/5.0 |
| Romain | 1 | $9,125 | 214 | 4.90/5.0 |
| Bernadette | 3 | $9,090 | 295 | 4.68/5.0 |
| Patrick | 6 | $7,709 | 425 | 3.93/5.0 |
| Host #57218077 | 1 | $5,251 | 1 | 0.00/5.0 |
| Emilie | 1 | $795 | 5 | 4.60/5.0 |
Analyzing the strategies of top hosts, such as their property selection, pricing, and guest communication, can offer valuable lessons for optimizing your own Airbnb operations in Buissard.
Dive Deeper: Advanced Buissard STR Market Data (2025)
Ready to unlock more insights? AirROI provides access to advanced metrics and comprehensive Airbnb data for Buissard. Explore detailed analytics beyond this report to refine your investment strategy, optimize pricing, and maximize your vacation rental profits.
Explore Advanced MetricsBuissard Short-Term Rental Market Composition (2025): Property & Room Types
Room Type Distribution
Property Type Distribution
Market Composition Insights for Buissard
- The Buissard Airbnb market composition is heavily skewed towards Entire Home/Apt listings, which make up 58.8% of the 17 active rentals. This indicates strong guest preference for privacy and space.
- However, a notable 35.3% share for Private Rooms suggests opportunities for budget-conscious travelers or hosts renting out spare rooms.
- Looking at the property type distribution in Buissard, Apartment/Condo properties are the most common (47.1%), reflecting the local real estate landscape.
- Houses represent a significant 29.4% portion, catering likely to families or larger groups.
Buissard Airbnb Room Capacity Analysis (2025): Bedroom Distribution
Distribution of Listings by Number of Bedrooms
Room Capacity Insights for Buissard
- The dominant room capacity in Buissard is 1 bedroom listings, making up 52.9% of the market. This suggests a strong demand for properties suitable for couples or solo travelers.
- Together, 1 bedroom and 2 bedrooms properties represent 64.7% of the active Airbnb listings in Buissard, indicating a high concentration in these sizes.
- With over half the market (52.9%) consisting of studios or 1-bedroom units, Buissard is particularly well-suited for individuals or couples.
Buissard Vacation Rental Guest Capacity Trends (2025)
Distribution of Listings by Guest Capacity
Guest Capacity Insights for Buissard
- The most common guest capacity trend in Buissard vacation rentals is listings accommodating 5 guests (29.4%). This suggests the primary traveler segment is likely larger groups.
- Properties designed for 5 guests and 4 guests dominate the Buissard STR market, accounting for 52.9% of listings.
- 17.7% of properties accommodate 6+ guests, serving the market segment for larger families or group travel in Buissard.
- On average, properties in Buissard are equipped to host 3.7 guests.
Buissard Airbnb Booking Patterns (2025): Available vs. Booked Days
Available Days Distribution
Booked Days Distribution
Booking Pattern Insights for Buissard
- The most common availability pattern in Buissard falls within the 271-366 days range, representing 70.6% of listings. This suggests many properties have significant open periods on their calendars.
- Approximately 100.0% of listings show high availability (181+ days open annually), indicating potential for increased bookings or specific owner usage patterns.
- For booked days, the 31-90 days range is most frequent in Buissard (35.3%), reflecting common guest stay durations or potential owner blocking patterns.
Buissard Airbnb Minimum Stay Requirements Analysis
Distribution of Listings by Minimum Night Requirement
1 Night
5 listings
38.5% of total
2 Nights
3 listings
23.1% of total
3 Nights
1 listings
7.7% of total
4-6 Nights
1 listings
7.7% of total
30+ Nights
3 listings
23.1% of total
Key Insights
- The most prevalent minimum stay requirement in Buissard is 1 Night, adopted by 38.5% of listings. This highlights the market's preference for shorter, flexible bookings.
- A strong majority (61.6%) of the Buissard Airbnb data shows acceptance of very short stays (1-2 nights), indicating a dynamic, high-turnover market.
- A significant segment (23.1%) caters to monthly stays (30+ nights) in Buissard, pointing to opportunities in the extended-stay market.
Recommendations
- Align with the market by considering a 1 Night minimum stay, as 38.5% of Buissard hosts use this setting.
- Explore offering discounts for stays of 30+ nights to attract the 23.1% of the market seeking extended stays.
- Adjust minimum nights based on seasonality – potentially shorter during low season and longer during peak demand periods in Buissard.
Buissard Airbnb Cancellation Policy Trends Analysis (2025)
Flexible
5 listings
35.7% of total
Moderate
5 listings
35.7% of total
Firm
2 listings
14.3% of total
Strict
2 listings
14.3% of total
Cancellation Policy Insights for Buissard
- The prevailing Airbnb cancellation policy trend in Buissard is Flexible, used by 35.7% of listings.
- The market strongly favors guest-friendly terms, with 71.4% of listings offering Flexible or Moderate policies. This suggests guests in Buissard may expect booking flexibility.
Recommendations for Hosts
- Consider adopting a Flexible policy to align with the 35.7% market standard in Buissard.
- Using a Strict policy might deter some guests, as only 14.3% of listings use it. Evaluate if potential revenue protection outweighs possible lower booking rates.
- Regularly review your cancellation policy against competitors and market demand shifts in Buissard.
Buissard STR Booking Lead Time Analysis (2025)
Average Booking Lead Time by Month
Booking Lead Time Insights for Buissard
- The overall average booking lead time for vacation rentals in Buissard is 40 days.
- Guests book furthest in advance for stays during June (average 97 days), likely coinciding with peak travel demand or local events.
- The shortest booking windows occur for stays in November (average 6 days), indicating more last-minute travel plans during this time.
- Seasonally, Summer (79 days avg.) sees the longest lead times, while Fall (19 days avg.) has the shortest, reflecting typical travel planning cycles.
Recommendations for Hosts
- Use the overall average lead time (40 days) as a baseline for your pricing and availability strategy in Buissard.
- For June stays, consider implementing length-of-stay discounts or slightly higher rates for bookings made less than 97 days out to capitalize on advance planning.
- During November, focus on last-minute booking availability and promotions, as guests book with very short notice (6 days avg.).
- Target marketing efforts for the Summer season well in advance (at least 79 days) to capture early planners.
- Monitor your own booking lead times against these Buissard averages to identify opportunities for dynamic pricing adjustments.
Popular & Essential Airbnb Amenities in Buissard (2025)
Amenity Prevalence
Amenity Insights for Buissard
- Popular amenities like Kitchen, Wifi, Free parking on premises are common but not universal. Offering these can provide a competitive edge.
- Warning: Wifi is not universally provided but is considered essential globally. Ensure reliable Wifi is offered.
Recommendations for Hosts
- Consider adding popular differentiators like Kitchen or Wifi to increase appeal.
- Highlight unique or less common amenities you offer (e.g., hot tub, dedicated workspace, EV charger) in your listing description and photos.
- Regularly check competitor amenities in Buissard to stay competitive.
Buissard Airbnb Guest Demographics & Profile Analysis (2025)
Guest Profile Summary for Buissard
- The typical guest profile for Airbnb in Buissard consists of primarily domestic travelers (90%), often arriving from nearby Marseille, typically belonging to the Post-2000s (Gen Z/Alpha) group (50%), primarily speaking French or English.
- Domestic travelers account for 89.5% of guests.
- Key international markets include France (89.5%) and Belgium (2.6%).
- Top languages spoken are French (43.1%) followed by English (30.7%).
- A significant demographic segment is the Post-2000s (Gen Z/Alpha) group, representing 50% of guests.
Recommendations for Hosts
- Target domestic marketing efforts towards travelers from Marseille and Aix-en-Provence.
- Tailor amenities and listing descriptions to appeal to the dominant Post-2000s (Gen Z/Alpha) demographic (e.g., highlight fast WiFi, smart home features, local guides).
- Highlight unique local experiences or amenities relevant to the primary guest profile.
- Consider seasonal promotions aligned with peak travel times for key origin markets.
Nearby Short-Term Rental Market Comparison
How does the Buissard Airbnb market stack up against its neighbors? Compare key performance metrics like average monthly revenue, ADR, and occupancy rates in surrounding areas to understand the broader regional STR landscape.
| Market | Active Properties | Monthly Revenue | Daily Rate | Avg. Occupancy |
|---|---|---|---|---|
| Les Clefs | 30 | $5,741 | $323.11 | 44% |
| Monteu Roero | 16 | $4,432 | $540.14 | 36% |
| Manigod | 194 | $4,127 | $427.80 | 40% |
| Ramatuelle | 213 | $3,891 | $670.10 | 41% |
| Saint-Jean-Cap-Ferrat | 107 | $3,844 | $424.21 | 46% |
| Saint-Tropez | 742 | $3,498 | $506.57 | 41% |
| Saint-Nicolas-la-Chapelle | 27 | $3,381 | $375.70 | 43% |
| Charvonnex | 11 | $3,212 | $228.03 | 56% |
| Èze | 153 | $3,168 | $345.84 | 47% |
| Veyrier-du-Lac | 134 | $3,139 | $430.47 | 43% |