Belvédère Airbnb Market Analysis 2025: Short Term Rental Data & Vacation Rental Statistics in Provence-Alpes-Côte d'Azur, France
Is Airbnb profitable in Belvédère in 2025? Explore comprehensive Airbnb analytics for Belvédère, Provence-Alpes-Côte d'Azur, France to uncover income potential. This 2025 STR market report for Belvédère, based on AirROI data from April 2024 to March 2025, reveals key trends in the niche market of 38 active listings.
Whether you're considering an Airbnb investment in Belvédère, optimizing your existing vacation rental, or exploring rental arbitrage opportunities, understanding the Belvédère Airbnb data is crucial. Understanding the local regulations is key to maximizing your short term rental income potential. Let's dive into the specifics.
Key Belvédère Airbnb Performance Metrics Overview
Monthly Airbnb Revenue Variations & Income Potential in Belvédère (2025)
Understanding the monthly revenue variations for Airbnb listings in Belvédère is key to maximizing your short term rental income potential. Seasonality significantly impacts earnings. Our analysis, based on data from the past 12 months, shows that the peak revenue month for STRs in Belvédère is typically August, while January often presents the lowest earnings, highlighting opportunities for strategic pricing adjustments during shoulder and low seasons. Explore the typical Airbnb income in Belvédère across different performance tiers:
- Best-in-class properties (Top 10%) achieve $2,755+ monthly, often utilizing dynamic pricing and superior guest experiences.
- Strong performing properties (Top 25%) earn $1,536 or more, indicating effective management and desirable locations/amenities.
- Typical properties (Median) generate around $905 per month, representing the average market performance.
- Entry-level properties (Bottom 25%) see earnings around $497, often with potential for optimization.
Average Monthly Airbnb Earnings Trend in Belvédère
Belvédère Airbnb Occupancy Rate Trends (2025)
Maximize your bookings by understanding the Belvédère STR occupancy trends. Seasonal demand shifts significantly influence how often properties are booked. Typically, Augustsees the highest demand (peak season occupancy), while January experiences the lowest (low season). Effective strategies, like adjusting minimum stays or offering promotions, can boost occupancy during slower periods. Here's how different property tiers perform in Belvédère:
- Best-in-class properties (Top 10%) achieve 72%+ occupancy, indicating high desirability and potentially optimized availability.
- Strong performing properties (Top 25%) maintain 54% or higher occupancy, suggesting good market fit and guest satisfaction.
- Typical properties (Median) have an occupancy rate around 34%.
- Entry-level properties (Bottom 25%) average 20% occupancy, potentially facing higher vacancy.
Average Monthly Occupancy Rate Trend in Belvédère
Average Daily Rate (ADR) Airbnb Trends in Belvédère (2025)
Effective short term rental pricing strategy in Belvédère involves understanding monthly ADR fluctuations. The Average Daily Rate (ADR) for Airbnb in Belvédère typically peaks in December and dips lowest during October. Leveraging Airbnb dynamic pricing tools or strategies based on this seasonality can significantly boost revenue. Here's a look at the typical nightly rates achieved:
- Best-in-class properties (Top 10%) command rates of $144+ per night, often due to premium features or locations.
- Strong performing properties (Top 25%) achieve nightly rates of $109 or more.
- Typical properties (Median) charge around $64 per night.
- Entry-level properties (Bottom 25%) earn around $55 per night.
Average Daily Rate (ADR) Trend by Month in Belvédère
Get Live Belvédère Market Intelligence 👇

Explore Real-time Analytics
Airbnb Seasonality Analysis & Trends in Belvédère (2025)
Peak Season (August, July, May)
- Revenue averages $1,723 per month
- Occupancy rates average 57.3%
- Daily rates average $87
Shoulder Season
- Revenue averages $1,061 per month
- Occupancy maintains around 35.4%
- Daily rates hold near $87
Low Season (January, March, November)
- Revenue drops to average $853 per month
- Occupancy decreases to average 27.1%
- Daily rates adjust to average $90
Seasonality Insights for Belvédère
- The Airbnb seasonality in Belvédère shows highly seasonal trends requiring careful strategy. While the sections above show seasonal averages, it's also insightful to look at the extremes:
- During the high season, the absolute peak month showcases Belvédère's highest earning potential, with monthly revenues capable of climbing to $2,104, occupancy reaching a high of 69.2%, and ADRs peaking at $94.
- Conversely, the slowest single month of the year, typically falling within the low season, marks the market's lowest point. In this month, revenue might dip to $827, occupancy could drop to 25.2%, and ADRs may adjust down to $84.
- Understanding both the seasonal averages and these monthly peaks and troughs in revenue, occupancy, and ADR is crucial for maximizing your Airbnb profit potential in Belvédère.
Seasonal Strategies for Maximizing Profit
- Peak Season: Maximize revenue through premium pricing and potentially longer minimum stays. Ensure high availability.
- Low Season: Offer competitive pricing, special promotions (e.g., extended stay discounts), and flexible cancellation policies. Target off-season travelers like remote workers or budget-conscious guests.
- Shoulder Seasons: Implement dynamic pricing that balances peak and low rates. Target weekend travelers or specific events. Offer slightly more flexible terms than peak season.
- Regularly analyze your own performance against these Belvédère seasonality benchmarks and adjust your pricing and availability strategy accordingly.
Best Areas for Airbnb Investment in Belvédère (2025)
Exploring the top neighborhoods for short-term rentals in Belvédère? This section highlights key areas, outlining why they are attractive for hosts and guests, along with notable local attractions. Consider these locations based on your target guest profile and investment strategy.
| Neighborhood / Area | Why Host Here? (Target Guests & Appeal) | Key Attractions & Landmarks |
|---|---|---|
| Belvédère Village | A charming mountain village offering stunning views and a tranquil atmosphere. It attracts tourists looking for a peaceful getaway and nature lovers keen on hiking and exploring the local scenery. | Mercantour National Park, Col de la Bonette, Local hiking trails, Historic village architecture, Cultural heritage sites |
| Castillon | A picturesque village known for its traditional Provençal charm and proximity to the mountains. Ideal for those looking for authentic experiences in nature and local culture. | Gorges de la Tinée, Local markets, Nearby hiking paths, Scenic viewpoints, Cultural festivals |
| Colmars-les-Alpes | A quaint village renowned for its historical architecture and beautiful landscapes. It offers winter sports and summer outdoor activities, appealing to a variety of travelers. | Fortification of Colmars, Ski resorts nearby, Thermal baths, Local artisan shops, Cultural events |
| Saint-Martin-d'Entraunes | Located in the heart of the Alpes-Maritimes, this area is perfect for eco-tourists and adventurers seeking outdoor activities year-round. | Gorges de la Vésubie, Horseback riding, Mountain biking trails, Local flora and fauna, Traditional gastronomy |
| Entrevaux | A fortified medieval town with rich history, making it a unique destination for visitors interested in culture and architecture. | Citadel of Entrevaux, Historic Old Town, The Verdon River, Gorges du Verdon nearby, Artisan shops and galleries |
| Villars-Colmars | A scenic location favored for winter sports and summer hiking, appealing to tourists year-round and offering stunning views of the mountains. | Ski slopes, Hiking opportunities, Local wildlife, Nature reserves, Panoramic viewpoints |
| Rimplas | A hidden gem that attracts those looking for peace and solitude in nature. Perfect for tourists who want to experience rural France. | Local hiking routes, Traditional Provençal architecture, Wild flora, Quiet village ambiance, Cultural traditions |
| Rouaine | Known for its idyllic rural roadways and proximity to nature parks. Ideal for tourists interested in cycling and exploring natural landscapes. | Cycling paths, Nature parks, Scenic mountain views, Local produce markets, Cultural workshops |
Understanding Airbnb License Requirements & STR Laws in Belvédère (2025)
With 21% of listings showing registration in 2025, understanding potential Airbnb license requirements is crucial in Belvédère. Always verify the latest short term rental regulations and Airbnb license requirements directly with local government authorities for Belvédère to ensure full compliance before hosting.
(Source: AirROI data, 2025, based on 21% licensed listings)
Top Performing Airbnb Properties in Belvédère (2025)
Benchmark your potential! Explore examples of top-performing Airbnb properties in Belvédèrebased on Trailing Twelve Month (TTM) revenue. Analyze their characteristics, revenue, occupancy rate, and ADR to understand what drives success in this market.

The Cabane de Belvédère
Entire Place • 1 bedroom
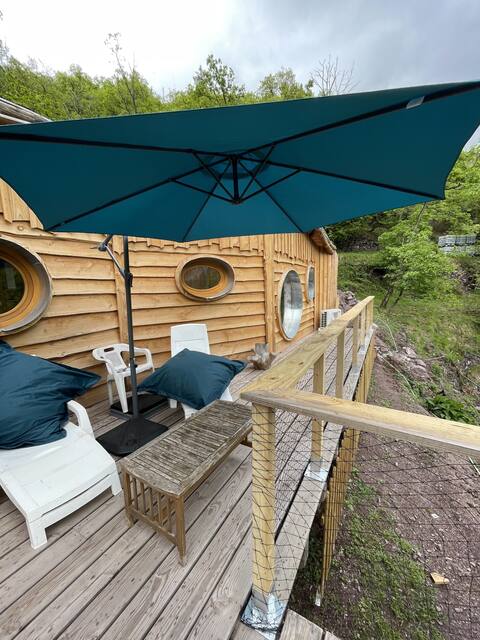
Log Cabin-Exclusive-Ensuite with Shower-Terrace
Entire Place • 1 bedroom

Room and breakfast at the inhabitant
Private Room • N/A
Log Cabin-Superior-Vanity unit-Mountain view
Entire Place • 1 bedroom

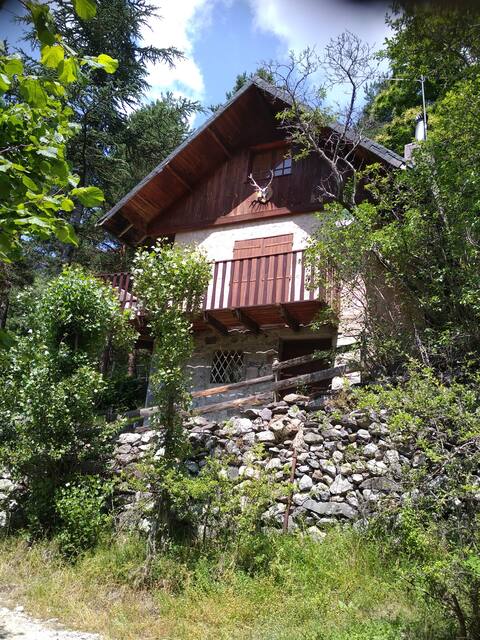
House, ideal mountain vacation.
Entire Place • 2 bedrooms
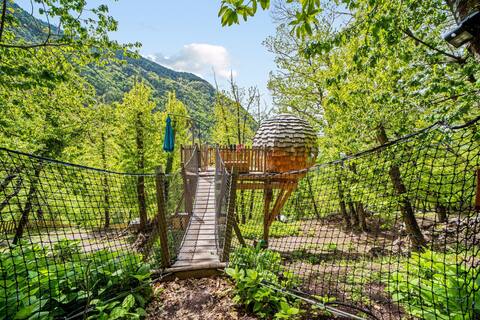
Le Chalet des 3 Marmottes Vallée des Merveilles
Entire Place • 3 bedrooms
Note: Performance varies based on location, size, amenities, seasonality, and management quality. Data reflects the past 12 months.
Top Performing Airbnb Hosts in Belvédère (2025)
Learn from the best! This table showcases top-performing Airbnb hosts in Belvédère based on the number of properties managed and estimated total revenue over the past year. Analyze their scale and performance metrics.
| Host Name | Properties | Grossing Revenue | Stay Reviews | Avg Rating |
|---|---|---|---|---|
| Marianne | 4 | $91,557 | 16 | 1.21/5.0 |
| Delphine | 2 | $30,906 | 32 | 4.95/5.0 |
| Samuel | 1 | $17,761 | 4 | 5.00/5.0 |
| Muriel | 1 | $16,875 | 6 | 5.00/5.0 |
| Jean-Paul | 1 | $16,457 | 11 | 4.91/5.0 |
| Marion | 2 | $16,137 | 79 | 4.90/5.0 |
| Christophe | 1 | $16,074 | 11 | 4.73/5.0 |
| Cindy | 3 | $14,935 | 393 | 4.84/5.0 |
| Geraldine | 1 | $14,917 | 124 | 4.92/5.0 |
| Tantely | 2 | $14,036 | 92 | 4.80/5.0 |
Analyzing the strategies of top hosts, such as their property selection, pricing, and guest communication, can offer valuable lessons for optimizing your own Airbnb operations in Belvédère.
Dive Deeper: Advanced Belvédère STR Market Data (2025)
Ready to unlock more insights? AirROI provides access to advanced metrics and comprehensive Airbnb data for Belvédère. Explore detailed analytics beyond this report to refine your investment strategy, optimize pricing, and maximize your vacation rental profits.
Explore Advanced MetricsBelvédère Short-Term Rental Market Composition (2025): Property & Room Types
Room Type Distribution
Property Type Distribution
Market Composition Insights for Belvédère
- The Belvédère Airbnb market composition is heavily skewed towards Entire Home/Apt listings, which make up 92.1% of the 38 active rentals. This indicates strong guest preference for privacy and space.
- Looking at the property type distribution in Belvédère, Apartment/Condo properties are the most common (50%), reflecting the local real estate landscape.
- Houses represent a significant 26.3% portion, catering likely to families or larger groups.
- The presence of 5.3% Hotel/Boutique listings indicates integration with traditional hospitality.
- Smaller segments like unique stays (combined 2.6%) offer potential for unique stay experiences.
Belvédère Airbnb Room Capacity Analysis (2025): Bedroom Distribution
Distribution of Listings by Number of Bedrooms
Room Capacity Insights for Belvédère
- The dominant room capacity in Belvédère is 1 bedroom listings, making up 52.6% of the market. This suggests a strong demand for properties suitable for couples or solo travelers.
- Together, 1 bedroom and 2 bedrooms properties represent 68.4% of the active Airbnb listings in Belvédère, indicating a high concentration in these sizes.
- With over half the market (52.6%) consisting of studios or 1-bedroom units, Belvédère is particularly well-suited for individuals or couples.
- Listings with 3+ bedrooms (7.9%) represent a smaller niche, potentially indicating an underserved market for larger group accommodations in Belvédère.
Belvédère Vacation Rental Guest Capacity Trends (2025)
Distribution of Listings by Guest Capacity
Guest Capacity Insights for Belvédère
- The most common guest capacity trend in Belvédère vacation rentals is listings accommodating 2 guests (44.7%). This suggests the primary traveler segment is likely couples or solo travelers.
- Properties designed for 2 guests and 4 guests dominate the Belvédère STR market, accounting for 68.4% of listings.
- A significant 44.7% of listings cater specifically to 1-2 guests, highlighting strong demand from couples and solo travelers in Belvédère.
- On average, properties in Belvédère are equipped to host 3.2 guests.
Belvédère Airbnb Booking Patterns (2025): Available vs. Booked Days
Available Days Distribution
Booked Days Distribution
Booking Pattern Insights for Belvédère
- The most common availability pattern in Belvédère falls within the 181-270 days range, representing 50% of listings. This suggests many properties have significant open periods on their calendars.
- Approximately 92.1% of listings show high availability (181+ days open annually), indicating potential for increased bookings or specific owner usage patterns.
- For booked days, the 91-180 days range is most frequent in Belvédère (52.6%), reflecting common guest stay durations or potential owner blocking patterns.
- A notable 7.9% of properties secure long booking periods (181+ days booked per year), highlighting successful long-term rental strategies or significant owner usage.
Belvédère Airbnb Minimum Stay Requirements Analysis
Distribution of Listings by Minimum Night Requirement
1 Night
11 listings
29.7% of total
2 Nights
13 listings
35.1% of total
3 Nights
6 listings
16.2% of total
4-6 Nights
4 listings
10.8% of total
7-29 Nights
1 listings
2.7% of total
30+ Nights
2 listings
5.4% of total
Key Insights
- The most prevalent minimum stay requirement in Belvédère is 2 Nights, adopted by 35.1% of listings. This highlights the market's preference for shorter, flexible bookings.
- A strong majority (64.8%) of the Belvédère Airbnb data shows acceptance of very short stays (1-2 nights), indicating a dynamic, high-turnover market.
Recommendations
- Align with the market by considering a 2 Nights minimum stay, as 35.1% of Belvédère hosts use this setting.
- If feasible, allowing 1-night stays, especially midweek or during low season, could capture last-minute bookings, as only 29.7% currently do.
- Explore offering discounts for stays of 30+ nights to attract the 5.4% of the market seeking extended stays.
- Adjust minimum nights based on seasonality – potentially shorter during low season and longer during peak demand periods in Belvédère.
Belvédère Airbnb Cancellation Policy Trends Analysis (2025)
Flexible
13 listings
40.6% of total
Moderate
6 listings
18.8% of total
Firm
8 listings
25% of total
Strict
5 listings
15.6% of total
Cancellation Policy Insights for Belvédère
- The prevailing Airbnb cancellation policy trend in Belvédère is Flexible, used by 40.6% of listings.
- There's a relatively balanced mix between guest-friendly (59.4%) and stricter (40.6%) policies, offering choices for different guest needs.
Recommendations for Hosts
- Consider adopting a Flexible policy to align with the 40.6% market standard in Belvédère.
- Regularly review your cancellation policy against competitors and market demand shifts in Belvédère.
Belvédère STR Booking Lead Time Analysis (2025)
Average Booking Lead Time by Month
Booking Lead Time Insights for Belvédère
- The overall average booking lead time for vacation rentals in Belvédère is 38 days.
- Guests book furthest in advance for stays during April (average 72 days), likely coinciding with peak travel demand or local events.
- The shortest booking windows occur for stays in March (average 10 days), indicating more last-minute travel plans during this time.
- Seasonally, Spring (47 days avg.) sees the longest lead times, while Winter (30 days avg.) has the shortest, reflecting typical travel planning cycles.
Recommendations for Hosts
- Use the overall average lead time (38 days) as a baseline for your pricing and availability strategy in Belvédère.
- For April stays, consider implementing length-of-stay discounts or slightly higher rates for bookings made less than 72 days out to capitalize on advance planning.
- During March, focus on last-minute booking availability and promotions, as guests book with very short notice (10 days avg.).
- Target marketing efforts for the Spring season well in advance (at least 47 days) to capture early planners.
- Monitor your own booking lead times against these Belvédère averages to identify opportunities for dynamic pricing adjustments.
Popular & Essential Airbnb Amenities in Belvédère (2025)
Amenity Prevalence
Amenity Insights for Belvédère
- Popular amenities like Kitchen, Coffee maker, Hot water are common but not universal. Offering these can provide a competitive edge.
Recommendations for Hosts
- Consider adding popular differentiators like Kitchen or Coffee maker to increase appeal.
- Highlight unique or less common amenities you offer (e.g., hot tub, dedicated workspace, EV charger) in your listing description and photos.
- Regularly check competitor amenities in Belvédère to stay competitive.
Belvédère Airbnb Guest Demographics & Profile Analysis (2025)
Guest Profile Summary for Belvédère
- The typical guest profile for Airbnb in Belvédère consists of primarily domestic travelers (80%), often arriving from nearby Nice, typically belonging to the Post-2000s (Gen Z/Alpha) group (50%), primarily speaking French or English.
- Domestic travelers account for 79.9% of guests.
- Key international markets include France (79.9%) and Germany (4.1%).
- Top languages spoken are French (36.7%) followed by English (32.2%).
- A significant demographic segment is the Post-2000s (Gen Z/Alpha) group, representing 50% of guests.
Recommendations for Hosts
- Target domestic marketing efforts towards travelers from Nice and Paris.
- Tailor amenities and listing descriptions to appeal to the dominant Post-2000s (Gen Z/Alpha) demographic (e.g., highlight fast WiFi, smart home features, local guides).
- Highlight unique local experiences or amenities relevant to the primary guest profile.
- Consider seasonal promotions aligned with peak travel times for key origin markets.
Nearby Short-Term Rental Market Comparison
How does the Belvédère Airbnb market stack up against its neighbors? Compare key performance metrics like average monthly revenue, ADR, and occupancy rates in surrounding areas to understand the broader regional STR landscape.
| Market | Active Properties | Monthly Revenue | Daily Rate | Avg. Occupancy |
|---|---|---|---|---|
| Les Clefs | 30 | $5,741 | $323.11 | 44% |
| Monteu Roero | 16 | $4,432 | $540.14 | 36% |
| Manigod | 194 | $4,127 | $427.80 | 40% |
| Ramatuelle | 213 | $3,891 | $670.10 | 41% |
| Saint-Jean-Cap-Ferrat | 107 | $3,844 | $424.21 | 46% |
| Cossano Belbo | 13 | $3,632 | $284.21 | 42% |
| Saint-Tropez | 742 | $3,498 | $506.57 | 41% |
| Saint-Nicolas-la-Chapelle | 27 | $3,381 | $375.70 | 43% |
| Cassinasco | 18 | $3,219 | $545.40 | 41% |
| Charvonnex | 11 | $3,212 | $228.03 | 56% |