Aups Airbnb Market Analysis 2025: Short Term Rental Data & Vacation Rental Statistics in Provence-Alpes-Côte d'Azur, France
Is Airbnb profitable in Aups in 2025? Explore comprehensive Airbnb analytics for Aups, Provence-Alpes-Côte d'Azur, France to uncover income potential. This 2025 STR market report for Aups, based on AirROI data from April 2024 to March 2025, reveals key trends in the niche market of 130 active listings.
Whether you're considering an Airbnb investment in Aups, optimizing your existing vacation rental, or exploring rental arbitrage opportunities, understanding the Aups Airbnb data is crucial. Leveraging the low regulation environment is key to maximizing your short term rental income potential. Let's dive into the specifics.
Key Aups Airbnb Performance Metrics Overview
Monthly Airbnb Revenue Variations & Income Potential in Aups (2025)
Understanding the monthly revenue variations for Airbnb listings in Aups is key to maximizing your short term rental income potential. Seasonality significantly impacts earnings. Our analysis, based on data from the past 12 months, shows that the peak revenue month for STRs in Aups is typically August, while February often presents the lowest earnings, highlighting opportunities for strategic pricing adjustments during shoulder and low seasons. Explore the typical Airbnb income in Aups across different performance tiers:
- Best-in-class properties (Top 10%) achieve $3,088+ monthly, often utilizing dynamic pricing and superior guest experiences.
- Strong performing properties (Top 25%) earn $1,921 or more, indicating effective management and desirable locations/amenities.
- Typical properties (Median) generate around $1,052 per month, representing the average market performance.
- Entry-level properties (Bottom 25%) see earnings around $504, often with potential for optimization.
Average Monthly Airbnb Earnings Trend in Aups
Aups Airbnb Occupancy Rate Trends (2025)
Maximize your bookings by understanding the Aups STR occupancy trends. Seasonal demand shifts significantly influence how often properties are booked. Typically, Augustsees the highest demand (peak season occupancy), while March experiences the lowest (low season). Effective strategies, like adjusting minimum stays or offering promotions, can boost occupancy during slower periods. Here's how different property tiers perform in Aups:
- Best-in-class properties (Top 10%) achieve 64%+ occupancy, indicating high desirability and potentially optimized availability.
- Strong performing properties (Top 25%) maintain 48% or higher occupancy, suggesting good market fit and guest satisfaction.
- Typical properties (Median) have an occupancy rate around 29%.
- Entry-level properties (Bottom 25%) average 16% occupancy, potentially facing higher vacancy.
Average Monthly Occupancy Rate Trend in Aups
Average Daily Rate (ADR) Airbnb Trends in Aups (2025)
Effective short term rental pricing strategy in Aups involves understanding monthly ADR fluctuations. The Average Daily Rate (ADR) for Airbnb in Aups typically peaks in August and dips lowest during November. Leveraging Airbnb dynamic pricing tools or strategies based on this seasonality can significantly boost revenue. Here's a look at the typical nightly rates achieved:
- Best-in-class properties (Top 10%) command rates of $307+ per night, often due to premium features or locations.
- Strong performing properties (Top 25%) achieve nightly rates of $165 or more.
- Typical properties (Median) charge around $102 per night.
- Entry-level properties (Bottom 25%) earn around $73 per night.
Average Daily Rate (ADR) Trend by Month in Aups
Get Live Aups Market Intelligence 👇

Explore Real-time Analytics
Airbnb Seasonality Analysis & Trends in Aups (2025)
Peak Season (August, July, September)
- Revenue averages $2,587 per month
- Occupancy rates average 55.2%
- Daily rates average $155
Shoulder Season
- Revenue averages $1,241 per month
- Occupancy maintains around 28.9%
- Daily rates hold near $146
Low Season (February, March, November)
- Revenue drops to average $690 per month
- Occupancy decreases to average 22.3%
- Daily rates adjust to average $142
Seasonality Insights for Aups
- The Airbnb seasonality in Aups shows highly seasonal trends requiring careful strategy. While the sections above show seasonal averages, it's also insightful to look at the extremes:
- During the high season, the absolute peak month showcases Aups's highest earning potential, with monthly revenues capable of climbing to $3,237, occupancy reaching a high of 65.0%, and ADRs peaking at $157.
- Conversely, the slowest single month of the year, typically falling within the low season, marks the market's lowest point. In this month, revenue might dip to $558, occupancy could drop to 19.8%, and ADRs may adjust down to $141.
- Understanding both the seasonal averages and these monthly peaks and troughs in revenue, occupancy, and ADR is crucial for maximizing your Airbnb profit potential in Aups.
Seasonal Strategies for Maximizing Profit
- Peak Season: Maximize revenue through premium pricing and potentially longer minimum stays. Ensure high availability.
- Low Season: Offer competitive pricing, special promotions (e.g., extended stay discounts), and flexible cancellation policies. Target off-season travelers like remote workers or budget-conscious guests.
- Shoulder Seasons: Implement dynamic pricing that balances peak and low rates. Target weekend travelers or specific events. Offer slightly more flexible terms than peak season.
- Regularly analyze your own performance against these Aups seasonality benchmarks and adjust your pricing and availability strategy accordingly.
Best Areas for Airbnb Investment in Aups (2025)
Exploring the top neighborhoods for short-term rentals in Aups? This section highlights key areas, outlining why they are attractive for hosts and guests, along with notable local attractions. Consider these locations based on your target guest profile and investment strategy.
| Neighborhood / Area | Why Host Here? (Target Guests & Appeal) | Key Attractions & Landmarks |
|---|---|---|
| Historical Center | Aups features charming medieval streets, perfect for tourists interested in history and local culture. The proximity to cafes, shops, and landmarks makes it a prime location for Airbnb hosting. | Église Saint-Roch, Château d'Aups, Local markets, Var region vineyards, La Grotte de Saint-Victor |
| Nature Trails | Aups is surrounded by beautiful landscapes and nature trails, ideal for outdoor enthusiasts. This area attracts hikers and nature lovers looking for a scenic getaway. | Gorges du Verdon, Montagne de Lure, Hiking and biking trails, Scenic viewpoints, Natural parks |
| Local Markets | One of the highlights of Aups is its vibrant local markets, where visitors can experience local produce and crafts. This area draws tourists looking for authentic experiences in Provence. | Weekly market on Tuesdays, Provence specialties, Artisan crafts, Local food stalls, Culinary experiences |
| Wine Country | The region around Aups is known for its wineries and vineyards, appealing to wine lovers. Hosting an Airbnb here can attract tourists seeking wine tours and tasting experiences. | Côtes de Provence vineyards, Wine tasting tours, Local winemakers, Scenic vineyard views, Wine and food pairings |
| Lavender Fields | During summer, the nearby lavender fields bloom, attracting many visitors for stunning photography. This area is perfect for those wishing to experience Provence's iconic landscapes. | Lavender farms, Photography tours, Local lavender products, Seasonal lavender festivals, Countryside picnics |
| Cultural Events | Aups hosts various cultural events and festivals throughout the year, drawing in visitors. An Airbnb in this area can be a great base for those attending local festivities. | Annual Fête de la Saint-Roch, Art and music festivals, Local theater productions, Cultural exhibitions, Provençal traditions |
| Proximity to Verdon | The famous Verdon Gorge is located not far from Aups, attracting adventure seekers and nature lovers. An Airbnb here is ideal for exploring one of France's most beautiful natural sites. | Verdon Gorge activities, Kayaking and rafting, Scenic drives, Rock climbing, Hiking trails |
| Rural Retreats | Aups offers a serene and peaceful rural setting, ideal for travelers looking to escape city life. This area attracts those seeking relaxation and tranquility in nature. | Countryside accommodations, Peaceful retreats, Biking and walking paths, Local fauna and flora, Stargazing |
Understanding Airbnb License Requirements & STR Laws in Aups (2025)
While Aups, Provence-Alpes-Côte d'Azur, France currently shows low STR regulations, specific Airbnb license requirements might still exist or change. Always verify the latest short term rental regulations and Airbnb license requirements directly with local government authorities for Aups to ensure full compliance before hosting.
(Source: AirROI data, 2025, based on 8% licensed listings)
Top Performing Airbnb Properties in Aups (2025)
Benchmark your potential! Explore examples of top-performing Airbnb properties in Aupsbased on Trailing Twelve Month (TTM) revenue. Analyze their characteristics, revenue, occupancy rate, and ADR to understand what drives success in this market.
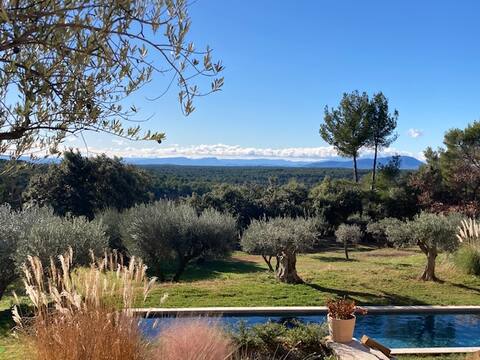
Provence holiday home, pool, beautiful view
Entire Place • 5 bedrooms

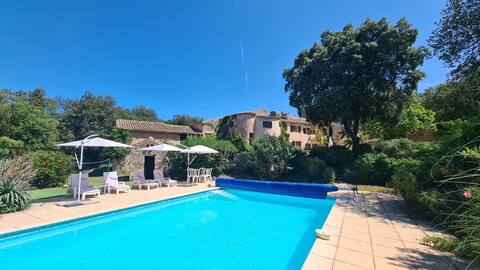
Detached house with private pool in Provence
Entire Place • 3 bedrooms
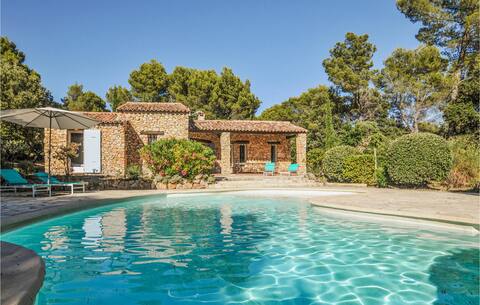
Magical Bastide, rural Provence
Entire Place • 7 bedrooms
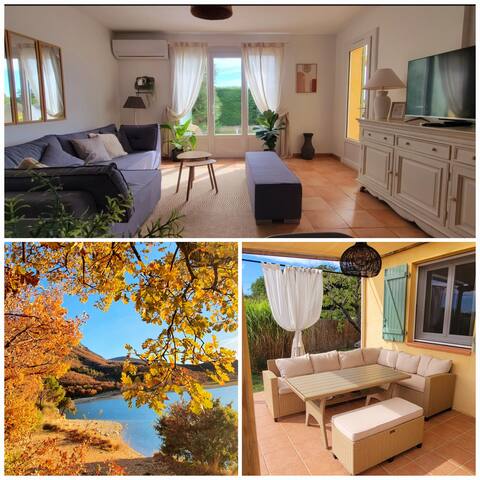
Cocon Provençal facing south
Entire Place • 2 bedrooms
6 bedroom nice home in Aups
Entire Place • 6 bedrooms
Le Mas - with large heated pool, Aups
Entire Place • 5 bedrooms
Note: Performance varies based on location, size, amenities, seasonality, and management quality. Data reflects the past 12 months.
Top Performing Airbnb Hosts in Aups (2025)
Learn from the best! This table showcases top-performing Airbnb hosts in Aups based on the number of properties managed and estimated total revenue over the past year. Analyze their scale and performance metrics.
| Host Name | Properties | Grossing Revenue | Stay Reviews | Avg Rating |
|---|---|---|---|---|
| Martine | 1 | $43,305 | 13 | 4.92/5.0 |
| Christian | 4 | $40,298 | 334 | 4.83/5.0 |
| Mindert | 1 | $40,237 | 10 | 4.90/5.0 |
| Katie | 1 | $39,002 | 5 | 5.00/5.0 |
| Julie | 1 | $34,211 | 32 | 5.00/5.0 |
| Marc Et Cécile | 2 | $33,237 | 64 | 4.96/5.0 |
| Host #143468407 | 1 | $31,458 | 0 | 0.00/5.0 |
| Host #74751664 | 1 | $29,268 | 0 | 0.00/5.0 |
| Olivier | 1 | $29,138 | 33 | 4.85/5.0 |
| Annie | 4 | $28,655 | 83 | 4.92/5.0 |
Analyzing the strategies of top hosts, such as their property selection, pricing, and guest communication, can offer valuable lessons for optimizing your own Airbnb operations in Aups.
Dive Deeper: Advanced Aups STR Market Data (2025)
Ready to unlock more insights? AirROI provides access to advanced metrics and comprehensive Airbnb data for Aups. Explore detailed analytics beyond this report to refine your investment strategy, optimize pricing, and maximize your vacation rental profits.
Explore Advanced MetricsAups Short-Term Rental Market Composition (2025): Property & Room Types
Room Type Distribution
Property Type Distribution
Market Composition Insights for Aups
- The Aups Airbnb market composition is heavily skewed towards Entire Home/Apt listings, which make up 91.5% of the 130 active rentals. This indicates strong guest preference for privacy and space.
- Looking at the property type distribution in Aups, House properties are the most common (52.3%), reflecting the local real estate landscape.
- Houses represent a significant 52.3% portion, catering likely to families or larger groups.
- The presence of 13.1% Hotel/Boutique listings indicates integration with traditional hospitality.
- Smaller segments like others, outdoor/unique, unique stays (combined 9.2%) offer potential for unique stay experiences.
Aups Airbnb Room Capacity Analysis (2025): Bedroom Distribution
Distribution of Listings by Number of Bedrooms
Room Capacity Insights for Aups
- The dominant room capacity in Aups is 1 bedroom listings, making up 34.6% of the market. This suggests a strong demand for properties suitable for couples or solo travelers.
- Together, 1 bedroom and 2 bedrooms properties represent 59.2% of the active Airbnb listings in Aups, indicating a high concentration in these sizes.
- A significant 31.6% of listings offer 3+ bedrooms, catering to larger groups and families seeking more space in Aups.
Aups Vacation Rental Guest Capacity Trends (2025)
Distribution of Listings by Guest Capacity
Guest Capacity Insights for Aups
- The most common guest capacity trend in Aups vacation rentals is listings accommodating 4 guests (33.8%). This suggests the primary traveler segment is likely small families or groups.
- Properties designed for 4 guests and 2 guests dominate the Aups STR market, accounting for 53.8% of listings.
- 35.3% of properties accommodate 6+ guests, serving the market segment for larger families or group travel in Aups.
- On average, properties in Aups are equipped to host 4.5 guests.
Aups Airbnb Booking Patterns (2025): Available vs. Booked Days
Available Days Distribution
Booked Days Distribution
Booking Pattern Insights for Aups
- The most common availability pattern in Aups falls within the 271-366 days range, representing 68.5% of listings. This suggests many properties have significant open periods on their calendars.
- Approximately 97.0% of listings show high availability (181+ days open annually), indicating potential for increased bookings or specific owner usage patterns.
- For booked days, the 31-90 days range is most frequent in Aups (45.4%), reflecting common guest stay durations or potential owner blocking patterns.
- A notable 5.3% of properties secure long booking periods (181+ days booked per year), highlighting successful long-term rental strategies or significant owner usage.
Aups Airbnb Minimum Stay Requirements Analysis
Distribution of Listings by Minimum Night Requirement
1 Night
23 listings
18.4% of total
2 Nights
21 listings
16.8% of total
3 Nights
36 listings
28.8% of total
4-6 Nights
24 listings
19.2% of total
7-29 Nights
14 listings
11.2% of total
30+ Nights
7 listings
5.6% of total
Key Insights
- The most prevalent minimum stay requirement in Aups is 3 Nights, adopted by 28.8% of listings. This highlights the market's preference for longer commitments.
Recommendations
- Align with the market by considering a 3 Nights minimum stay, as 28.8% of Aups hosts use this setting.
- If feasible, allowing 1-night stays, especially midweek or during low season, could capture last-minute bookings, as only 18.4% currently do.
- Explore offering discounts for stays of 30+ nights to attract the 5.6% of the market seeking extended stays.
- Adjust minimum nights based on seasonality – potentially shorter during low season and longer during peak demand periods in Aups.
Aups Airbnb Cancellation Policy Trends Analysis (2025)
Flexible
17 listings
15.6% of total
Moderate
23 listings
21.1% of total
Firm
22 listings
20.2% of total
Strict
47 listings
43.1% of total
Cancellation Policy Insights for Aups
- The prevailing Airbnb cancellation policy trend in Aups is Strict, used by 43.1% of listings.
- A majority (63.3%) of hosts in Aups utilize Firm or Strict policies, indicating a market where hosts prioritize booking security.
Recommendations for Hosts
- Consider adopting a Strict policy to align with the 43.1% market standard in Aups.
- With 43.1% using Strict terms, this is a viable option in Aups, particularly for high-value properties or during peak demand periods.
- Regularly review your cancellation policy against competitors and market demand shifts in Aups.
Aups STR Booking Lead Time Analysis (2025)
Average Booking Lead Time by Month
Booking Lead Time Insights for Aups
- The overall average booking lead time for vacation rentals in Aups is 66 days.
- Guests book furthest in advance for stays during July (average 95 days), likely coinciding with peak travel demand or local events.
- The shortest booking windows occur for stays in February (average 28 days), indicating more last-minute travel plans during this time.
- Seasonally, Summer (84 days avg.) sees the longest lead times, while Winter (35 days avg.) has the shortest, reflecting typical travel planning cycles.
Recommendations for Hosts
- Use the overall average lead time (66 days) as a baseline for your pricing and availability strategy in Aups.
- For July stays, consider implementing length-of-stay discounts or slightly higher rates for bookings made less than 95 days out to capitalize on advance planning.
- Target marketing efforts for the Summer season well in advance (at least 84 days) to capture early planners.
- Monitor your own booking lead times against these Aups averages to identify opportunities for dynamic pricing adjustments.
Popular & Essential Airbnb Amenities in Aups (2025)
Amenity Prevalence
Amenity Insights for Aups
- Popular amenities like Kitchen, Hot water, Heating are common but not universal. Offering these can provide a competitive edge.
- Warning: Wifi is not universally provided but is considered essential globally. Ensure reliable Wifi is offered.
Recommendations for Hosts
- Consider adding popular differentiators like Kitchen or Hot water to increase appeal.
- Highlight unique or less common amenities you offer (e.g., hot tub, dedicated workspace, EV charger) in your listing description and photos.
- Regularly check competitor amenities in Aups to stay competitive.
Aups Airbnb Guest Demographics & Profile Analysis (2025)
Guest Profile Summary for Aups
- The typical guest profile for Airbnb in Aups consists of primarily domestic travelers (66%), often arriving from nearby Paris, typically belonging to the Post-2000s (Gen Z/Alpha) group (50%), primarily speaking French or English.
- Domestic travelers account for 65.8% of guests.
- Key international markets include France (65.8%) and Germany (7.2%).
- Top languages spoken are French (35.2%) followed by English (33.5%).
- A significant demographic segment is the Post-2000s (Gen Z/Alpha) group, representing 50% of guests.
Recommendations for Hosts
- Target domestic marketing efforts towards travelers from Paris and Lyon.
- Tailor amenities and listing descriptions to appeal to the dominant Post-2000s (Gen Z/Alpha) demographic (e.g., highlight fast WiFi, smart home features, local guides).
- Highlight unique local experiences or amenities relevant to the primary guest profile.
- Consider seasonal promotions aligned with peak travel times for key origin markets.
Nearby Short-Term Rental Market Comparison
How does the Aups Airbnb market stack up against its neighbors? Compare key performance metrics like average monthly revenue, ADR, and occupancy rates in surrounding areas to understand the broader regional STR landscape.
| Market | Active Properties | Monthly Revenue | Daily Rate | Avg. Occupancy |
|---|---|---|---|---|
| Monteu Roero | 16 | $4,432 | $540.14 | 36% |
| Ramatuelle | 213 | $3,891 | $670.10 | 41% |
| Saint-Jean-Cap-Ferrat | 107 | $3,844 | $424.21 | 46% |
| Saint-Tropez | 742 | $3,498 | $506.57 | 41% |
| Èze | 153 | $3,168 | $345.84 | 47% |
| Chantepérier | 20 | $3,057 | $281.60 | 37% |
| Opio | 40 | $3,057 | $540.62 | 37% |
| Villefranche-sur-Mer | 501 | $2,977 | $268.57 | 52% |
| Gassin | 384 | $2,939 | $434.44 | 40% |
| Gordes | 225 | $2,913 | $366.32 | 43% |