Allauch Airbnb Market Analysis 2025: Short Term Rental Data & Vacation Rental Statistics in Provence-Alpes-Côte d'Azur, France
Is Airbnb profitable in Allauch in 2025? Explore comprehensive Airbnb analytics for Allauch, Provence-Alpes-Côte d'Azur, France to uncover income potential. This 2025 STR market report for Allauch, based on AirROI data from April 2024 to March 2025, reveals key trends in the niche market of 100 active listings.
Whether you're considering an Airbnb investment in Allauch, optimizing your existing vacation rental, or exploring rental arbitrage opportunities, understanding the Allauch Airbnb data is crucial. Leveraging the low regulation environment is key to maximizing your short term rental income potential. Let's dive into the specifics.
Key Allauch Airbnb Performance Metrics Overview
Monthly Airbnb Revenue Variations & Income Potential in Allauch (2025)
Understanding the monthly revenue variations for Airbnb listings in Allauch is key to maximizing your short term rental income potential. Seasonality significantly impacts earnings. Our analysis, based on data from the past 12 months, shows that the peak revenue month for STRs in Allauch is typically August, while March often presents the lowest earnings, highlighting opportunities for strategic pricing adjustments during shoulder and low seasons. Explore the typical Airbnb income in Allauch across different performance tiers:
- Best-in-class properties (Top 10%) achieve $3,534+ monthly, often utilizing dynamic pricing and superior guest experiences.
- Strong performing properties (Top 25%) earn $2,221 or more, indicating effective management and desirable locations/amenities.
- Typical properties (Median) generate around $1,283 per month, representing the average market performance.
- Entry-level properties (Bottom 25%) see earnings around $671, often with potential for optimization.
Average Monthly Airbnb Earnings Trend in Allauch
Allauch Airbnb Occupancy Rate Trends (2025)
Maximize your bookings by understanding the Allauch STR occupancy trends. Seasonal demand shifts significantly influence how often properties are booked. Typically, Augustsees the highest demand (peak season occupancy), while March experiences the lowest (low season). Effective strategies, like adjusting minimum stays or offering promotions, can boost occupancy during slower periods. Here's how different property tiers perform in Allauch:
- Best-in-class properties (Top 10%) achieve 82%+ occupancy, indicating high desirability and potentially optimized availability.
- Strong performing properties (Top 25%) maintain 60% or higher occupancy, suggesting good market fit and guest satisfaction.
- Typical properties (Median) have an occupancy rate around 37%.
- Entry-level properties (Bottom 25%) average 18% occupancy, potentially facing higher vacancy.
Average Monthly Occupancy Rate Trend in Allauch
Average Daily Rate (ADR) Airbnb Trends in Allauch (2025)
Effective short term rental pricing strategy in Allauch involves understanding monthly ADR fluctuations. The Average Daily Rate (ADR) for Airbnb in Allauch typically peaks in July and dips lowest during March. Leveraging Airbnb dynamic pricing tools or strategies based on this seasonality can significantly boost revenue. Here's a look at the typical nightly rates achieved:
- Best-in-class properties (Top 10%) command rates of $332+ per night, often due to premium features or locations.
- Strong performing properties (Top 25%) achieve nightly rates of $201 or more.
- Typical properties (Median) charge around $106 per night.
- Entry-level properties (Bottom 25%) earn around $73 per night.
Average Daily Rate (ADR) Trend by Month in Allauch
Get Live Allauch Market Intelligence 👇

Explore Real-time Analytics
Airbnb Seasonality Analysis & Trends in Allauch (2025)
Peak Season (August, July, May)
- Revenue averages $2,689 per month
- Occupancy rates average 49.8%
- Daily rates average $162
Shoulder Season
- Revenue averages $1,535 per month
- Occupancy maintains around 40.0%
- Daily rates hold near $155
Low Season (January, February, March)
- Revenue drops to average $892 per month
- Occupancy decreases to average 33.5%
- Daily rates adjust to average $147
Seasonality Insights for Allauch
- The Airbnb seasonality in Allauch shows highly seasonal trends requiring careful strategy. While the sections above show seasonal averages, it's also insightful to look at the extremes:
- During the high season, the absolute peak month showcases Allauch's highest earning potential, with monthly revenues capable of climbing to $2,957, occupancy reaching a high of 55.0%, and ADRs peaking at $164.
- Conversely, the slowest single month of the year, typically falling within the low season, marks the market's lowest point. In this month, revenue might dip to $844, occupancy could drop to 29.8%, and ADRs may adjust down to $146.
- Understanding both the seasonal averages and these monthly peaks and troughs in revenue, occupancy, and ADR is crucial for maximizing your Airbnb profit potential in Allauch.
Seasonal Strategies for Maximizing Profit
- Peak Season: Maximize revenue through premium pricing and potentially longer minimum stays. Ensure high availability.
- Low Season: Offer competitive pricing, special promotions (e.g., extended stay discounts), and flexible cancellation policies. Target off-season travelers like remote workers or budget-conscious guests.
- Shoulder Seasons: Implement dynamic pricing that balances peak and low rates. Target weekend travelers or specific events. Offer slightly more flexible terms than peak season.
- Regularly analyze your own performance against these Allauch seasonality benchmarks and adjust your pricing and availability strategy accordingly.
Best Areas for Airbnb Investment in Allauch (2025)
Exploring the top neighborhoods for short-term rentals in Allauch? This section highlights key areas, outlining why they are attractive for hosts and guests, along with notable local attractions. Consider these locations based on your target guest profile and investment strategy.
| Neighborhood / Area | Why Host Here? (Target Guests & Appeal) | Key Attractions & Landmarks |
|---|---|---|
| Allauch Village | Charming hillside village with picturesque streets and traditional Provençal architecture. A peaceful retreat close to Marseille, attracting visitors seeking a quieter experience in the heart of Provence. | Église Saint-Sébastien, Le Parc de la Moline, Les Camoins, Hiking trails, Local markets |
| La Treille | Scenic area known for its vineyards and stunning views over the surrounding countryside. Ideal for guests looking for a rustic and authentic Provençal experience, with opportunities for wine tasting and outdoor activities. | Vineyards, Scenic viewpoints, Hiking paths, Local farms, Cultural events |
| Marseille City Center | Vibrant urban center with historical landmarks, shopping areas, and a bustling port. Attracts a diverse crowd including business travelers, tourists, and culture enthusiasts. | Old Port of Marseille, Basilique Notre-Dame de la Garde, MuCEM (Museum of European and Mediterranean Civilisations), La Canebière, Vieux Port |
| Plan de Cuques | Residential suburb featuring a family-friendly atmosphere and easy access to nature. Appeals to visitors looking for a community feel while being close to city attractions. | Parc du 26ème Centenaire, Local shops and markets, Nature walks, Cultural festivals |
| Le Puget | A quaint hamlet that offers a serene environment with rural charm. Great for guests seeking relaxation and nature without straying far from urban amenities. | Local parks, Wildlife viewing, Traditional Provençal cuisine, Quiet streets, Nature trails |
| La Penne-sur-Huveaune | Small town with a rich historical heritage and a close-knit community. Guests can enjoy a taste of local life and have access to hiking and nature. | Château de la Penne, Hiking trails, Local cafes, Historic sites, Outdoor activities |
| Aubagne | Known for its pottery and proximity to the Calanques National Park. Attracts tourists interested in crafts, outdoor adventures, and cultural experiences. | Santons (traditional Provençal figurines), Musee de la Légion Etrangère, Calanques National Park, Historic downtown, Local artisan shops |
| Cassis | Picturesque coastal town famous for its cliffs and calanques. Extremely popular with beachgoers and hikers, offering stunning natural beauty and a vibrant local market. | Cassis Beaches, Cassis Calanques, Wine tasting tours, Historic port, Local seafood restaurants |
Understanding Airbnb License Requirements & STR Laws in Allauch (2025)
While Allauch, Provence-Alpes-Côte d'Azur, France currently shows low STR regulations, specific Airbnb license requirements might still exist or change. Always verify the latest short term rental regulations and Airbnb license requirements directly with local government authorities for Allauch to ensure full compliance before hosting.
(Source: AirROI data, 2025, based on 6% licensed listings)
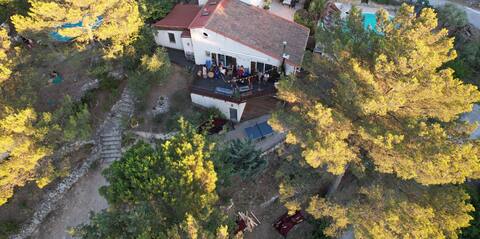
Top Performing Airbnb Properties in Allauch (2025)
Benchmark your potential! Explore examples of top-performing Airbnb properties in Allauchbased on Trailing Twelve Month (TTM) revenue. Analyze their characteristics, revenue, occupancy rate, and ADR to understand what drives success in this market.
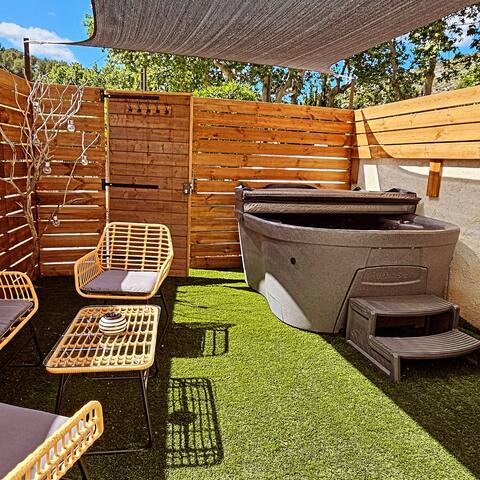
House in nature between Aix and Cassis
Entire Place • 4 bedrooms
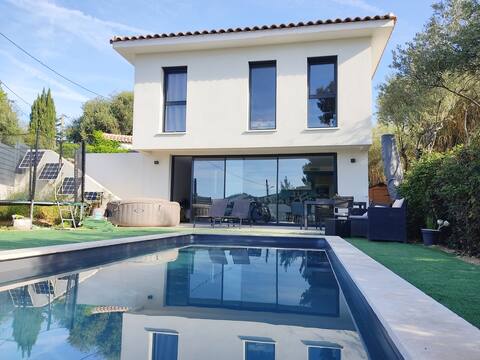
Architect villa with Pool.
Entire Place • 3 bedrooms
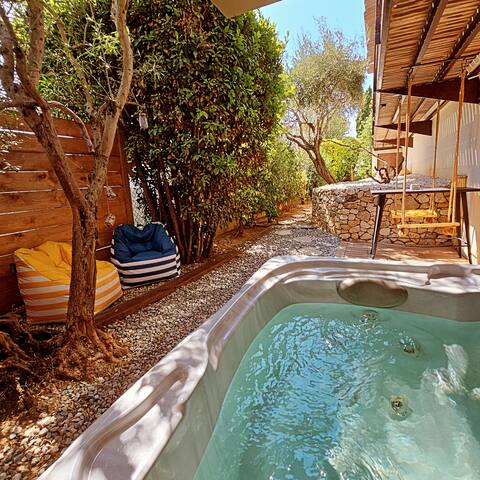
Chambre Cigale Allauch jacuzzi
Private Room • 1 bedroom
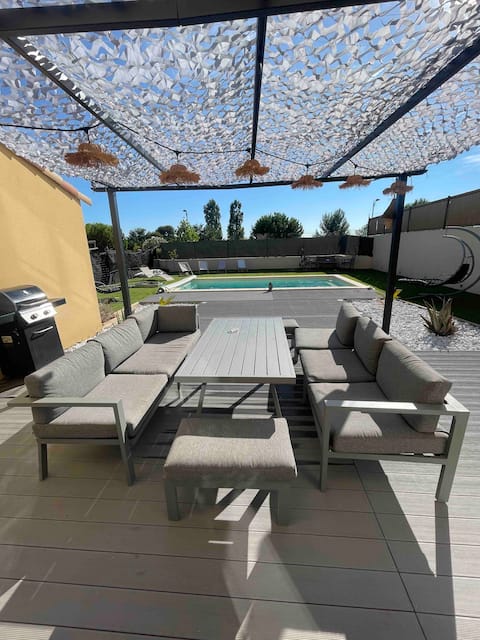
Pool and pétanque house
Entire Place • 2 bedrooms
Maison Plus Belle La Nuit with private Jacuzzi
Entire Place • 1 bedroom
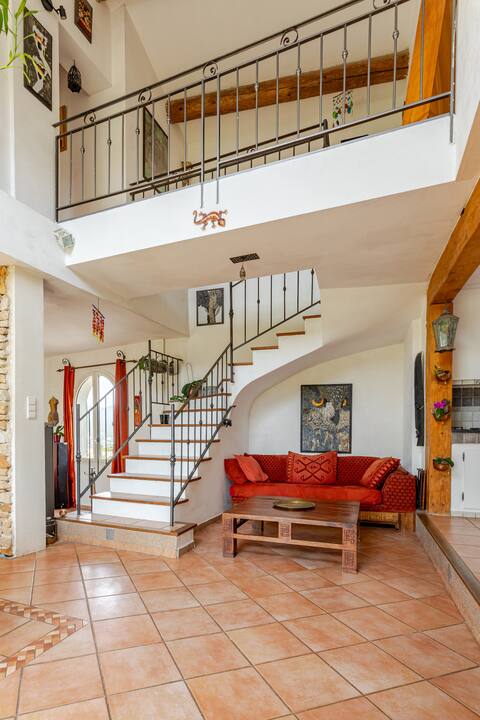
LARGE PEACEFUL HOME ON THE HEIGHTS OF ALLAUCH
Entire Place • 3 bedrooms
Note: Performance varies based on location, size, amenities, seasonality, and management quality. Data reflects the past 12 months.
Top Performing Airbnb Hosts in Allauch (2025)
Learn from the best! This table showcases top-performing Airbnb hosts in Allauch based on the number of properties managed and estimated total revenue over the past year. Analyze their scale and performance metrics.
| Host Name | Properties | Grossing Revenue | Stay Reviews | Avg Rating |
|---|---|---|---|---|
| Sandra | 3 | $85,688 | 49 | 4.91/5.0 |
| Aurelie | 2 | $37,132 | 86 | 4.83/5.0 |
| Vitorino | 1 | $36,240 | 22 | 4.73/5.0 |
| Julie | 1 | $34,366 | 17 | 4.94/5.0 |
| Céline | 2 | $33,425 | 57 | 4.96/5.0 |
| Morgane | 1 | $31,871 | 6 | 5.00/5.0 |
| Agnès | 1 | $29,449 | 49 | 4.86/5.0 |
| Host #544541210 | 1 | $29,225 | 5 | 4.80/5.0 |
| Jonathan | 1 | $27,342 | 52 | 4.77/5.0 |
| Christele Et Alain | 1 | $26,686 | 18 | 4.83/5.0 |
Analyzing the strategies of top hosts, such as their property selection, pricing, and guest communication, can offer valuable lessons for optimizing your own Airbnb operations in Allauch.
Dive Deeper: Advanced Allauch STR Market Data (2025)
Ready to unlock more insights? AirROI provides access to advanced metrics and comprehensive Airbnb data for Allauch. Explore detailed analytics beyond this report to refine your investment strategy, optimize pricing, and maximize your vacation rental profits.
Explore Advanced MetricsAllauch Short-Term Rental Market Composition (2025): Property & Room Types
Room Type Distribution
Property Type Distribution
Market Composition Insights for Allauch
- The Allauch Airbnb market composition is heavily skewed towards Entire Home/Apt listings, which make up 85% of the 100 active rentals. This indicates strong guest preference for privacy and space.
- Looking at the property type distribution in Allauch, House properties are the most common (62%), reflecting the local real estate landscape.
- Houses represent a significant 62% portion, catering likely to families or larger groups.
- The presence of 8% Hotel/Boutique listings indicates integration with traditional hospitality.
- Smaller segments like others (combined 2.0%) offer potential for unique stay experiences.
Allauch Airbnb Room Capacity Analysis (2025): Bedroom Distribution
Distribution of Listings by Number of Bedrooms
Room Capacity Insights for Allauch
- The dominant room capacity in Allauch is 1 bedroom listings, making up 37% of the market. This suggests a strong demand for properties suitable for couples or solo travelers.
- Together, 1 bedroom and 2 bedrooms properties represent 58.0% of the active Airbnb listings in Allauch, indicating a high concentration in these sizes.
- A significant 28.0% of listings offer 3+ bedrooms, catering to larger groups and families seeking more space in Allauch.
Allauch Vacation Rental Guest Capacity Trends (2025)
Distribution of Listings by Guest Capacity
Guest Capacity Insights for Allauch
- The most common guest capacity trend in Allauch vacation rentals is listings accommodating 4 guests (30%). This suggests the primary traveler segment is likely small families or groups.
- Properties designed for 4 guests and 2 guests dominate the Allauch STR market, accounting for 52.0% of listings.
- 26.0% of properties accommodate 6+ guests, serving the market segment for larger families or group travel in Allauch.
- On average, properties in Allauch are equipped to host 3.9 guests.
Allauch Airbnb Booking Patterns (2025): Available vs. Booked Days
Available Days Distribution
Booked Days Distribution
Booking Pattern Insights for Allauch
- The most common availability pattern in Allauch falls within the 271-366 days range, representing 61% of listings. This suggests many properties have significant open periods on their calendars.
- Approximately 86.0% of listings show high availability (181+ days open annually), indicating potential for increased bookings or specific owner usage patterns.
- For booked days, the 31-90 days range is most frequent in Allauch (40%), reflecting common guest stay durations or potential owner blocking patterns.
- A notable 14.0% of properties secure long booking periods (181+ days booked per year), highlighting successful long-term rental strategies or significant owner usage.
Allauch Airbnb Minimum Stay Requirements Analysis
Distribution of Listings by Minimum Night Requirement
1 Night
19 listings
22.4% of total
2 Nights
31 listings
36.5% of total
3 Nights
12 listings
14.1% of total
4-6 Nights
11 listings
12.9% of total
7-29 Nights
9 listings
10.6% of total
30+ Nights
3 listings
3.5% of total
Key Insights
- The most prevalent minimum stay requirement in Allauch is 2 Nights, adopted by 36.5% of listings. This highlights the market's preference for shorter, flexible bookings.
Recommendations
- Align with the market by considering a 2 Nights minimum stay, as 36.5% of Allauch hosts use this setting.
- If feasible, allowing 1-night stays, especially midweek or during low season, could capture last-minute bookings, as only 22.4% currently do.
- Adjust minimum nights based on seasonality – potentially shorter during low season and longer during peak demand periods in Allauch.
Allauch Airbnb Cancellation Policy Trends Analysis (2025)
Super Strict 60 Days
1 listings
1.3% of total
Flexible
23 listings
30.3% of total
Moderate
31 listings
40.8% of total
Firm
11 listings
14.5% of total
Strict
10 listings
13.2% of total
Cancellation Policy Insights for Allauch
- The prevailing Airbnb cancellation policy trend in Allauch is Moderate, used by 40.8% of listings.
- The market strongly favors guest-friendly terms, with 71.1% of listings offering Flexible or Moderate policies. This suggests guests in Allauch may expect booking flexibility.
Recommendations for Hosts
- Consider adopting a Moderate policy to align with the 40.8% market standard in Allauch.
- Using a Strict policy might deter some guests, as only 13.2% of listings use it. Evaluate if potential revenue protection outweighs possible lower booking rates.
- Regularly review your cancellation policy against competitors and market demand shifts in Allauch.
Allauch STR Booking Lead Time Analysis (2025)
Average Booking Lead Time by Month
Booking Lead Time Insights for Allauch
- The overall average booking lead time for vacation rentals in Allauch is 46 days.
- Guests book furthest in advance for stays during May (average 79 days), likely coinciding with peak travel demand or local events.
- The shortest booking windows occur for stays in March (average 29 days), indicating more last-minute travel plans during this time.
- Seasonally, Summer (68 days avg.) sees the longest lead times, while Winter (36 days avg.) has the shortest, reflecting typical travel planning cycles.
Recommendations for Hosts
- Use the overall average lead time (46 days) as a baseline for your pricing and availability strategy in Allauch.
- For May stays, consider implementing length-of-stay discounts or slightly higher rates for bookings made less than 79 days out to capitalize on advance planning.
- Target marketing efforts for the Summer season well in advance (at least 68 days) to capture early planners.
- Monitor your own booking lead times against these Allauch averages to identify opportunities for dynamic pricing adjustments.
Popular & Essential Airbnb Amenities in Allauch (2025)
Amenity Prevalence
Amenity Insights for Allauch
- Popular amenities like Wifi, Kitchen, Hot water are common but not universal. Offering these can provide a competitive edge.
- Warning: Wifi is not universally provided but is considered essential globally. Ensure reliable Wifi is offered.
Recommendations for Hosts
- Consider adding popular differentiators like Wifi or Kitchen to increase appeal.
- Highlight unique or less common amenities you offer (e.g., hot tub, dedicated workspace, EV charger) in your listing description and photos.
- Regularly check competitor amenities in Allauch to stay competitive.
Allauch Airbnb Guest Demographics & Profile Analysis (2025)
Guest Profile Summary for Allauch
- The typical guest profile for Airbnb in Allauch consists of primarily domestic travelers (81%), often arriving from nearby Paris, typically belonging to the Post-2000s (Gen Z/Alpha) group (50%), primarily speaking French or English.
- Domestic travelers account for 80.7% of guests.
- Key international markets include France (80.7%) and Germany (3.4%).
- Top languages spoken are French (45.5%) followed by English (32.5%).
- A significant demographic segment is the Post-2000s (Gen Z/Alpha) group, representing 50% of guests.
Recommendations for Hosts
- Target domestic marketing efforts towards travelers from Paris and Marseille.
- Tailor amenities and listing descriptions to appeal to the dominant Post-2000s (Gen Z/Alpha) demographic (e.g., highlight fast WiFi, smart home features, local guides).
- Highlight unique local experiences or amenities relevant to the primary guest profile.
- Consider seasonal promotions aligned with peak travel times for key origin markets.
Nearby Short-Term Rental Market Comparison
How does the Allauch Airbnb market stack up against its neighbors? Compare key performance metrics like average monthly revenue, ADR, and occupancy rates in surrounding areas to understand the broader regional STR landscape.
| Market | Active Properties | Monthly Revenue | Daily Rate | Avg. Occupancy |
|---|---|---|---|---|
| Divajeu | 19 | $3,941 | $410.65 | 42% |
| Ramatuelle | 213 | $3,891 | $670.10 | 41% |
| Saint-Tropez | 742 | $3,498 | $506.57 | 41% |
| Chantepérier | 20 | $3,057 | $281.60 | 37% |
| Opio | 40 | $3,057 | $540.62 | 37% |
| Gassin | 384 | $2,939 | $434.44 | 40% |
| Gordes | 225 | $2,913 | $366.32 | 43% |
| Redessan | 19 | $2,834 | $334.82 | 34% |
| Fontarèches | 11 | $2,802 | $525.31 | 34% |
| Ménerbes | 97 | $2,800 | $453.86 | 41% |