Visan Airbnb Market Analysis 2025: Short Term Rental Data & Vacation Rental Statistics in Provence-Alpes-Côte d'Azur, France
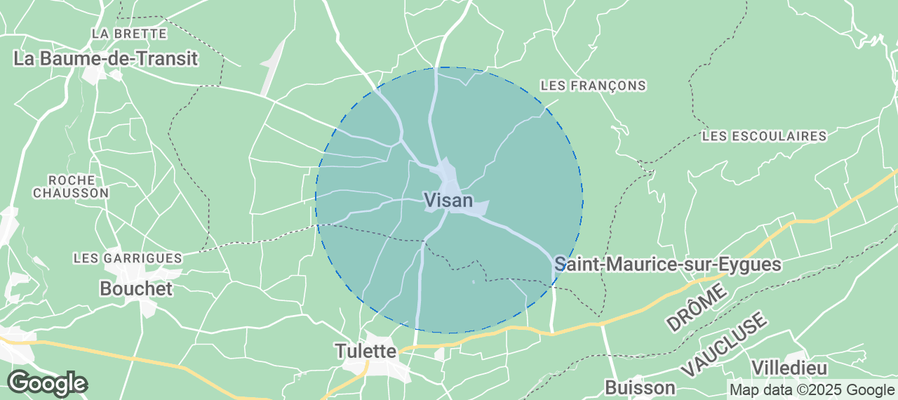
Is Airbnb profitable in Visan in 2025? Explore comprehensive Airbnb analytics for Visan, Provence-Alpes-Côte d'Azur, France to uncover income potential. This 2025 STR market report for Visan, based on AirROI data from April 2024 to March 2025, reveals key trends in the niche market of 33 active listings.
Whether you're considering an Airbnb investment in Visan, optimizing your existing vacation rental, or exploring rental arbitrage opportunities, understanding the Visan Airbnb data is crucial. Understanding the local regulations is key to maximizing your short term rental income potential. Let's dive into the specifics.
Key Visan Airbnb Performance Metrics Overview
Monthly Airbnb Revenue Variations & Income Potential in Visan (2025)
Understanding the monthly revenue variations for Airbnb listings in Visan is key to maximizing your short term rental income potential. Seasonality significantly impacts earnings. Our analysis, based on data from the past 12 months, shows that the peak revenue month for STRs in Visan is typically November, while February often presents the lowest earnings, highlighting opportunities for strategic pricing adjustments during shoulder and low seasons. Explore the typical Airbnb income in Visan across different performance tiers:
- Best-in-class properties (Top 10%) achieve $6,783+ monthly, often utilizing dynamic pricing and superior guest experiences.
- Strong performing properties (Top 25%) earn $3,182 or more, indicating effective management and desirable locations/amenities.
- Typical properties (Median) generate around $1,201 per month, representing the average market performance.
- Entry-level properties (Bottom 25%) see earnings around $625, often with potential for optimization.
Average Monthly Airbnb Earnings Trend in Visan
Visan Airbnb Occupancy Rate Trends (2025)
Maximize your bookings by understanding the Visan STR occupancy trends. Seasonal demand shifts significantly influence how often properties are booked. Typically, Augustsees the highest demand (peak season occupancy), while February experiences the lowest (low season). Effective strategies, like adjusting minimum stays or offering promotions, can boost occupancy during slower periods. Here's how different property tiers perform in Visan:
- Best-in-class properties (Top 10%) achieve 66%+ occupancy, indicating high desirability and potentially optimized availability.
- Strong performing properties (Top 25%) maintain 42% or higher occupancy, suggesting good market fit and guest satisfaction.
- Typical properties (Median) have an occupancy rate around 25%.
- Entry-level properties (Bottom 25%) average 15% occupancy, potentially facing higher vacancy.
Average Monthly Occupancy Rate Trend in Visan
Average Daily Rate (ADR) Airbnb Trends in Visan (2025)
Effective short term rental pricing strategy in Visan involves understanding monthly ADR fluctuations. The Average Daily Rate (ADR) for Airbnb in Visan typically peaks in January and dips lowest during May. Leveraging Airbnb dynamic pricing tools or strategies based on this seasonality can significantly boost revenue. Here's a look at the typical nightly rates achieved:
- Best-in-class properties (Top 10%) command rates of $495+ per night, often due to premium features or locations.
- Strong performing properties (Top 25%) achieve nightly rates of $300 or more.
- Typical properties (Median) charge around $133 per night.
- Entry-level properties (Bottom 25%) earn around $93 per night.
Average Daily Rate (ADR) Trend by Month in Visan
Get Live Visan Market Intelligence 👇
Explore Real-time Analytics
Airbnb Seasonality Analysis & Trends in Visan (2025)
Peak Season (November, July, August)
- Revenue averages $3,809 per month
- Occupancy rates average 42.1%
- Daily rates average $221
Shoulder Season
- Revenue averages $2,321 per month
- Occupancy maintains around 32.0%
- Daily rates hold near $221
Low Season (February, March, June)
- Revenue drops to average $1,003 per month
- Occupancy decreases to average 20.8%
- Daily rates adjust to average $228
Seasonality Insights for Visan
- The Airbnb seasonality in Visan shows highly seasonal trends requiring careful strategy. While the sections above show seasonal averages, it's also insightful to look at the extremes:
- During the high season, the absolute peak month showcases Visan's highest earning potential, with monthly revenues capable of climbing to $4,037, occupancy reaching a high of 51.7%, and ADRs peaking at $237.
- Conversely, the slowest single month of the year, typically falling within the low season, marks the market's lowest point. In this month, revenue might dip to $356, occupancy could drop to 16.9%, and ADRs may adjust down to $214.
- Understanding both the seasonal averages and these monthly peaks and troughs in revenue, occupancy, and ADR is crucial for maximizing your Airbnb profit potential in Visan.
Seasonal Strategies for Maximizing Profit
- Peak Season: Maximize revenue through premium pricing and potentially longer minimum stays. Ensure high availability.
- Low Season: Offer competitive pricing, special promotions (e.g., extended stay discounts), and flexible cancellation policies. Target off-season travelers like remote workers or budget-conscious guests.
- Shoulder Seasons: Implement dynamic pricing that balances peak and low rates. Target weekend travelers or specific events. Offer slightly more flexible terms than peak season.
- Regularly analyze your own performance against these Visan seasonality benchmarks and adjust your pricing and availability strategy accordingly.
Best Areas for Airbnb Investment in Visan (2025)
Exploring the top neighborhoods for short-term rentals in Visan? This section highlights key areas, outlining why they are attractive for hosts and guests, along with notable local attractions. Consider these locations based on your target guest profile and investment strategy.
| Neighborhood / Area | Why Host Here? (Target Guests & Appeal) | Key Attractions & Landmarks |
|---|---|---|
| Historic Centre of Visan | Charming medieval village with picturesque streets and historic architecture. Ideal for guests seeking an authentic French experience rich in culture and history. | Visan Castle, Église Saint-Étienne, Local wine tasting tours, Weekly markets, Scenic countryside walks |
| Châteaux de la Drôme | Nearby picturesque castles in the Drôme region attract history lovers and tourists. Perfect for visitors looking to explore the French countryside and its heritage. | Château de Grignan, Château de Suze-la-Rousse, Château de Montélimar, Wine routes, Beautiful landscapes |
| Mont Ventoux | Famous mountain, a popular destination for nature enthusiasts and cyclists. Attracts adventure seekers and those looking for breathtaking views and outdoor activities. | Climbing opportunities, Cycling routes, Hiking trails, Scenic viewpoints, Local flora and fauna |
| Orange | Nearby historical town known for its Roman ruins and opera festival. Offers visitors rich cultural experiences, making it a great base for exploring the region. | Theatre Antique d'Orange, Triumphal Arch of Orange, Orange Opera Festival, Néovinum Wine Museum |
| Provence Wine Region | Renowned for its vineyards and picturesque landscapes, this area draws wine enthusiasts and tourists looking for gastronomic experiences. | Local vineyards, Wine tasting events, Gastronomy festivals, Scenic drives through vineyards, Culinary workshops |
| Nyons | Known as the 'olive capital', this town offers a blend of culture and gastronomy, making it a perfect spot for foodies and those seeking relaxation. | Nyons olive oil mill, Local markets, Scenic views of vineyards, Outdoor activities by the Eygues River |
| Crest | Famous for its medieval tower and inviting countryside, Crest attracts families and tourists looking for a relaxing getaway in nature. | Crest Tower, Art galleries, Cultural events, Local handicrafts market, Scenic hiking trails |
| Vaison-la-Romaine | Historic town with significant Roman ruins and vibrant markets. Excellent for history buffs and cultural tourists seeking an immersive experience. | Roman theatre, Vaison la Romaine Archaeological Site, Cultural festivals, Weekly local market |
Understanding Airbnb License Requirements & STR Laws in Visan (2025)
With 12% of listings showing registration in 2025, understanding potential Airbnb license requirements is crucial in Visan. Always verify the latest short term rental regulations and Airbnb license requirements directly with local government authorities for Visan to ensure full compliance before hosting.
(Source: AirROI data, 2025, based on 12% licensed listings)
Top Performing Airbnb Properties in Visan (2025)
Benchmark your potential! Explore examples of top-performing Airbnb properties in Visanbased on Trailing Twelve Month (TTM) revenue. Analyze their characteristics, revenue, occupancy rate, and ADR to understand what drives success in this market.
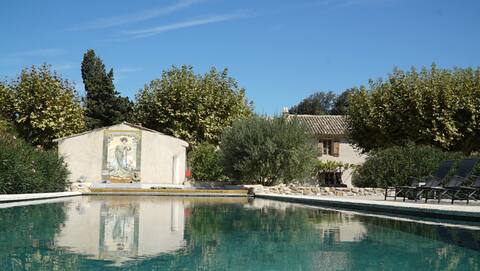
La Ferme Davidson
Entire Place • 7 bedrooms
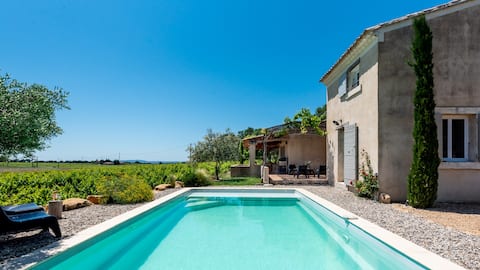
Pretty house in Provence "la maison Chabrette"
Entire Place • 4 bedrooms
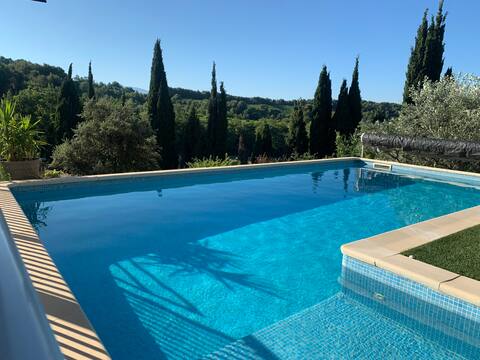
Le Mas des Cigales - Enclaves des Papes - Visan
Entire Place • 4 bedrooms

'les-cles-de-saint-pierre' in Visan, 11-15 pers.
Entire Place • 6 bedrooms
Domaine de La Sorbière en Provence
Entire Place • 2 bedrooms
the House of Angelo
Entire Place • 4 bedrooms
Note: Performance varies based on location, size, amenities, seasonality, and management quality. Data reflects the past 12 months.
Top Performing Airbnb Hosts in Visan (2025)
Learn from the best! This table showcases top-performing Airbnb hosts in Visan based on the number of properties managed and estimated total revenue over the past year. Analyze their scale and performance metrics.
| Host Name | Properties | Grossing Revenue | Stay Reviews | Avg Rating |
|---|---|---|---|---|
| Rudi | 1 | $80,641 | 3 | 5.00/5.0 |
| Audrey | 1 | $57,211 | 57 | 4.89/5.0 |
| Lucie | 2 | $34,439 | 35 | 4.78/5.0 |
| Olivier | 1 | $24,527 | 14 | 4.93/5.0 |
| Suzanne | 1 | $21,750 | 30 | 5.00/5.0 |
| Ilona | 1 | $21,670 | 6 | 4.67/5.0 |
| Jérôme | 1 | $20,785 | 3 | 5.00/5.0 |
| Baerbel | 1 | $19,516 | 27 | 4.59/5.0 |
| Jennifer | 1 | $18,408 | 29 | 4.76/5.0 |
| Charline | 1 | $17,828 | 161 | 4.83/5.0 |
Analyzing the strategies of top hosts, such as their property selection, pricing, and guest communication, can offer valuable lessons for optimizing your own Airbnb operations in Visan.
Dive Deeper: Advanced Visan STR Market Data (2025)
Ready to unlock more insights? AirROI provides access to advanced metrics and comprehensive Airbnb data for Visan. Explore detailed analytics beyond this report to refine your investment strategy, optimize pricing, and maximize your vacation rental profits.
Explore Advanced MetricsVisan Short-Term Rental Market Composition (2025): Property & Room Types
Room Type Distribution
Property Type Distribution
Market Composition Insights for Visan
- The Visan Airbnb market composition is heavily skewed towards Entire Home/Apt listings, which make up 84.8% of the 33 active rentals. This indicates strong guest preference for privacy and space.
- Looking at the property type distribution in Visan, House properties are the most common (57.6%), reflecting the local real estate landscape.
- Houses represent a significant 57.6% portion, catering likely to families or larger groups.
- The presence of 21.2% Hotel/Boutique listings indicates integration with traditional hospitality.
Visan Airbnb Room Capacity Analysis (2025): Bedroom Distribution
Distribution of Listings by Number of Bedrooms
Room Capacity Insights for Visan
- The dominant room capacity in Visan is 1 bedroom listings, making up 27.3% of the market. This suggests a strong demand for properties suitable for couples or solo travelers.
- Together, 1 bedroom and 2 bedrooms properties represent 51.5% of the active Airbnb listings in Visan, indicating a high concentration in these sizes.
- A significant 39.4% of listings offer 3+ bedrooms, catering to larger groups and families seeking more space in Visan.
Visan Vacation Rental Guest Capacity Trends (2025)
Distribution of Listings by Guest Capacity
Guest Capacity Insights for Visan
- The most common guest capacity trend in Visan vacation rentals is listings accommodating 8+ guests (33.3%). This suggests the primary traveler segment is likely larger groups.
- Properties designed for 8+ guests and 4 guests dominate the Visan STR market, accounting for 57.5% of listings.
- 39.3% of properties accommodate 6+ guests, serving the market segment for larger families or group travel in Visan.
- On average, properties in Visan are equipped to host 4.8 guests.
Visan Airbnb Booking Patterns (2025): Available vs. Booked Days
Available Days Distribution
Booked Days Distribution
Booking Pattern Insights for Visan
- The most common availability pattern in Visan falls within the 271-366 days range, representing 81.8% of listings. This suggests many properties have significant open periods on their calendars.
- Approximately 93.9% of listings show high availability (181+ days open annually), indicating potential for increased bookings or specific owner usage patterns.
- For booked days, the 31-90 days range is most frequent in Visan (60.6%), reflecting common guest stay durations or potential owner blocking patterns.
- A notable 6.1% of properties secure long booking periods (181+ days booked per year), highlighting successful long-term rental strategies or significant owner usage.
Visan Airbnb Minimum Stay Requirements Analysis
Distribution of Listings by Minimum Night Requirement
1 Night
8 listings
25% of total
2 Nights
9 listings
28.1% of total
3 Nights
5 listings
15.6% of total
4-6 Nights
5 listings
15.6% of total
7-29 Nights
4 listings
12.5% of total
30+ Nights
1 listings
3.1% of total
Key Insights
- The most prevalent minimum stay requirement in Visan is 2 Nights, adopted by 28.1% of listings. This highlights the market's preference for shorter, flexible bookings.
Recommendations
- Align with the market by considering a 2 Nights minimum stay, as 28.1% of Visan hosts use this setting.
- If feasible, allowing 1-night stays, especially midweek or during low season, could capture last-minute bookings, as only 25% currently do.
- Adjust minimum nights based on seasonality – potentially shorter during low season and longer during peak demand periods in Visan.
Visan Airbnb Cancellation Policy Trends Analysis (2025)
Super Strict 60 Days
1 listings
3.6% of total
Flexible
4 listings
14.3% of total
Moderate
9 listings
32.1% of total
Firm
8 listings
28.6% of total
Strict
6 listings
21.4% of total
Cancellation Policy Insights for Visan
- The prevailing Airbnb cancellation policy trend in Visan is Moderate, used by 32.1% of listings.
- There's a relatively balanced mix between guest-friendly (46.4%) and stricter (50.0%) policies, offering choices for different guest needs.
Recommendations for Hosts
- Consider adopting a Moderate policy to align with the 32.1% market standard in Visan.
- Regularly review your cancellation policy against competitors and market demand shifts in Visan.
Visan STR Booking Lead Time Analysis (2025)
Average Booking Lead Time by Month
Booking Lead Time Insights for Visan
- The overall average booking lead time for vacation rentals in Visan is 70 days.
- Guests book furthest in advance for stays during October (average 164 days), likely coinciding with peak travel demand or local events.
- The shortest booking windows occur for stays in January (average 44 days), indicating more last-minute travel plans during this time.
- Seasonally, Fall (127 days avg.) sees the longest lead times, while Winter (54 days avg.) has the shortest, reflecting typical travel planning cycles.
Recommendations for Hosts
- Use the overall average lead time (70 days) as a baseline for your pricing and availability strategy in Visan.
- For October stays, consider implementing length-of-stay discounts or slightly higher rates for bookings made less than 164 days out to capitalize on advance planning.
- Target marketing efforts for the Fall season well in advance (at least 127 days) to capture early planners.
- Monitor your own booking lead times against these Visan averages to identify opportunities for dynamic pricing adjustments.
Popular & Essential Airbnb Amenities in Visan (2025)
Amenity Prevalence
Amenity Insights for Visan
- Popular amenities like Free parking on premises, Hangers, Kitchen are common but not universal. Offering these can provide a competitive edge.
- A pool is a highly desired but not standard amenity, making it a key feature for attracting guests seeking leisure in Visan.
- Warning: Wifi is not universally provided but is considered essential globally. Ensure reliable Wifi is offered.
Recommendations for Hosts
- Consider adding popular differentiators like Free parking on premises or Hangers to increase appeal.
- Highlight unique or less common amenities you offer (e.g., hot tub, dedicated workspace, EV charger) in your listing description and photos.
- Regularly check competitor amenities in Visan to stay competitive.
Visan Airbnb Guest Demographics & Profile Analysis (2025)
Guest Profile Summary for Visan
- The typical guest profile for Airbnb in Visan consists of primarily domestic travelers (80%), often arriving from nearby Lyon, typically belonging to the Post-2000s (Gen Z/Alpha) group (50%), primarily speaking French or English.
- Domestic travelers account for 79.8% of guests.
- Key international markets include France (79.8%) and Belgium (7%).
- Top languages spoken are French (47.6%) followed by English (33.3%).
- A significant demographic segment is the Post-2000s (Gen Z/Alpha) group, representing 50% of guests.
Recommendations for Hosts
- Target domestic marketing efforts towards travelers from Lyon and Marseille.
- Tailor amenities and listing descriptions to appeal to the dominant Post-2000s (Gen Z/Alpha) demographic (e.g., highlight fast WiFi, smart home features, local guides).
- Highlight unique local experiences or amenities relevant to the primary guest profile.
- Consider seasonal promotions aligned with peak travel times for key origin markets.
Nearby Short-Term Rental Market Comparison
How does the Visan Airbnb market stack up against its neighbors? Compare key performance metrics like average monthly revenue, ADR, and occupancy rates in surrounding areas to understand the broader regional STR landscape.
| Market | Active Properties | Monthly Revenue | Daily Rate | Avg. Occupancy |
|---|---|---|---|---|
| Villeneuvette | 13 | $4,150 | $337.56 | 44% |
| Divajeu | 19 | $3,941 | $410.65 | 42% |
| Saint-Germain-au-Mont-d'Or | 10 | $3,928 | $316.02 | 40% |
| Dommartin | 11 | $3,905 | $327.00 | 36% |
| Courzieu | 11 | $3,267 | $287.83 | 52% |
| Vanosc | 13 | $3,072 | $224.52 | 44% |
| Chantepérier | 20 | $3,057 | $281.60 | 37% |
| Gordes | 225 | $2,913 | $366.32 | 43% |
| Redessan | 19 | $2,834 | $334.82 | 34% |
| Fontarèches | 11 | $2,802 | $525.31 | 34% |