Villefranche-sur-Mer Airbnb Market Analysis 2025: Short Term Rental Data & Vacation Rental Statistics in Provence-Alpes-Côte d'Azur, France
Is Airbnb profitable in Villefranche-sur-Mer in 2025? Explore comprehensive Airbnb analytics for Villefranche-sur-Mer, Provence-Alpes-Côte d'Azur, France to uncover income potential. This 2025 STR market report for Villefranche-sur-Mer, based on AirROI data from April 2024 to March 2025, reveals key trends in the market of 501 active listings.
Whether you're considering an Airbnb investment in Villefranche-sur-Mer, optimizing your existing vacation rental, or exploring rental arbitrage opportunities, understanding the Villefranche-sur-Mer Airbnb data is crucial. Navigating the high regulation landscape is key to maximizing your short term rental income potential. Let's dive into the specifics.
Key Villefranche-sur-Mer Airbnb Performance Metrics Overview
Monthly Airbnb Revenue Variations & Income Potential in Villefranche-sur-Mer (2025)
Understanding the monthly revenue variations for Airbnb listings in Villefranche-sur-Mer is key to maximizing your short term rental income potential. Seasonality significantly impacts earnings. Our analysis, based on data from the past 12 months, shows that the peak revenue month for STRs in Villefranche-sur-Mer is typically July, while January often presents the lowest earnings, highlighting opportunities for strategic pricing adjustments during shoulder and low seasons. Explore the typical Airbnb income in Villefranche-sur-Mer across different performance tiers:
- Best-in-class properties (Top 10%) achieve $7,574+ monthly, often utilizing dynamic pricing and superior guest experiences.
- Strong performing properties (Top 25%) earn $4,656 or more, indicating effective management and desirable locations/amenities.
- Typical properties (Median) generate around $2,751 per month, representing the average market performance.
- Entry-level properties (Bottom 25%) see earnings around $1,685, often with potential for optimization.
Average Monthly Airbnb Earnings Trend in Villefranche-sur-Mer
Villefranche-sur-Mer Airbnb Occupancy Rate Trends (2025)
Maximize your bookings by understanding the Villefranche-sur-Mer STR occupancy trends. Seasonal demand shifts significantly influence how often properties are booked. Typically, Julysees the highest demand (peak season occupancy), while January experiences the lowest (low season). Effective strategies, like adjusting minimum stays or offering promotions, can boost occupancy during slower periods. Here's how different property tiers perform in Villefranche-sur-Mer:
- Best-in-class properties (Top 10%) achieve 84%+ occupancy, indicating high desirability and potentially optimized availability.
- Strong performing properties (Top 25%) maintain 69% or higher occupancy, suggesting good market fit and guest satisfaction.
- Typical properties (Median) have an occupancy rate around 50%.
- Entry-level properties (Bottom 25%) average 29% occupancy, potentially facing higher vacancy.
Average Monthly Occupancy Rate Trend in Villefranche-sur-Mer
Average Daily Rate (ADR) Airbnb Trends in Villefranche-sur-Mer (2025)
Effective short term rental pricing strategy in Villefranche-sur-Mer involves understanding monthly ADR fluctuations. The Average Daily Rate (ADR) for Airbnb in Villefranche-sur-Mer typically peaks in July and dips lowest during November. Leveraging Airbnb dynamic pricing tools or strategies based on this seasonality can significantly boost revenue. Here's a look at the typical nightly rates achieved:
- Best-in-class properties (Top 10%) command rates of $471+ per night, often due to premium features or locations.
- Strong performing properties (Top 25%) achieve nightly rates of $274 or more.
- Typical properties (Median) charge around $173 per night.
- Entry-level properties (Bottom 25%) earn around $119 per night.
Average Daily Rate (ADR) Trend by Month in Villefranche-sur-Mer
Get Live Villefranche-sur-Mer Market Intelligence 👇

Explore Real-time Analytics
Airbnb Seasonality Analysis & Trends in Villefranche-sur-Mer (2025)
Peak Season (July, August, June)
- Revenue averages $6,291 per month
- Occupancy rates average 68.4%
- Daily rates average $299
Shoulder Season
- Revenue averages $3,676 per month
- Occupancy maintains around 48.6%
- Daily rates hold near $263
Low Season (January, February, December)
- Revenue drops to average $1,833 per month
- Occupancy decreases to average 32.4%
- Daily rates adjust to average $237
Seasonality Insights for Villefranche-sur-Mer
- The Airbnb seasonality in Villefranche-sur-Mer shows highly seasonal trends requiring careful strategy. While the sections above show seasonal averages, it's also insightful to look at the extremes:
- During the high season, the absolute peak month showcases Villefranche-sur-Mer's highest earning potential, with monthly revenues capable of climbing to $6,470, occupancy reaching a high of 71.8%, and ADRs peaking at $303.
- Conversely, the slowest single month of the year, typically falling within the low season, marks the market's lowest point. In this month, revenue might dip to $1,679, occupancy could drop to 30.1%, and ADRs may adjust down to $235.
- Understanding both the seasonal averages and these monthly peaks and troughs in revenue, occupancy, and ADR is crucial for maximizing your Airbnb profit potential in Villefranche-sur-Mer.
Seasonal Strategies for Maximizing Profit
- Peak Season: Maximize revenue through premium pricing and potentially longer minimum stays. Ensure high availability.
- Low Season: Offer competitive pricing, special promotions (e.g., extended stay discounts), and flexible cancellation policies. Target off-season travelers like remote workers or budget-conscious guests.
- Shoulder Seasons: Implement dynamic pricing that balances peak and low rates. Target weekend travelers or specific events. Offer slightly more flexible terms than peak season.
- Regularly analyze your own performance against these Villefranche-sur-Mer seasonality benchmarks and adjust your pricing and availability strategy accordingly.
Best Areas for Airbnb Investment in Villefranche-sur-Mer (2025)
Exploring the top neighborhoods for short-term rentals in Villefranche-sur-Mer? This section highlights key areas, outlining why they are attractive for hosts and guests, along with notable local attractions. Consider these locations based on your target guest profile and investment strategy.
| Neighborhood / Area | Why Host Here? (Target Guests & Appeal) | Key Attractions & Landmarks |
|---|---|---|
| Old Town | Charmingly historic area with narrow streets, beautiful architecture, and a vibrant local atmosphere. Ideal for travelers wanting to experience the authentic culture of Villefranche-sur-Mer. | Saint-Pierre Chapel, Fort du Mont Alban, Old Harbor, Rue Obscure, La Citadelle |
| Beaches | Popular beach area known for its stunning coastline and crystal-clear waters. Perfect for sun-seekers and water sports enthusiasts. | Plage des Marinieres, Plage de la Darse, Plage de la Baie des Fourmis, snorkeling and diving spots, water sports rentals |
| Mont Boron | Scenic hillside area offering panoramic views and a tranquil atmosphere. Great for those looking for a peaceful retreat near the coast. | Mont Boron Park, Viewpoints, Hiking trails, Belle Epoque villas, Botanical Garden |
| Cap Ferrat | Luxury location with exclusive villas and stunning beaches. Attracts affluent travelers seeking a premium Airbnb experience. | Cap Ferrat beaches, Villa Ephrussi de Rothschild, Coastal walking paths, Luxury restaurants, Private yacht rentals |
| Promenade des Anglais | Famous coastal promenade ideal for leisurely walks and beachfront dining. Attractive for tourists who want to enjoy the seaside atmosphere. | Beaches, Restaurants and cafes, Cycling paths, Tennis clubs, Lawn bowling areas |
| Local Markets | Vibrant local markets offering fresh produce and local delicacies. Great for food lovers and those seeking an authentic experience. | Villefranche-sur-Mer Market, Local artisan stalls, Culinary workshops, Food tasting events, Wine tastings |
| Cultural Attractions | Area rich in art and culture, providing a deeper insight into the local history and traditions. Perfect for travelers interested in culture and arts. | Cinematheque, Local art galleries, Cultural festivals, Historical exhibitions, Theater performances |
| Nightlife Spots | Energetic nightlife scene with bars and clubs, appealing to younger travelers and those looking for evening entertainment. | Beach clubs, Wine bars, Live music venues, Dance clubs, Cocktail lounges |
Understanding Airbnb License Requirements & STR Laws in Villefranche-sur-Mer (2025)
Yes, Villefranche-sur-Mer, Provence-Alpes-Côte d'Azur, France enforces high STR regulations. Obtaining a license and ensuring compliance is almost certainly required according to current 2025 STR laws. Always verify the latest short term rental regulations and Airbnb license requirements directly with local government authorities for Villefranche-sur-Mer to ensure full compliance before hosting.
(Source: AirROI data, 2025, based on 35% licensed listings)
Top Performing Airbnb Properties in Villefranche-sur-Mer (2025)
Benchmark your potential! Explore examples of top-performing Airbnb properties in Villefranche-sur-Merbased on Trailing Twelve Month (TTM) revenue. Analyze their characteristics, revenue, occupancy rate, and ADR to understand what drives success in this market.
Villa Vista Mare by iVillamia .com
Entire Place • 4 bedrooms

Villa Les Terrasses
Entire Place • 5 bedrooms
Villa Belle Vue Vi4394 By Riviera Holiday Homes
Entire Place • 4 bedrooms
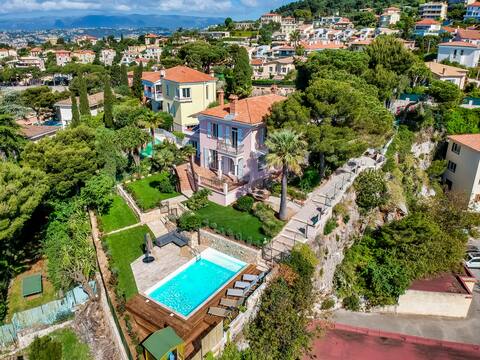
Belle Epoque villa. Panoramic seaview Villefranche
Entire Place • 5 bedrooms
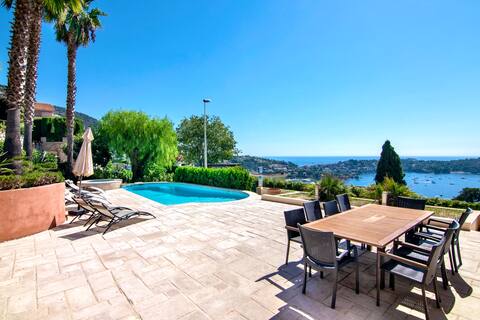
Beautiful villa with pool and harbor view
Entire Place • 5 bedrooms
Villa Claire - a private villa with the best view!
Entire Place • 5 bedrooms
Note: Performance varies based on location, size, amenities, seasonality, and management quality. Data reflects the past 12 months.
Top Performing Airbnb Hosts in Villefranche-sur-Mer (2025)
Learn from the best! This table showcases top-performing Airbnb hosts in Villefranche-sur-Mer based on the number of properties managed and estimated total revenue over the past year. Analyze their scale and performance metrics.
| Host Name | Properties | Grossing Revenue | Stay Reviews | Avg Rating |
|---|---|---|---|---|
| Lucienne Giulian | 31 | $912,431 | 199 | 3.26/5.0 |
| Géraldine | 9 | $664,779 | 170 | 4.33/5.0 |
| Lucas | 7 | $410,167 | 272 | 4.78/5.0 |
| David | 1 | $368,882 | 11 | 5.00/5.0 |
| Romain | 11 | $363,419 | 319 | 4.84/5.0 |
| Jon Gisle | 2 | $308,969 | 263 | 4.88/5.0 |
| Virginie | 10 | $308,694 | 201 | 4.26/5.0 |
| Fox Keys | 11 | $294,017 | 307 | 4.91/5.0 |
| Tina | 1 | $239,336 | 9 | 4.78/5.0 |
| Damien | 4 | $229,858 | 103 | 4.66/5.0 |
Analyzing the strategies of top hosts, such as their property selection, pricing, and guest communication, can offer valuable lessons for optimizing your own Airbnb operations in Villefranche-sur-Mer.
Dive Deeper: Advanced Villefranche-sur-Mer STR Market Data (2025)
Ready to unlock more insights? AirROI provides access to advanced metrics and comprehensive Airbnb data for Villefranche-sur-Mer. Explore detailed analytics beyond this report to refine your investment strategy, optimize pricing, and maximize your vacation rental profits.
Explore Advanced MetricsVillefranche-sur-Mer Short-Term Rental Market Composition (2025): Property & Room Types
Room Type Distribution
Property Type Distribution
Market Composition Insights for Villefranche-sur-Mer
- The Villefranche-sur-Mer Airbnb market composition is heavily skewed towards Entire Home/Apt listings, which make up 98% of the 501 active rentals. This indicates strong guest preference for privacy and space.
- Looking at the property type distribution in Villefranche-sur-Mer, Apartment/Condo properties are the most common (85.4%), reflecting the local real estate landscape.
- Smaller segments like hotel/boutique, others, unique stays (combined 2.0%) offer potential for unique stay experiences.
Villefranche-sur-Mer Airbnb Room Capacity Analysis (2025): Bedroom Distribution
Distribution of Listings by Number of Bedrooms
Room Capacity Insights for Villefranche-sur-Mer
- The dominant room capacity in Villefranche-sur-Mer is 1 bedroom listings, making up 45.5% of the market. This suggests a strong demand for properties suitable for couples or solo travelers.
- Together, 1 bedroom and 2 bedrooms properties represent 76.6% of the active Airbnb listings in Villefranche-sur-Mer, indicating a high concentration in these sizes.
Villefranche-sur-Mer Vacation Rental Guest Capacity Trends (2025)
Distribution of Listings by Guest Capacity
Guest Capacity Insights for Villefranche-sur-Mer
- The most common guest capacity trend in Villefranche-sur-Mer vacation rentals is listings accommodating 4 guests (45.1%). This suggests the primary traveler segment is likely small families or groups.
- Properties designed for 4 guests and 2 guests dominate the Villefranche-sur-Mer STR market, accounting for 68.1% of listings.
- 17.6% of properties accommodate 6+ guests, serving the market segment for larger families or group travel in Villefranche-sur-Mer.
- On average, properties in Villefranche-sur-Mer are equipped to host 4.0 guests.
Villefranche-sur-Mer Airbnb Booking Patterns (2025): Available vs. Booked Days
Available Days Distribution
Booked Days Distribution
Booking Pattern Insights for Villefranche-sur-Mer
- The most common availability pattern in Villefranche-sur-Mer falls within the 181-270 days range, representing 43.9% of listings. This suggests many properties have significant open periods on their calendars.
- Approximately 70.4% of listings show high availability (181+ days open annually), indicating potential for increased bookings or specific owner usage patterns.
- For booked days, the 91-180 days range is most frequent in Villefranche-sur-Mer (43.5%), reflecting common guest stay durations or potential owner blocking patterns.
- A notable 31.6% of properties secure long booking periods (181+ days booked per year), highlighting successful long-term rental strategies or significant owner usage.
Villefranche-sur-Mer Airbnb Minimum Stay Requirements Analysis
Distribution of Listings by Minimum Night Requirement
1 Night
23 listings
4.9% of total
2 Nights
55 listings
11.8% of total
3 Nights
103 listings
22.2% of total
4-6 Nights
123 listings
26.5% of total
7-29 Nights
54 listings
11.6% of total
30+ Nights
107 listings
23% of total
Key Insights
- The most prevalent minimum stay requirement in Villefranche-sur-Mer is 4-6 Nights, adopted by 26.5% of listings. This highlights the market's preference for longer commitments.
- Very short stays (1-2 nights) are less common (16.7%), suggesting hosts prefer slightly longer bookings to optimize turnover.
- A significant segment (23%) caters to monthly stays (30+ nights) in Villefranche-sur-Mer, pointing to opportunities in the extended-stay market.
Recommendations
- Align with the market by considering a 4-6 Nights minimum stay, as 26.5% of Villefranche-sur-Mer hosts use this setting.
- If feasible, allowing 1-night stays, especially midweek or during low season, could capture last-minute bookings, as only 4.9% currently do.
- Explore offering discounts for stays of 30+ nights to attract the 23% of the market seeking extended stays.
- Adjust minimum nights based on seasonality – potentially shorter during low season and longer during peak demand periods in Villefranche-sur-Mer.
Villefranche-sur-Mer Airbnb Cancellation Policy Trends Analysis (2025)
Super Strict 30 Days
5 listings
1.1% of total
Flexible
40 listings
9% of total
Moderate
117 listings
26.5% of total
Firm
103 listings
23.3% of total
Strict
177 listings
40% of total
Cancellation Policy Insights for Villefranche-sur-Mer
- The prevailing Airbnb cancellation policy trend in Villefranche-sur-Mer is Strict, used by 40% of listings.
- A majority (63.3%) of hosts in Villefranche-sur-Mer utilize Firm or Strict policies, indicating a market where hosts prioritize booking security.
Recommendations for Hosts
- Consider adopting a Strict policy to align with the 40% market standard in Villefranche-sur-Mer.
- With 40% using Strict terms, this is a viable option in Villefranche-sur-Mer, particularly for high-value properties or during peak demand periods.
- Regularly review your cancellation policy against competitors and market demand shifts in Villefranche-sur-Mer.
Villefranche-sur-Mer STR Booking Lead Time Analysis (2025)
Average Booking Lead Time by Month
Booking Lead Time Insights for Villefranche-sur-Mer
- The overall average booking lead time for vacation rentals in Villefranche-sur-Mer is 73 days.
- Guests book furthest in advance for stays during July (average 126 days), likely coinciding with peak travel demand or local events.
- The shortest booking windows occur for stays in November (average 55 days), indicating more last-minute travel plans during this time.
- Seasonally, Summer (108 days avg.) sees the longest lead times, while Winter (61 days avg.) has the shortest, reflecting typical travel planning cycles.
Recommendations for Hosts
- Use the overall average lead time (73 days) as a baseline for your pricing and availability strategy in Villefranche-sur-Mer.
- For July stays, consider implementing length-of-stay discounts or slightly higher rates for bookings made less than 126 days out to capitalize on advance planning.
- Target marketing efforts for the Summer season well in advance (at least 108 days) to capture early planners.
- Monitor your own booking lead times against these Villefranche-sur-Mer averages to identify opportunities for dynamic pricing adjustments.
Popular & Essential Airbnb Amenities in Villefranche-sur-Mer (2025)
Amenity Prevalence
Amenity Insights for Villefranche-sur-Mer
- Essential amenities in Villefranche-sur-Mer that guests expect include: Kitchen, Wifi. Lacking these (any) could significantly impact bookings.
- Popular amenities like Heating, Washer, TV are common but not universal. Offering these can provide a competitive edge.
Recommendations for Hosts
- Ensure your listing includes all essential amenities for Villefranche-sur-Mer: Kitchen, Wifi.
- Prioritize adding missing essentials: Kitchen, Wifi.
- Consider adding popular differentiators like Heating or Washer to increase appeal.
- Highlight unique or less common amenities you offer (e.g., hot tub, dedicated workspace, EV charger) in your listing description and photos.
- Regularly check competitor amenities in Villefranche-sur-Mer to stay competitive.
Villefranche-sur-Mer Airbnb Guest Demographics & Profile Analysis (2025)
Guest Profile Summary for Villefranche-sur-Mer
- The typical guest profile for Airbnb in Villefranche-sur-Mer consists of predominantly international visitors (87%), with top international origins including United Kingdom, typically belonging to the Post-2000s (Gen Z/Alpha) group (50%), primarily speaking English or French.
- Domestic travelers account for 12.9% of guests.
- Key international markets include United States (28.3%) and United Kingdom (18.7%).
- Top languages spoken are English (48.8%) followed by French (16.9%).
- A significant demographic segment is the Post-2000s (Gen Z/Alpha) group, representing 50% of guests.
Recommendations for Hosts
- Focus marketing internationally, particularly towards travelers from United Kingdom.
- Tailor amenities and listing descriptions to appeal to the dominant Post-2000s (Gen Z/Alpha) demographic (e.g., highlight fast WiFi, smart home features, local guides).
- Highlight unique local experiences or amenities relevant to the primary guest profile.
- Consider seasonal promotions aligned with peak travel times for key origin markets.
Nearby Short-Term Rental Market Comparison
How does the Villefranche-sur-Mer Airbnb market stack up against its neighbors? Compare key performance metrics like average monthly revenue, ADR, and occupancy rates in surrounding areas to understand the broader regional STR landscape.
| Market | Active Properties | Monthly Revenue | Daily Rate | Avg. Occupancy |
|---|---|---|---|---|
| Monteu Roero | 16 | $4,432 | $540.14 | 36% |
| Ramatuelle | 213 | $3,891 | $670.10 | 41% |
| Saint-Jean-Cap-Ferrat | 107 | $3,844 | $424.21 | 46% |
| Cossano Belbo | 13 | $3,632 | $284.21 | 42% |
| Saint-Tropez | 742 | $3,498 | $506.57 | 41% |
| Cassinasco | 18 | $3,219 | $545.40 | 41% |
| Èze | 153 | $3,168 | $345.84 | 47% |
| Opio | 40 | $3,057 | $540.62 | 37% |
| Gassin | 384 | $2,939 | $434.44 | 40% |
| Monaco | 184 | $2,817 | $421.75 | 39% |