Vallauris Airbnb Market Analysis 2025: Short Term Rental Data & Vacation Rental Statistics in Provence-Alpes-Côte d'Azur, France
Is Airbnb profitable in Vallauris in 2025? Explore comprehensive Airbnb analytics for Vallauris, Provence-Alpes-Côte d'Azur, France to uncover income potential. This 2025 STR market report for Vallauris, based on AirROI data from April 2024 to March 2025, reveals key trends in the market of 818 active listings.
Whether you're considering an Airbnb investment in Vallauris, optimizing your existing vacation rental, or exploring rental arbitrage opportunities, understanding the Vallauris Airbnb data is crucial. Understanding the local regulations is key to maximizing your short term rental income potential. Let's dive into the specifics.
Key Vallauris Airbnb Performance Metrics Overview
Monthly Airbnb Revenue Variations & Income Potential in Vallauris (2025)
Understanding the monthly revenue variations for Airbnb listings in Vallauris is key to maximizing your short term rental income potential. Seasonality significantly impacts earnings. Our analysis, based on data from the past 12 months, shows that the peak revenue month for STRs in Vallauris is typically August, while January often presents the lowest earnings, highlighting opportunities for strategic pricing adjustments during shoulder and low seasons. Explore the typical Airbnb income in Vallauris across different performance tiers:
- Best-in-class properties (Top 10%) achieve $5,352+ monthly, often utilizing dynamic pricing and superior guest experiences.
- Strong performing properties (Top 25%) earn $2,599 or more, indicating effective management and desirable locations/amenities.
- Typical properties (Median) generate around $1,549 per month, representing the average market performance.
- Entry-level properties (Bottom 25%) see earnings around $787, often with potential for optimization.
Average Monthly Airbnb Earnings Trend in Vallauris
Vallauris Airbnb Occupancy Rate Trends (2025)
Maximize your bookings by understanding the Vallauris STR occupancy trends. Seasonal demand shifts significantly influence how often properties are booked. Typically, Augustsees the highest demand (peak season occupancy), while March experiences the lowest (low season). Effective strategies, like adjusting minimum stays or offering promotions, can boost occupancy during slower periods. Here's how different property tiers perform in Vallauris:
- Best-in-class properties (Top 10%) achieve 76%+ occupancy, indicating high desirability and potentially optimized availability.
- Strong performing properties (Top 25%) maintain 61% or higher occupancy, suggesting good market fit and guest satisfaction.
- Typical properties (Median) have an occupancy rate around 38%.
- Entry-level properties (Bottom 25%) average 18% occupancy, potentially facing higher vacancy.
Average Monthly Occupancy Rate Trend in Vallauris
Average Daily Rate (ADR) Airbnb Trends in Vallauris (2025)
Effective short term rental pricing strategy in Vallauris involves understanding monthly ADR fluctuations. The Average Daily Rate (ADR) for Airbnb in Vallauris typically peaks in August and dips lowest during February. Leveraging Airbnb dynamic pricing tools or strategies based on this seasonality can significantly boost revenue. Here's a look at the typical nightly rates achieved:
- Best-in-class properties (Top 10%) command rates of $538+ per night, often due to premium features or locations.
- Strong performing properties (Top 25%) achieve nightly rates of $179 or more.
- Typical properties (Median) charge around $109 per night.
- Entry-level properties (Bottom 25%) earn around $82 per night.
Average Daily Rate (ADR) Trend by Month in Vallauris
Get Live Vallauris Market Intelligence 👇

Explore Real-time Analytics
Airbnb Seasonality Analysis & Trends in Vallauris (2025)
Peak Season (August, July, June)
- Revenue averages $4,296 per month
- Occupancy rates average 56.2%
- Daily rates average $260
Shoulder Season
- Revenue averages $2,469 per month
- Occupancy maintains around 39.2%
- Daily rates hold near $242
Low Season (January, February, December)
- Revenue drops to average $1,388 per month
- Occupancy decreases to average 27.4%
- Daily rates adjust to average $231
Seasonality Insights for Vallauris
- The Airbnb seasonality in Vallauris shows highly seasonal trends requiring careful strategy. While the sections above show seasonal averages, it's also insightful to look at the extremes:
- During the high season, the absolute peak month showcases Vallauris's highest earning potential, with monthly revenues capable of climbing to $4,597, occupancy reaching a high of 67.3%, and ADRs peaking at $263.
- Conversely, the slowest single month of the year, typically falling within the low season, marks the market's lowest point. In this month, revenue might dip to $1,311, occupancy could drop to 26.1%, and ADRs may adjust down to $229.
- Understanding both the seasonal averages and these monthly peaks and troughs in revenue, occupancy, and ADR is crucial for maximizing your Airbnb profit potential in Vallauris.
Seasonal Strategies for Maximizing Profit
- Peak Season: Maximize revenue through premium pricing and potentially longer minimum stays. Ensure high availability.
- Low Season: Offer competitive pricing, special promotions (e.g., extended stay discounts), and flexible cancellation policies. Target off-season travelers like remote workers or budget-conscious guests.
- Shoulder Seasons: Implement dynamic pricing that balances peak and low rates. Target weekend travelers or specific events. Offer slightly more flexible terms than peak season.
- Regularly analyze your own performance against these Vallauris seasonality benchmarks and adjust your pricing and availability strategy accordingly.
Best Areas for Airbnb Investment in Vallauris (2025)
Exploring the top neighborhoods for short-term rentals in Vallauris? This section highlights key areas, outlining why they are attractive for hosts and guests, along with notable local attractions. Consider these locations based on your target guest profile and investment strategy.
| Neighborhood / Area | Why Host Here? (Target Guests & Appeal) | Key Attractions & Landmarks |
|---|---|---|
| Plage de la Garoupe | A stunning beach area known for its crystal-clear waters and luxurious ambiance. Ideal for vacationers seeking relaxation and sunbathing, plus great dining options nearby. | Garoupe Lighthouse, Private beaches, Water sports activities, Beachfront restaurants, St. Roch Chapel |
| Côte d'Azur | Part of the famous French Riviera, this area attracts affluent travelers looking for charm, culture, and stunning coastal views. A prestigious spot for luxury Airbnb listings. | Juan-les-Pins, Antibes Old Town, Marineland, Picasso Museum, Cap d'Antibes |
| Golfe Juan | A charming seaside town with a picturesque harbor and beautiful beaches. Great for families and those looking for a quieter getaway away from the busier tourist spots. | Golfe-Juan beach, Marina, Local markets, Promenade, Port Camille Rayon |
| Antibes Old Town | Rich in history and vibrant with local life. Ideal for travelers interested in culture, art, and the local French lifestyle, with stunning architecture and colorful street markets. | Fort Carré, Provence market, Picasso Museum, Antibes Museum, Place Nationale |
| Biot | A peaceful village known for its artisan glassblowing and charming old streets. Attracts visitors looking for authentic local experiences and beautiful scenery. | Fernand Léger Museum, Biot Village, Artisan workshops, Marineland nearby |
| Juan-les-Pins | Famous for its summer nightlife and stunning beaches. Appeals to younger crowds and tourists looking for liveliness as well as beach relaxation. | Juan-les-Pins beach, Nightclubs, La Pinède, Jazz festivals, Water sports |
| Sophia Antipolis | A technology park area that attracts business travelers and professionals. Ideal for short-term rentals catering to corporate guests and tech industry visits. | Innovative tech firms, Corporate offices, Business parks, Convention centers |
| Mandelieu-la-Napoule | Known for its beautiful coastline and proximity to golf courses, perfect for vacationers looking for leisure and outdoor activities. | The Château de La Napoule, Beaches, Golf courses, Nature parks, Marina |
Understanding Airbnb License Requirements & STR Laws in Vallauris (2025)
With 19% of listings showing registration in 2025, understanding potential Airbnb license requirements is crucial in Vallauris. Always verify the latest short term rental regulations and Airbnb license requirements directly with local government authorities for Vallauris to ensure full compliance before hosting.
(Source: AirROI data, 2025, based on 19% licensed listings)
Top Performing Airbnb Properties in Vallauris (2025)
Benchmark your potential! Explore examples of top-performing Airbnb properties in Vallaurisbased on Trailing Twelve Month (TTM) revenue. Analyze their characteristics, revenue, occupancy rate, and ADR to understand what drives success in this market.
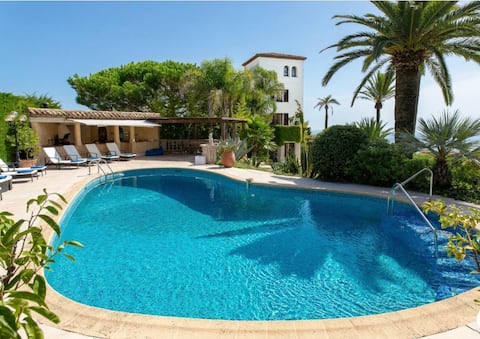
Villa Bastide : Sea view / Hot Tub / Sauna
Entire Place • 6 bedrooms
Le Castel Rose in Super Cannes
Entire Place • 6 bedrooms
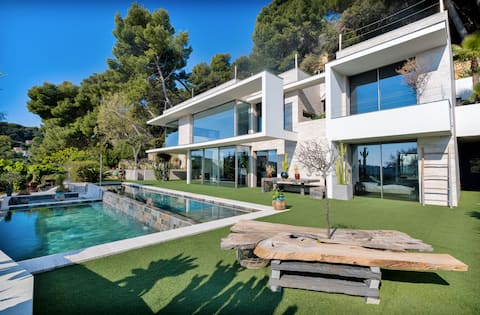
Exceptional contemporary villa - 180° sea view
Entire Place • 5 bedrooms
Villa Californienne Vue Mer
Entire Place • 6 bedrooms
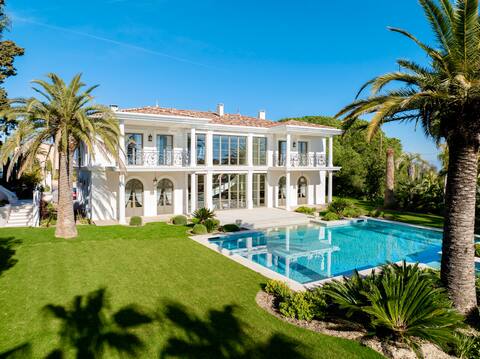
Villa Palace de Lys, Super Cannes
Entire Place • 8 bedrooms
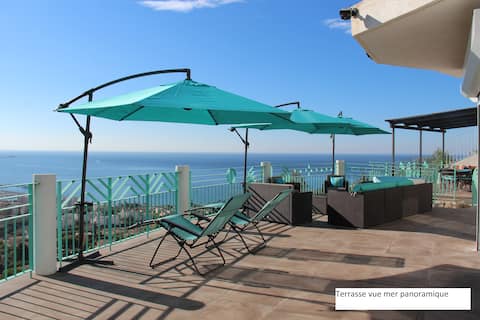
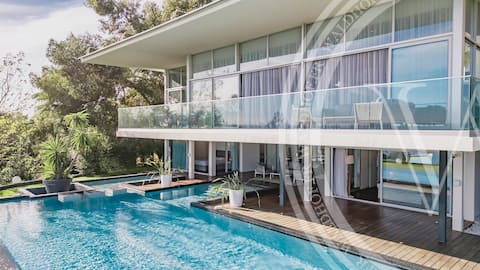
Atypical villa with panoramic sea view
Entire Place • 3 bedrooms
Note: Performance varies based on location, size, amenities, seasonality, and management quality. Data reflects the past 12 months.
Top Performing Airbnb Hosts in Vallauris (2025)
Learn from the best! This table showcases top-performing Airbnb hosts in Vallauris based on the number of properties managed and estimated total revenue over the past year. Analyze their scale and performance metrics.
| Host Name | Properties | Grossing Revenue | Stay Reviews | Avg Rating |
|---|---|---|---|---|
| Claire Et Johan | 3 | $549,738 | 212 | 4.92/5.0 |
| Serrendy | 6 | $320,775 | 51 | 3.90/5.0 |
| Louis | 3 | $294,397 | 51 | 4.93/5.0 |
| Fabienne | 1 | $271,992 | 24 | 4.96/5.0 |
| Edwina | 2 | $239,273 | 42 | 5.00/5.0 |
| Immogroom Agency | 3 | $220,738 | 15 | 4.26/5.0 |
| Chris | 1 | $201,508 | 11 | 5.00/5.0 |
| Host #555452311 | 1 | $162,588 | 0 | 0.00/5.0 |
| Host #33409747 | 1 | $154,024 | 1 | 0.00/5.0 |
| Juliette | 8 | $142,794 | 37 | 3.41/5.0 |
Analyzing the strategies of top hosts, such as their property selection, pricing, and guest communication, can offer valuable lessons for optimizing your own Airbnb operations in Vallauris.
Dive Deeper: Advanced Vallauris STR Market Data (2025)
Ready to unlock more insights? AirROI provides access to advanced metrics and comprehensive Airbnb data for Vallauris. Explore detailed analytics beyond this report to refine your investment strategy, optimize pricing, and maximize your vacation rental profits.
Explore Advanced MetricsVallauris Short-Term Rental Market Composition (2025): Property & Room Types
Room Type Distribution
Property Type Distribution
Market Composition Insights for Vallauris
- The Vallauris Airbnb market composition is heavily skewed towards Entire Home/Apt listings, which make up 97.3% of the 818 active rentals. This indicates strong guest preference for privacy and space.
- Looking at the property type distribution in Vallauris, Apartment/Condo properties are the most common (75.6%), reflecting the local real estate landscape.
- Houses represent a significant 22.4% portion, catering likely to families or larger groups.
- Smaller segments like outdoor/unique, hotel/boutique, others, unique stays (combined 2.0%) offer potential for unique stay experiences.
Vallauris Airbnb Room Capacity Analysis (2025): Bedroom Distribution
Distribution of Listings by Number of Bedrooms
Room Capacity Insights for Vallauris
- The dominant room capacity in Vallauris is 1 bedroom listings, making up 49.9% of the market. This suggests a strong demand for properties suitable for couples or solo travelers.
- Together, 1 bedroom and 2 bedrooms properties represent 67.3% of the active Airbnb listings in Vallauris, indicating a high concentration in these sizes.
Vallauris Vacation Rental Guest Capacity Trends (2025)
Distribution of Listings by Guest Capacity
Guest Capacity Insights for Vallauris
- The most common guest capacity trend in Vallauris vacation rentals is listings accommodating 4 guests (39.4%). This suggests the primary traveler segment is likely small families or groups.
- Properties designed for 4 guests and 2 guests dominate the Vallauris STR market, accounting for 65.0% of listings.
- 21.5% of properties accommodate 6+ guests, serving the market segment for larger families or group travel in Vallauris.
- On average, properties in Vallauris are equipped to host 4.0 guests.
Vallauris Airbnb Booking Patterns (2025): Available vs. Booked Days
Available Days Distribution
Booked Days Distribution
Booking Pattern Insights for Vallauris
- The most common availability pattern in Vallauris falls within the 271-366 days range, representing 52.3% of listings. This suggests many properties have significant open periods on their calendars.
- Approximately 89.6% of listings show high availability (181+ days open annually), indicating potential for increased bookings or specific owner usage patterns.
- For booked days, the 91-180 days range is most frequent in Vallauris (37.9%), reflecting common guest stay durations or potential owner blocking patterns.
- A notable 11.4% of properties secure long booking periods (181+ days booked per year), highlighting successful long-term rental strategies or significant owner usage.
Vallauris Airbnb Minimum Stay Requirements Analysis
Distribution of Listings by Minimum Night Requirement
1 Night
57 listings
7.7% of total
2 Nights
138 listings
18.6% of total
3 Nights
164 listings
22.1% of total
4-6 Nights
233 listings
31.4% of total
7-29 Nights
83 listings
11.2% of total
30+ Nights
67 listings
9% of total
Key Insights
- The most prevalent minimum stay requirement in Vallauris is 4-6 Nights, adopted by 31.4% of listings. This highlights the market's preference for longer commitments.
Recommendations
- Align with the market by considering a 4-6 Nights minimum stay, as 31.4% of Vallauris hosts use this setting.
- If feasible, allowing 1-night stays, especially midweek or during low season, could capture last-minute bookings, as only 7.7% currently do.
- Explore offering discounts for stays of 30+ nights to attract the 9% of the market seeking extended stays.
- Adjust minimum nights based on seasonality – potentially shorter during low season and longer during peak demand periods in Vallauris.
Vallauris Airbnb Cancellation Policy Trends Analysis (2025)
Super Strict 30 Days
8 listings
1.2% of total
Super Strict 60 Days
4 listings
0.6% of total
Flexible
108 listings
16.6% of total
Moderate
167 listings
25.7% of total
Firm
168 listings
25.8% of total
Strict
195 listings
30% of total
Cancellation Policy Insights for Vallauris
- The prevailing Airbnb cancellation policy trend in Vallauris is Strict, used by 30% of listings.
- A majority (55.8%) of hosts in Vallauris utilize Firm or Strict policies, indicating a market where hosts prioritize booking security.
Recommendations for Hosts
- Consider adopting a Strict policy to align with the 30% market standard in Vallauris.
- Regularly review your cancellation policy against competitors and market demand shifts in Vallauris.
Vallauris STR Booking Lead Time Analysis (2025)
Average Booking Lead Time by Month
Booking Lead Time Insights for Vallauris
- The overall average booking lead time for vacation rentals in Vallauris is 54 days.
- Guests book furthest in advance for stays during July (average 89 days), likely coinciding with peak travel demand or local events.
- The shortest booking windows occur for stays in March (average 36 days), indicating more last-minute travel plans during this time.
- Seasonally, Summer (81 days avg.) sees the longest lead times, while Winter (38 days avg.) has the shortest, reflecting typical travel planning cycles.
Recommendations for Hosts
- Use the overall average lead time (54 days) as a baseline for your pricing and availability strategy in Vallauris.
- For July stays, consider implementing length-of-stay discounts or slightly higher rates for bookings made less than 89 days out to capitalize on advance planning.
- Target marketing efforts for the Summer season well in advance (at least 81 days) to capture early planners.
- Monitor your own booking lead times against these Vallauris averages to identify opportunities for dynamic pricing adjustments.
Popular & Essential Airbnb Amenities in Vallauris (2025)
Amenity Prevalence
Amenity Insights for Vallauris
- Essential amenities in Vallauris that guests expect include: Kitchen. Lacking these (this) could significantly impact bookings.
- Popular amenities like Heating, TV, Washer are common but not universal. Offering these can provide a competitive edge.
- Warning: Wifi is not universally provided but is considered essential globally. Ensure reliable Wifi is offered.
Recommendations for Hosts
- Ensure your listing includes all essential amenities for Vallauris: Kitchen.
- Prioritize adding missing essentials: Kitchen.
- Consider adding popular differentiators like Heating or TV to increase appeal.
- Highlight unique or less common amenities you offer (e.g., hot tub, dedicated workspace, EV charger) in your listing description and photos.
- Regularly check competitor amenities in Vallauris to stay competitive.
Vallauris Airbnb Guest Demographics & Profile Analysis (2025)
Guest Profile Summary for Vallauris
- The typical guest profile for Airbnb in Vallauris consists of a mix of domestic (47%) and international guests, with top international origins including Germany, typically belonging to the Post-2000s (Gen Z/Alpha) group (50%), primarily speaking English or French.
- Domestic travelers account for 46.9% of guests.
- Key international markets include France (46.9%) and Germany (9.7%).
- Top languages spoken are English (35.2%) followed by French (25.3%).
- A significant demographic segment is the Post-2000s (Gen Z/Alpha) group, representing 50% of guests.
Recommendations for Hosts
- Balance marketing efforts between domestic and international channels based on the guest mix.
- Tailor amenities and listing descriptions to appeal to the dominant Post-2000s (Gen Z/Alpha) demographic (e.g., highlight fast WiFi, smart home features, local guides).
- Highlight unique local experiences or amenities relevant to the primary guest profile.
- Consider seasonal promotions aligned with peak travel times for key origin markets.
Nearby Short-Term Rental Market Comparison
How does the Vallauris Airbnb market stack up against its neighbors? Compare key performance metrics like average monthly revenue, ADR, and occupancy rates in surrounding areas to understand the broader regional STR landscape.
| Market | Active Properties | Monthly Revenue | Daily Rate | Avg. Occupancy |
|---|---|---|---|---|
| Monteu Roero | 16 | $4,432 | $540.14 | 36% |
| Ramatuelle | 213 | $3,891 | $670.10 | 41% |
| Saint-Jean-Cap-Ferrat | 107 | $3,844 | $424.21 | 46% |
| Cossano Belbo | 13 | $3,632 | $284.21 | 42% |
| Saint-Tropez | 742 | $3,498 | $506.57 | 41% |
| Cassinasco | 18 | $3,219 | $545.40 | 41% |
| Èze | 153 | $3,168 | $345.84 | 47% |
| Opio | 40 | $3,057 | $540.62 | 37% |
| Villefranche-sur-Mer | 501 | $2,977 | $268.57 | 52% |
| Gassin | 384 | $2,939 | $434.44 | 40% |