Le Rouret Airbnb Market Analysis 2025: Short Term Rental Data & Vacation Rental Statistics in Provence-Alpes-Côte d'Azur, France
Is Airbnb profitable in Le Rouret in 2025? Explore comprehensive Airbnb analytics for Le Rouret, Provence-Alpes-Côte d'Azur, France to uncover income potential. This 2025 STR market report for Le Rouret, based on AirROI data from April 2024 to March 2025, reveals key trends in the niche market of 63 active listings.
Whether you're considering an Airbnb investment in Le Rouret, optimizing your existing vacation rental, or exploring rental arbitrage opportunities, understanding the Le Rouret Airbnb data is crucial. Leveraging the low regulation environment is key to maximizing your short term rental income potential. Let's dive into the specifics.
Key Le Rouret Airbnb Performance Metrics Overview
Monthly Airbnb Revenue Variations & Income Potential in Le Rouret (2025)
Understanding the monthly revenue variations for Airbnb listings in Le Rouret is key to maximizing your short term rental income potential. Seasonality significantly impacts earnings. Our analysis, based on data from the past 12 months, shows that the peak revenue month for STRs in Le Rouret is typically August, while February often presents the lowest earnings, highlighting opportunities for strategic pricing adjustments during shoulder and low seasons. Explore the typical Airbnb income in Le Rouret across different performance tiers:
- Best-in-class properties (Top 10%) achieve $6,488+ monthly, often utilizing dynamic pricing and superior guest experiences.
- Strong performing properties (Top 25%) earn $3,733 or more, indicating effective management and desirable locations/amenities.
- Typical properties (Median) generate around $1,970 per month, representing the average market performance.
- Entry-level properties (Bottom 25%) see earnings around $962, often with potential for optimization.
Average Monthly Airbnb Earnings Trend in Le Rouret
Le Rouret Airbnb Occupancy Rate Trends (2025)
Maximize your bookings by understanding the Le Rouret STR occupancy trends. Seasonal demand shifts significantly influence how often properties are booked. Typically, Augustsees the highest demand (peak season occupancy), while January experiences the lowest (low season). Effective strategies, like adjusting minimum stays or offering promotions, can boost occupancy during slower periods. Here's how different property tiers perform in Le Rouret:
- Best-in-class properties (Top 10%) achieve 72%+ occupancy, indicating high desirability and potentially optimized availability.
- Strong performing properties (Top 25%) maintain 58% or higher occupancy, suggesting good market fit and guest satisfaction.
- Typical properties (Median) have an occupancy rate around 37%.
- Entry-level properties (Bottom 25%) average 19% occupancy, potentially facing higher vacancy.
Average Monthly Occupancy Rate Trend in Le Rouret
Average Daily Rate (ADR) Airbnb Trends in Le Rouret (2025)
Effective short term rental pricing strategy in Le Rouret involves understanding monthly ADR fluctuations. The Average Daily Rate (ADR) for Airbnb in Le Rouret typically peaks in July and dips lowest during April. Leveraging Airbnb dynamic pricing tools or strategies based on this seasonality can significantly boost revenue. Here's a look at the typical nightly rates achieved:
- Best-in-class properties (Top 10%) command rates of $654+ per night, often due to premium features or locations.
- Strong performing properties (Top 25%) achieve nightly rates of $436 or more.
- Typical properties (Median) charge around $221 per night.
- Entry-level properties (Bottom 25%) earn around $131 per night.
Average Daily Rate (ADR) Trend by Month in Le Rouret
Get Live Le Rouret Market Intelligence 👇

Explore Real-time Analytics
Airbnb Seasonality Analysis & Trends in Le Rouret (2025)
Peak Season (August, July, September)
- Revenue averages $5,799 per month
- Occupancy rates average 60.0%
- Daily rates average $344
Shoulder Season
- Revenue averages $2,551 per month
- Occupancy maintains around 35.6%
- Daily rates hold near $333
Low Season (February, November, December)
- Revenue drops to average $1,355 per month
- Occupancy decreases to average 25.1%
- Daily rates adjust to average $337
Seasonality Insights for Le Rouret
- The Airbnb seasonality in Le Rouret shows highly seasonal trends requiring careful strategy. While the sections above show seasonal averages, it's also insightful to look at the extremes:
- During the high season, the absolute peak month showcases Le Rouret's highest earning potential, with monthly revenues capable of climbing to $6,889, occupancy reaching a high of 67.9%, and ADRs peaking at $348.
- Conversely, the slowest single month of the year, typically falling within the low season, marks the market's lowest point. In this month, revenue might dip to $1,200, occupancy could drop to 19.2%, and ADRs may adjust down to $323.
- Understanding both the seasonal averages and these monthly peaks and troughs in revenue, occupancy, and ADR is crucial for maximizing your Airbnb profit potential in Le Rouret.
Seasonal Strategies for Maximizing Profit
- Peak Season: Maximize revenue through premium pricing and potentially longer minimum stays. Ensure high availability.
- Low Season: Offer competitive pricing, special promotions (e.g., extended stay discounts), and flexible cancellation policies. Target off-season travelers like remote workers or budget-conscious guests.
- Shoulder Seasons: Implement dynamic pricing that balances peak and low rates. Target weekend travelers or specific events. Offer slightly more flexible terms than peak season.
- Regularly analyze your own performance against these Le Rouret seasonality benchmarks and adjust your pricing and availability strategy accordingly.
Best Areas for Airbnb Investment in Le Rouret (2025)
Exploring the top neighborhoods for short-term rentals in Le Rouret? This section highlights key areas, outlining why they are attractive for hosts and guests, along with notable local attractions. Consider these locations based on your target guest profile and investment strategy.
| Neighborhood / Area | Why Host Here? (Target Guests & Appeal) | Key Attractions & Landmarks |
|---|---|---|
| Le Rouret Village | Charming Provençal village atmosphere with local markets and authentic French culture. Ideal for visitors looking for a peaceful retreat yet close to major attractions. | Local markets, Historic church, Walking trails, Artisanal shops, Café terraces |
| Cote d'Azur | Proximity to the glamorous Cote d'Azur, known for its stunning beaches and luxury lifestyle. A hotspot for tourists wishing to experience the French Riviera. | Nice, Cannes, Antibes, St. Tropez, Beach clubs |
| Grasse | Famous for its perfume industry and scenic landscapes. Perfect for visitors interested in fragrance and history, with beautiful views across the hills. | Perfume factories, Fragonard Museum, Old town, The Cathedral of Grasse, Lavender fields |
| Valbonne | A picturesque and historic village with a vibrant weekend market. Offers a serene environment with a lively atmosphere, perfect for families. | Valbonne market, Historic village center, Café culture, Nearby nature parks, Art galleries |
| Biot | Known for its glass-blowing artisans, Biot offers a unique cultural experience and charming village life, appealing to art and craft lovers. | Biot glass factories, Fernand Léger National Museum, Medieval village, Art exhibitions, Café terraces |
| Mougins | Renowned for its culinary scene and beautiful scenery. Attracts food lovers and art enthusiasts, situated near Cannes. | Mougins Village, Michelin-starred restaurants, Art galleries, Scenic views, Art festivals |
| Sophia Antipolis | The leading tech hub in Europe, Sophia Antipolis attracts business travelers and professionals, ideal for short-term business rentals. | Tech parks, Conference centers, Corporate offices, Cafes, Nearby nature trails |
| Antibes | Famous for its historic old town and beautiful beaches, Antibes is a classic destination for tourists seeking both culture and leisure activities. | Old Town Antibes, Picasso Museum, Antibes beaches, Fort Carré, Marina Port Vauban |
Understanding Airbnb License Requirements & STR Laws in Le Rouret (2025)
While Le Rouret, Provence-Alpes-Côte d'Azur, France currently shows low STR regulations, specific Airbnb license requirements might still exist or change. Always verify the latest short term rental regulations and Airbnb license requirements directly with local government authorities for Le Rouret to ensure full compliance before hosting.
(Source: AirROI data, 2025, based on 8% licensed listings)
Top Performing Airbnb Properties in Le Rouret (2025)
Benchmark your potential! Explore examples of top-performing Airbnb properties in Le Rouretbased on Trailing Twelve Month (TTM) revenue. Analyze their characteristics, revenue, occupancy rate, and ADR to understand what drives success in this market.
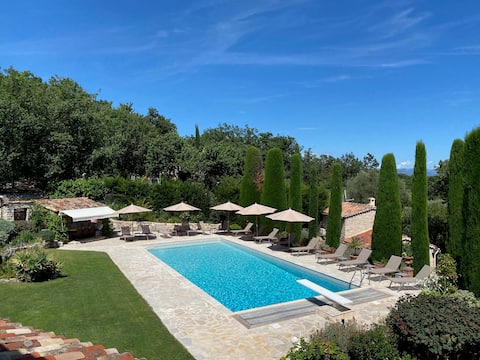
Provençale home, large pool, padel court & seaview
Entire Place • 6 bedrooms
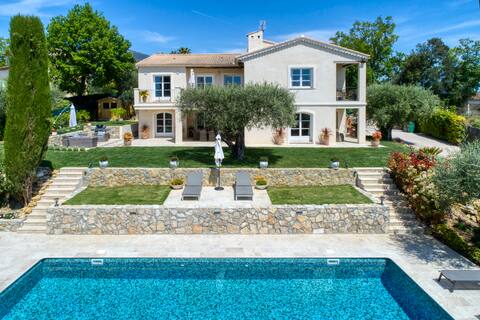
New listing 2024 - Villa Constantin
Entire Place • 6 bedrooms
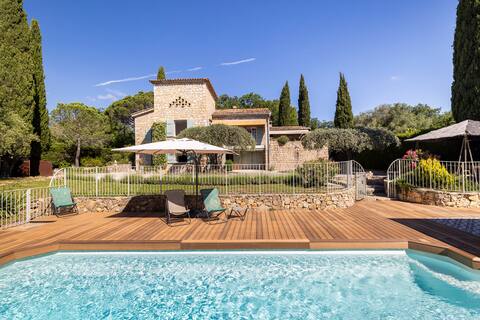
Panoramic view of the French Riviera
Entire Place • 5 bedrooms
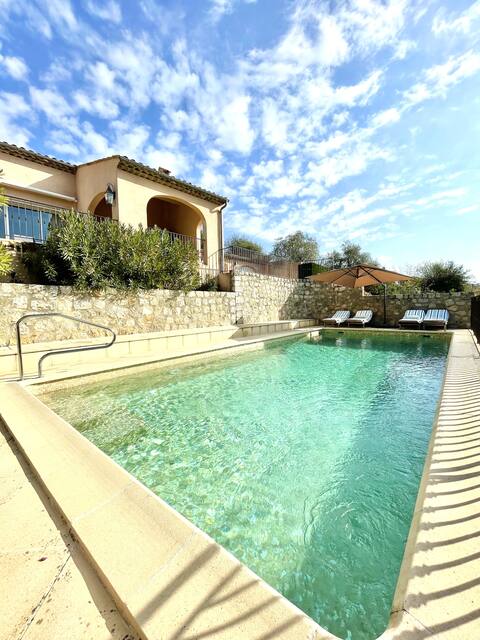
Villa Ciel et Soleil
Entire Place • 4 bedrooms
Villa les Roumingues Private Cottage /
Entire Place • 1 bedroom
The Siesta house
Entire Place • 1 bedroom
Note: Performance varies based on location, size, amenities, seasonality, and management quality. Data reflects the past 12 months.
Top Performing Airbnb Hosts in Le Rouret (2025)
Learn from the best! This table showcases top-performing Airbnb hosts in Le Rouret based on the number of properties managed and estimated total revenue over the past year. Analyze their scale and performance metrics.
| Host Name | Properties | Grossing Revenue | Stay Reviews | Avg Rating |
|---|---|---|---|---|
| Victoria | 1 | $171,085 | 37 | 4.97/5.0 |
| Wendy | 5 | $137,486 | 547 | 3.98/5.0 |
| Host #73581867 | 1 | $96,116 | 1 | 0.00/5.0 |
| Gaëlle | 4 | $93,400 | 139 | 4.83/5.0 |
| Christian | 1 | $68,625 | 20 | 5.00/5.0 |
| April | 1 | $65,343 | 5 | 5.00/5.0 |
| Host #465619764 | 2 | $53,283 | 0 | 0.00/5.0 |
| Alexandra | 1 | $52,104 | 88 | 4.92/5.0 |
| Marion | 1 | $48,582 | 13 | 5.00/5.0 |
| Sylvie | 1 | $48,164 | 15 | 5.00/5.0 |
Analyzing the strategies of top hosts, such as their property selection, pricing, and guest communication, can offer valuable lessons for optimizing your own Airbnb operations in Le Rouret.
Dive Deeper: Advanced Le Rouret STR Market Data (2025)
Ready to unlock more insights? AirROI provides access to advanced metrics and comprehensive Airbnb data for Le Rouret. Explore detailed analytics beyond this report to refine your investment strategy, optimize pricing, and maximize your vacation rental profits.
Explore Advanced MetricsLe Rouret Short-Term Rental Market Composition (2025): Property & Room Types
Room Type Distribution
Property Type Distribution
Market Composition Insights for Le Rouret
- The Le Rouret Airbnb market composition is heavily skewed towards Entire Home/Apt listings, which make up 87.3% of the 63 active rentals. This indicates strong guest preference for privacy and space.
- Looking at the property type distribution in Le Rouret, House properties are the most common (66.7%), reflecting the local real estate landscape.
- Houses represent a significant 66.7% portion, catering likely to families or larger groups.
- The presence of 7.9% Hotel/Boutique listings indicates integration with traditional hospitality.
- Smaller segments like others (combined 1.6%) offer potential for unique stay experiences.
Le Rouret Airbnb Room Capacity Analysis (2025): Bedroom Distribution
Distribution of Listings by Number of Bedrooms
Room Capacity Insights for Le Rouret
- The dominant room capacity in Le Rouret is 1 bedroom listings, making up 23.8% of the market. This suggests a strong demand for properties suitable for couples or solo travelers.
- Together, 1 bedroom and 4 bedrooms properties represent 44.4% of the active Airbnb listings in Le Rouret, indicating a high concentration in these sizes.
- A significant 47.6% of listings offer 3+ bedrooms, catering to larger groups and families seeking more space in Le Rouret.
Le Rouret Vacation Rental Guest Capacity Trends (2025)
Distribution of Listings by Guest Capacity
Guest Capacity Insights for Le Rouret
- The most common guest capacity trend in Le Rouret vacation rentals is listings accommodating 8+ guests (30.2%). This suggests the primary traveler segment is likely larger groups.
- Properties designed for 8+ guests and 4 guests dominate the Le Rouret STR market, accounting for 52.4% of listings.
- 50.9% of properties accommodate 6+ guests, serving the market segment for larger families or group travel in Le Rouret.
- On average, properties in Le Rouret are equipped to host 5.0 guests.
Le Rouret Airbnb Booking Patterns (2025): Available vs. Booked Days
Available Days Distribution
Booked Days Distribution
Booking Pattern Insights for Le Rouret
- The most common availability pattern in Le Rouret falls within the 271-366 days range, representing 50.8% of listings. This suggests many properties have significant open periods on their calendars.
- Approximately 85.7% of listings show high availability (181+ days open annually), indicating potential for increased bookings or specific owner usage patterns.
- For booked days, the 31-90 days range is most frequent in Le Rouret (33.3%), reflecting common guest stay durations or potential owner blocking patterns.
- A notable 15.9% of properties secure long booking periods (181+ days booked per year), highlighting successful long-term rental strategies or significant owner usage.
Le Rouret Airbnb Minimum Stay Requirements Analysis
Distribution of Listings by Minimum Night Requirement
1 Night
9 listings
15% of total
2 Nights
5 listings
8.3% of total
3 Nights
16 listings
26.7% of total
4-6 Nights
12 listings
20% of total
7-29 Nights
14 listings
23.3% of total
30+ Nights
4 listings
6.7% of total
Key Insights
- The most prevalent minimum stay requirement in Le Rouret is 3 Nights, adopted by 26.7% of listings. This highlights the market's preference for longer commitments.
Recommendations
- Align with the market by considering a 3 Nights minimum stay, as 26.7% of Le Rouret hosts use this setting.
- If feasible, allowing 1-night stays, especially midweek or during low season, could capture last-minute bookings, as only 15% currently do.
- Explore offering discounts for stays of 30+ nights to attract the 6.7% of the market seeking extended stays.
- Adjust minimum nights based on seasonality – potentially shorter during low season and longer during peak demand periods in Le Rouret.
Le Rouret Airbnb Cancellation Policy Trends Analysis (2025)
Flexible
3 listings
6.1% of total
Moderate
22 listings
44.9% of total
Firm
8 listings
16.3% of total
Strict
16 listings
32.7% of total
Cancellation Policy Insights for Le Rouret
- The prevailing Airbnb cancellation policy trend in Le Rouret is Moderate, used by 44.9% of listings.
- There's a relatively balanced mix between guest-friendly (51.0%) and stricter (49.0%) policies, offering choices for different guest needs.
Recommendations for Hosts
- Consider adopting a Moderate policy to align with the 44.9% market standard in Le Rouret.
- With 32.7% using Strict terms, this is a viable option in Le Rouret, particularly for high-value properties or during peak demand periods.
- Regularly review your cancellation policy against competitors and market demand shifts in Le Rouret.
Le Rouret STR Booking Lead Time Analysis (2025)
Average Booking Lead Time by Month
Booking Lead Time Insights for Le Rouret
- The overall average booking lead time for vacation rentals in Le Rouret is 52 days.
- Guests book furthest in advance for stays during July (average 105 days), likely coinciding with peak travel demand or local events.
- The shortest booking windows occur for stays in February (average 22 days), indicating more last-minute travel plans during this time.
- Seasonally, Summer (94 days avg.) sees the longest lead times, while Winter (33 days avg.) has the shortest, reflecting typical travel planning cycles.
Recommendations for Hosts
- Use the overall average lead time (52 days) as a baseline for your pricing and availability strategy in Le Rouret.
- For July stays, consider implementing length-of-stay discounts or slightly higher rates for bookings made less than 105 days out to capitalize on advance planning.
- Target marketing efforts for the Summer season well in advance (at least 94 days) to capture early planners.
- Monitor your own booking lead times against these Le Rouret averages to identify opportunities for dynamic pricing adjustments.
Popular & Essential Airbnb Amenities in Le Rouret (2025)
Amenity Prevalence
Amenity Insights for Le Rouret
- Essential amenities in Le Rouret that guests expect include: Heating, Free parking on premises, Hot water, Essentials, Wifi. Lacking these (any) could significantly impact bookings.
- Popular amenities like TV, Kitchen, Hair dryer are common but not universal. Offering these can provide a competitive edge.
Recommendations for Hosts
- Ensure your listing includes all essential amenities for Le Rouret: Heating, Free parking on premises, Hot water, Essentials, Wifi.
- Prioritize adding missing essentials: Free parking on premises, Hot water, Essentials, Wifi.
- Consider adding popular differentiators like TV or Kitchen to increase appeal.
- Highlight unique or less common amenities you offer (e.g., hot tub, dedicated workspace, EV charger) in your listing description and photos.
- Regularly check competitor amenities in Le Rouret to stay competitive.
Le Rouret Airbnb Guest Demographics & Profile Analysis (2025)
Guest Profile Summary for Le Rouret
- The typical guest profile for Airbnb in Le Rouret consists of a mix of domestic (41%) and international guests, with top international origins including United Kingdom, typically belonging to the Post-2000s (Gen Z/Alpha) group (50%), primarily speaking English or French.
- Domestic travelers account for 41.2% of guests.
- Key international markets include France (41.2%) and United Kingdom (13.6%).
- Top languages spoken are English (39.3%) followed by French (21.4%).
- A significant demographic segment is the Post-2000s (Gen Z/Alpha) group, representing 50% of guests.
Recommendations for Hosts
- Balance marketing efforts between domestic and international channels based on the guest mix.
- Tailor amenities and listing descriptions to appeal to the dominant Post-2000s (Gen Z/Alpha) demographic (e.g., highlight fast WiFi, smart home features, local guides).
- Highlight unique local experiences or amenities relevant to the primary guest profile.
- Consider seasonal promotions aligned with peak travel times for key origin markets.
Nearby Short-Term Rental Market Comparison
How does the Le Rouret Airbnb market stack up against its neighbors? Compare key performance metrics like average monthly revenue, ADR, and occupancy rates in surrounding areas to understand the broader regional STR landscape.
| Market | Active Properties | Monthly Revenue | Daily Rate | Avg. Occupancy |
|---|---|---|---|---|
| Monteu Roero | 16 | $4,432 | $540.14 | 36% |
| Ramatuelle | 213 | $3,891 | $670.10 | 41% |
| Saint-Jean-Cap-Ferrat | 107 | $3,844 | $424.21 | 46% |
| Cossano Belbo | 13 | $3,632 | $284.21 | 42% |
| Saint-Tropez | 742 | $3,498 | $506.57 | 41% |
| Cassinasco | 18 | $3,219 | $545.40 | 41% |
| Èze | 153 | $3,168 | $345.84 | 47% |
| Opio | 40 | $3,057 | $540.62 | 37% |
| Villefranche-sur-Mer | 501 | $2,977 | $268.57 | 52% |
| Gassin | 384 | $2,939 | $434.44 | 40% |