Lagnes Airbnb Market Analysis 2025: Short Term Rental Data & Vacation Rental Statistics in Provence-Alpes-Côte d'Azur, France
Is Airbnb profitable in Lagnes in 2025? Explore comprehensive Airbnb analytics for Lagnes, Provence-Alpes-Côte d'Azur, France to uncover income potential. This 2025 STR market report for Lagnes, based on AirROI data from April 2024 to March 2025, reveals key trends in the niche market of 64 active listings.
Whether you're considering an Airbnb investment in Lagnes, optimizing your existing vacation rental, or exploring rental arbitrage opportunities, understanding the Lagnes Airbnb data is crucial. Understanding the local regulations is key to maximizing your short term rental income potential. Let's dive into the specifics.
Key Lagnes Airbnb Performance Metrics Overview
Monthly Airbnb Revenue Variations & Income Potential in Lagnes (2025)
Understanding the monthly revenue variations for Airbnb listings in Lagnes is key to maximizing your short term rental income potential. Seasonality significantly impacts earnings. Our analysis, based on data from the past 12 months, shows that the peak revenue month for STRs in Lagnes is typically August, while February often presents the lowest earnings, highlighting opportunities for strategic pricing adjustments during shoulder and low seasons. Explore the typical Airbnb income in Lagnes across different performance tiers:
- Best-in-class properties (Top 10%) achieve $5,371+ monthly, often utilizing dynamic pricing and superior guest experiences.
- Strong performing properties (Top 25%) earn $3,479 or more, indicating effective management and desirable locations/amenities.
- Typical properties (Median) generate around $1,805 per month, representing the average market performance.
- Entry-level properties (Bottom 25%) see earnings around $858, often with potential for optimization.
Average Monthly Airbnb Earnings Trend in Lagnes
Lagnes Airbnb Occupancy Rate Trends (2025)
Maximize your bookings by understanding the Lagnes STR occupancy trends. Seasonal demand shifts significantly influence how often properties are booked. Typically, Augustsees the highest demand (peak season occupancy), while February experiences the lowest (low season). Effective strategies, like adjusting minimum stays or offering promotions, can boost occupancy during slower periods. Here's how different property tiers perform in Lagnes:
- Best-in-class properties (Top 10%) achieve 74%+ occupancy, indicating high desirability and potentially optimized availability.
- Strong performing properties (Top 25%) maintain 55% or higher occupancy, suggesting good market fit and guest satisfaction.
- Typical properties (Median) have an occupancy rate around 32%.
- Entry-level properties (Bottom 25%) average 15% occupancy, potentially facing higher vacancy.
Average Monthly Occupancy Rate Trend in Lagnes
Average Daily Rate (ADR) Airbnb Trends in Lagnes (2025)
Effective short term rental pricing strategy in Lagnes involves understanding monthly ADR fluctuations. The Average Daily Rate (ADR) for Airbnb in Lagnes typically peaks in August and dips lowest during March. Leveraging Airbnb dynamic pricing tools or strategies based on this seasonality can significantly boost revenue. Here's a look at the typical nightly rates achieved:
- Best-in-class properties (Top 10%) command rates of $470+ per night, often due to premium features or locations.
- Strong performing properties (Top 25%) achieve nightly rates of $296 or more.
- Typical properties (Median) charge around $168 per night.
- Entry-level properties (Bottom 25%) earn around $117 per night.
Average Daily Rate (ADR) Trend by Month in Lagnes
Get Live Lagnes Market Intelligence 👇

Explore Real-time Analytics
Airbnb Seasonality Analysis & Trends in Lagnes (2025)
Peak Season (August, July, May)
- Revenue averages $4,253 per month
- Occupancy rates average 50.7%
- Daily rates average $239
Shoulder Season
- Revenue averages $2,496 per month
- Occupancy maintains around 38.2%
- Daily rates hold near $223
Low Season (February, March, December)
- Revenue drops to average $932 per month
- Occupancy decreases to average 19.9%
- Daily rates adjust to average $211
Seasonality Insights for Lagnes
- The Airbnb seasonality in Lagnes shows highly seasonal trends requiring careful strategy. While the sections above show seasonal averages, it's also insightful to look at the extremes:
- During the high season, the absolute peak month showcases Lagnes's highest earning potential, with monthly revenues capable of climbing to $4,585, occupancy reaching a high of 56.9%, and ADRs peaking at $245.
- Conversely, the slowest single month of the year, typically falling within the low season, marks the market's lowest point. In this month, revenue might dip to $802, occupancy could drop to 15.4%, and ADRs may adjust down to $209.
- Understanding both the seasonal averages and these monthly peaks and troughs in revenue, occupancy, and ADR is crucial for maximizing your Airbnb profit potential in Lagnes.
Seasonal Strategies for Maximizing Profit
- Peak Season: Maximize revenue through premium pricing and potentially longer minimum stays. Ensure high availability.
- Low Season: Offer competitive pricing, special promotions (e.g., extended stay discounts), and flexible cancellation policies. Target off-season travelers like remote workers or budget-conscious guests.
- Shoulder Seasons: Implement dynamic pricing that balances peak and low rates. Target weekend travelers or specific events. Offer slightly more flexible terms than peak season.
- Regularly analyze your own performance against these Lagnes seasonality benchmarks and adjust your pricing and availability strategy accordingly.
Best Areas for Airbnb Investment in Lagnes (2025)
Exploring the top neighborhoods for short-term rentals in Lagnes? This section highlights key areas, outlining why they are attractive for hosts and guests, along with notable local attractions. Consider these locations based on your target guest profile and investment strategy.
| Neighborhood / Area | Why Host Here? (Target Guests & Appeal) | Key Attractions & Landmarks |
|---|---|---|
| Lagnes Village | Charming village atmosphere with traditional Provençal architecture. Ideal for guests looking to experience authentic rural life in France, with local markets and friendly communities. | Lagne Plateau, Local vineyards, Weekly market, Provencal cuisine restaurants, Cultural festivals |
| Gordes | One of the most beautiful villages in France, known for its stunning views and historical stone buildings. Popular among tourists seeking picturesque landscapes and luxury stays. | Gordes Castle, Village des Bories, Senanque Abbey, Lavender fields, Local art galleries |
| Roussillon | Famous for its ochre cliffs and vibrant colors, Roussillon attracts visitors who appreciate nature and art. Many activities related to hiking and artistic exploration. | Ochre Trail, Roussillon Ochre Conservatory, Art galleries, Café terraces with views, Colorful streets and architecture |
| Luberon National Park | A stunning natural park with rich biodiversity and beautiful landscapes. Ideal for outdoorsy guests who love hiking and exploring nature. | Hiking trails, Scenic viewpoints, Wildflowers in spring, Local flora and fauna, Provencal markets nearby |
| Avignon | Historical city known for the Palais des Papes and its annual theater festival. A cultural hub that attracts tourists interested in history and the arts. | Palais des Papes, Pont Saint-Bénézet, Avignon Festival, Local cuisine, Museums and galleries |
| Isle-sur-la-Sorgue | Known for its antique shops and floating market. Great for travelers who love vintage finds and waterfront scenery. | Antique markets, Sorgue River, Canal walks, Local restaurants, Entertainment during festivals |
| Cavaillon | A town that combines historical sites and access to the natural beauty of the Vaucluse region. It serves as a gateway to various attractions in Provence. | Cavaillon Cathedral, Local farmland, Markets, Nearby Luberon attractions, Provençal food experiences |
| Menerbes | A small village with stunning views of the vineyards and a rich history. Popular among tourists seeking tranquillity and scenic beauty. | Menerbes Village, Wine tasting tours, Vineyards, Art galleries, Gorgeous landscapes |
Understanding Airbnb License Requirements & STR Laws in Lagnes (2025)
With 16% of listings showing registration in 2025, understanding potential Airbnb license requirements is crucial in Lagnes. Always verify the latest short term rental regulations and Airbnb license requirements directly with local government authorities for Lagnes to ensure full compliance before hosting.
(Source: AirROI data, 2025, based on 16% licensed listings)
Top Performing Airbnb Properties in Lagnes (2025)
Benchmark your potential! Explore examples of top-performing Airbnb properties in Lagnesbased on Trailing Twelve Month (TTM) revenue. Analyze their characteristics, revenue, occupancy rate, and ADR to understand what drives success in this market.
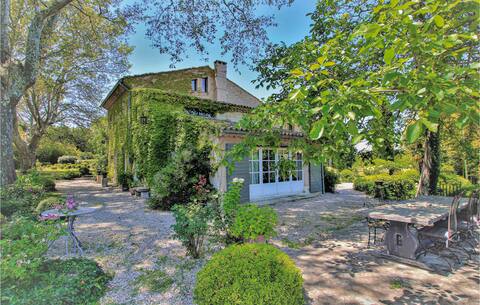
4 bedroom stunning home in Lagnes
Entire Place • 4 bedrooms

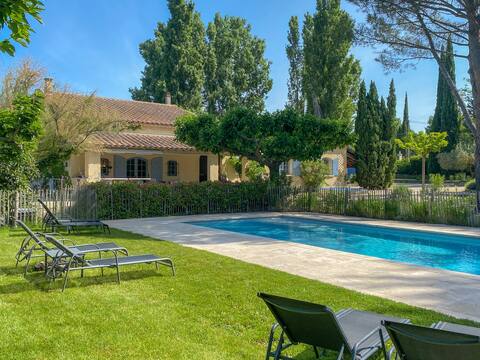
Exceptional Mas in Lagnes, Provence
Entire Place • 5 bedrooms
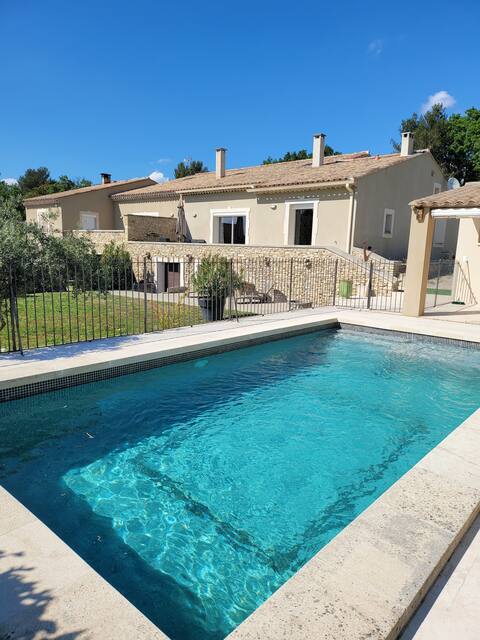
Perfect families Fenced heat pool Big garden 15 p.
Entire Place • 6 bedrooms
Gîte Lagnes, Luberon, Vaucluse 8 people
Entire Place • 4 bedrooms
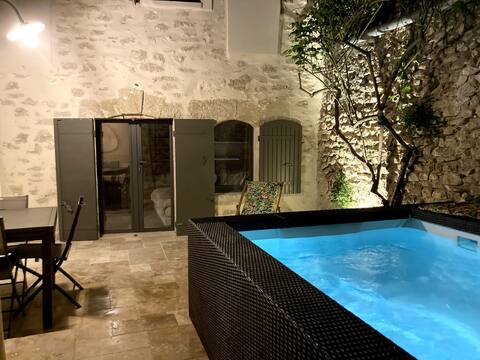
Cosy village house, secret patio, pool
Entire Place • 2 bedrooms
Villa Lia with pool
Entire Place • 3 bedrooms
Note: Performance varies based on location, size, amenities, seasonality, and management quality. Data reflects the past 12 months.
Top Performing Airbnb Hosts in Lagnes (2025)
Learn from the best! This table showcases top-performing Airbnb hosts in Lagnes based on the number of properties managed and estimated total revenue over the past year. Analyze their scale and performance metrics.
| Host Name | Properties | Grossing Revenue | Stay Reviews | Avg Rating |
|---|---|---|---|---|
| Novasol | 1 | $112,624 | 10 | 5.00/5.0 |
| Vincent | 2 | $92,917 | 49 | 4.96/5.0 |
| Julie | 1 | $64,765 | 17 | 4.82/5.0 |
| Muriel | 1 | $64,638 | 16 | 4.75/5.0 |
| Camus | 1 | $62,412 | 8 | 5.00/5.0 |
| Roman | 2 | $59,487 | 20 | 4.80/5.0 |
| Marine | 6 | $56,783 | 15 | 1.64/5.0 |
| Caroline | 2 | $50,566 | 144 | 4.77/5.0 |
| Isabelle | 1 | $43,973 | 86 | 4.97/5.0 |
| Amy | 1 | $40,393 | 89 | 4.65/5.0 |
Analyzing the strategies of top hosts, such as their property selection, pricing, and guest communication, can offer valuable lessons for optimizing your own Airbnb operations in Lagnes.
Dive Deeper: Advanced Lagnes STR Market Data (2025)
Ready to unlock more insights? AirROI provides access to advanced metrics and comprehensive Airbnb data for Lagnes. Explore detailed analytics beyond this report to refine your investment strategy, optimize pricing, and maximize your vacation rental profits.
Explore Advanced MetricsLagnes Short-Term Rental Market Composition (2025): Property & Room Types
Room Type Distribution
Property Type Distribution
Market Composition Insights for Lagnes
- The Lagnes Airbnb market composition is heavily skewed towards Entire Home/Apt listings, which make up 90.6% of the 64 active rentals. This indicates strong guest preference for privacy and space.
- Looking at the property type distribution in Lagnes, House properties are the most common (73.4%), reflecting the local real estate landscape.
- Houses represent a significant 73.4% portion, catering likely to families or larger groups.
- The presence of 9.4% Hotel/Boutique listings indicates integration with traditional hospitality.
- Smaller segments like others, outdoor/unique (combined 3.2%) offer potential for unique stay experiences.
Lagnes Airbnb Room Capacity Analysis (2025): Bedroom Distribution
Distribution of Listings by Number of Bedrooms
Room Capacity Insights for Lagnes
- The dominant room capacity in Lagnes is 1 bedroom listings, making up 43.8% of the market. This suggests a strong demand for properties suitable for couples or solo travelers.
- Together, 1 bedroom and 2 bedrooms properties represent 59.4% of the active Airbnb listings in Lagnes, indicating a high concentration in these sizes.
- A significant 37.5% of listings offer 3+ bedrooms, catering to larger groups and families seeking more space in Lagnes.
Lagnes Vacation Rental Guest Capacity Trends (2025)
Distribution of Listings by Guest Capacity
Guest Capacity Insights for Lagnes
- The most common guest capacity trend in Lagnes vacation rentals is listings accommodating 4 guests (28.1%). This suggests the primary traveler segment is likely small families or groups.
- Properties designed for 4 guests and 8+ guests dominate the Lagnes STR market, accounting for 51.5% of listings.
- 39.1% of properties accommodate 6+ guests, serving the market segment for larger families or group travel in Lagnes.
- On average, properties in Lagnes are equipped to host 4.7 guests.
Lagnes Airbnb Booking Patterns (2025): Available vs. Booked Days
Available Days Distribution
Booked Days Distribution
Booking Pattern Insights for Lagnes
- The most common availability pattern in Lagnes falls within the 271-366 days range, representing 56.3% of listings. This suggests many properties have significant open periods on their calendars.
- Approximately 90.7% of listings show high availability (181+ days open annually), indicating potential for increased bookings or specific owner usage patterns.
- For booked days, the 91-180 days range is most frequent in Lagnes (34.4%), reflecting common guest stay durations or potential owner blocking patterns.
- A notable 12.5% of properties secure long booking periods (181+ days booked per year), highlighting successful long-term rental strategies or significant owner usage.
Lagnes Airbnb Minimum Stay Requirements Analysis
Distribution of Listings by Minimum Night Requirement
1 Night
15 listings
26.3% of total
2 Nights
4 listings
7% of total
3 Nights
8 listings
14% of total
4-6 Nights
11 listings
19.3% of total
7-29 Nights
10 listings
17.5% of total
30+ Nights
9 listings
15.8% of total
Key Insights
- The most prevalent minimum stay requirement in Lagnes is 1 Night, adopted by 26.3% of listings. This highlights the market's preference for shorter, flexible bookings.
- A significant segment (15.8%) caters to monthly stays (30+ nights) in Lagnes, pointing to opportunities in the extended-stay market.
Recommendations
- Align with the market by considering a 1 Night minimum stay, as 26.3% of Lagnes hosts use this setting.
- If feasible, allowing 1-night stays, especially midweek or during low season, could capture last-minute bookings, as only 26.3% currently do.
- Explore offering discounts for stays of 30+ nights to attract the 15.8% of the market seeking extended stays.
- Adjust minimum nights based on seasonality – potentially shorter during low season and longer during peak demand periods in Lagnes.
Lagnes Airbnb Cancellation Policy Trends Analysis (2025)
Refundable
2 listings
4.1% of total
Super Strict 60 Days
1 listings
2% of total
Flexible
2 listings
4.1% of total
Moderate
13 listings
26.5% of total
Firm
18 listings
36.7% of total
Strict
13 listings
26.5% of total
Cancellation Policy Insights for Lagnes
- The prevailing Airbnb cancellation policy trend in Lagnes is Firm, used by 36.7% of listings.
- A majority (63.2%) of hosts in Lagnes utilize Firm or Strict policies, indicating a market where hosts prioritize booking security.
Recommendations for Hosts
- Consider adopting a Firm policy to align with the 36.7% market standard in Lagnes.
- Regularly review your cancellation policy against competitors and market demand shifts in Lagnes.
Lagnes STR Booking Lead Time Analysis (2025)
Average Booking Lead Time by Month
Booking Lead Time Insights for Lagnes
- The overall average booking lead time for vacation rentals in Lagnes is 64 days.
- Guests book furthest in advance for stays during May (average 113 days), likely coinciding with peak travel demand or local events.
- The shortest booking windows occur for stays in February (average 19 days), indicating more last-minute travel plans during this time.
- Seasonally, Summer (98 days avg.) sees the longest lead times, while Winter (35 days avg.) has the shortest, reflecting typical travel planning cycles.
Recommendations for Hosts
- Use the overall average lead time (64 days) as a baseline for your pricing and availability strategy in Lagnes.
- For May stays, consider implementing length-of-stay discounts or slightly higher rates for bookings made less than 113 days out to capitalize on advance planning.
- Target marketing efforts for the Summer season well in advance (at least 98 days) to capture early planners.
- Monitor your own booking lead times against these Lagnes averages to identify opportunities for dynamic pricing adjustments.
Popular & Essential Airbnb Amenities in Lagnes (2025)
Amenity Prevalence
Amenity Insights for Lagnes
- Essential amenities in Lagnes that guests expect include: Free parking on premises, Heating. Lacking these (any) could significantly impact bookings.
- Popular amenities like Wifi, Kitchen, TV are common but not universal. Offering these can provide a competitive edge.
- Warning: Wifi is not universally provided but is considered essential globally. Ensure reliable Wifi is offered.
Recommendations for Hosts
- Ensure your listing includes all essential amenities for Lagnes: Free parking on premises, Heating.
- Prioritize adding missing essentials: Free parking on premises, Heating.
- Consider adding popular differentiators like Wifi or Kitchen to increase appeal.
- Highlight unique or less common amenities you offer (e.g., hot tub, dedicated workspace, EV charger) in your listing description and photos.
- Regularly check competitor amenities in Lagnes to stay competitive.
Lagnes Airbnb Guest Demographics & Profile Analysis (2025)
Guest Profile Summary for Lagnes
- The typical guest profile for Airbnb in Lagnes consists of a mix of domestic (55%) and international guests, often arriving from nearby Paris, typically belonging to the Post-2000s (Gen Z/Alpha) group (50%), primarily speaking English or French.
- Domestic travelers account for 54.9% of guests.
- Key international markets include France (54.9%) and Germany (8.7%).
- Top languages spoken are English (35.6%) followed by French (34.9%).
- A significant demographic segment is the Post-2000s (Gen Z/Alpha) group, representing 50% of guests.
Recommendations for Hosts
- Balance marketing efforts between domestic and international channels based on the guest mix.
- Tailor amenities and listing descriptions to appeal to the dominant Post-2000s (Gen Z/Alpha) demographic (e.g., highlight fast WiFi, smart home features, local guides).
- Highlight unique local experiences or amenities relevant to the primary guest profile.
- Consider seasonal promotions aligned with peak travel times for key origin markets.
Nearby Short-Term Rental Market Comparison
How does the Lagnes Airbnb market stack up against its neighbors? Compare key performance metrics like average monthly revenue, ADR, and occupancy rates in surrounding areas to understand the broader regional STR landscape.
| Market | Active Properties | Monthly Revenue | Daily Rate | Avg. Occupancy |
|---|---|---|---|---|
| Divajeu | 19 | $3,941 | $410.65 | 42% |
| Ramatuelle | 213 | $3,891 | $670.10 | 41% |
| Saint-Tropez | 742 | $3,498 | $506.57 | 41% |
| Chantepérier | 20 | $3,057 | $281.60 | 37% |
| Opio | 40 | $3,057 | $540.62 | 37% |
| Gassin | 384 | $2,939 | $434.44 | 40% |
| Gordes | 225 | $2,913 | $366.32 | 43% |
| Redessan | 19 | $2,834 | $334.82 | 34% |
| Fontarèches | 11 | $2,802 | $525.31 | 34% |
| Ménerbes | 97 | $2,800 | $453.86 | 41% |