Bouc-Bel-Air Airbnb Market Analysis 2025: Short Term Rental Data & Vacation Rental Statistics in Provence-Alpes-Côte d'Azur, France
Is Airbnb profitable in Bouc-Bel-Air in 2025? Explore comprehensive Airbnb analytics for Bouc-Bel-Air, Provence-Alpes-Côte d'Azur, France to uncover income potential. This 2025 STR market report for Bouc-Bel-Air, based on AirROI data from April 2024 to March 2025, reveals key trends in the niche market of 113 active listings.
Whether you're considering an Airbnb investment in Bouc-Bel-Air, optimizing your existing vacation rental, or exploring rental arbitrage opportunities, understanding the Bouc-Bel-Air Airbnb data is crucial. Leveraging the low regulation environment is key to maximizing your short term rental income potential. Let's dive into the specifics.
Key Bouc-Bel-Air Airbnb Performance Metrics Overview
Monthly Airbnb Revenue Variations & Income Potential in Bouc-Bel-Air (2025)
Understanding the monthly revenue variations for Airbnb listings in Bouc-Bel-Air is key to maximizing your short term rental income potential. Seasonality significantly impacts earnings. Our analysis, based on data from the past 12 months, shows that the peak revenue month for STRs in Bouc-Bel-Air is typically July, while January often presents the lowest earnings, highlighting opportunities for strategic pricing adjustments during shoulder and low seasons. Explore the typical Airbnb income in Bouc-Bel-Air across different performance tiers:
- Best-in-class properties (Top 10%) achieve $5,010+ monthly, often utilizing dynamic pricing and superior guest experiences.
- Strong performing properties (Top 25%) earn $2,669 or more, indicating effective management and desirable locations/amenities.
- Typical properties (Median) generate around $1,323 per month, representing the average market performance.
- Entry-level properties (Bottom 25%) see earnings around $696, often with potential for optimization.
Average Monthly Airbnb Earnings Trend in Bouc-Bel-Air
Bouc-Bel-Air Airbnb Occupancy Rate Trends (2025)
Maximize your bookings by understanding the Bouc-Bel-Air STR occupancy trends. Seasonal demand shifts significantly influence how often properties are booked. Typically, Augustsees the highest demand (peak season occupancy), while March experiences the lowest (low season). Effective strategies, like adjusting minimum stays or offering promotions, can boost occupancy during slower periods. Here's how different property tiers perform in Bouc-Bel-Air:
- Best-in-class properties (Top 10%) achieve 83%+ occupancy, indicating high desirability and potentially optimized availability.
- Strong performing properties (Top 25%) maintain 65% or higher occupancy, suggesting good market fit and guest satisfaction.
- Typical properties (Median) have an occupancy rate around 39%.
- Entry-level properties (Bottom 25%) average 19% occupancy, potentially facing higher vacancy.
Average Monthly Occupancy Rate Trend in Bouc-Bel-Air
Average Daily Rate (ADR) Airbnb Trends in Bouc-Bel-Air (2025)
Effective short term rental pricing strategy in Bouc-Bel-Air involves understanding monthly ADR fluctuations. The Average Daily Rate (ADR) for Airbnb in Bouc-Bel-Air typically peaks in July and dips lowest during December. Leveraging Airbnb dynamic pricing tools or strategies based on this seasonality can significantly boost revenue. Here's a look at the typical nightly rates achieved:
- Best-in-class properties (Top 10%) command rates of $434+ per night, often due to premium features or locations.
- Strong performing properties (Top 25%) achieve nightly rates of $287 or more.
- Typical properties (Median) charge around $143 per night.
- Entry-level properties (Bottom 25%) earn around $69 per night.
Average Daily Rate (ADR) Trend by Month in Bouc-Bel-Air
Get Live Bouc-Bel-Air Market Intelligence 👇

Explore Real-time Analytics
Airbnb Seasonality Analysis & Trends in Bouc-Bel-Air (2025)
Peak Season (July, August, September)
- Revenue averages $3,567 per month
- Occupancy rates average 54.4%
- Daily rates average $218
Shoulder Season
- Revenue averages $2,035 per month
- Occupancy maintains around 41.1%
- Daily rates hold near $212
Low Season (January, February, March)
- Revenue drops to average $996 per month
- Occupancy decreases to average 36.4%
- Daily rates adjust to average $201
Seasonality Insights for Bouc-Bel-Air
- The Airbnb seasonality in Bouc-Bel-Air shows highly seasonal trends requiring careful strategy. While the sections above show seasonal averages, it's also insightful to look at the extremes:
- During the high season, the absolute peak month showcases Bouc-Bel-Air's highest earning potential, with monthly revenues capable of climbing to $4,015, occupancy reaching a high of 57.1%, and ADRs peaking at $220.
- Conversely, the slowest single month of the year, typically falling within the low season, marks the market's lowest point. In this month, revenue might dip to $933, occupancy could drop to 34.6%, and ADRs may adjust down to $200.
- Understanding both the seasonal averages and these monthly peaks and troughs in revenue, occupancy, and ADR is crucial for maximizing your Airbnb profit potential in Bouc-Bel-Air.
Seasonal Strategies for Maximizing Profit
- Peak Season: Maximize revenue through premium pricing and potentially longer minimum stays. Ensure high availability.
- Low Season: Offer competitive pricing, special promotions (e.g., extended stay discounts), and flexible cancellation policies. Target off-season travelers like remote workers or budget-conscious guests.
- Shoulder Seasons: Implement dynamic pricing that balances peak and low rates. Target weekend travelers or specific events. Offer slightly more flexible terms than peak season.
- Regularly analyze your own performance against these Bouc-Bel-Air seasonality benchmarks and adjust your pricing and availability strategy accordingly.
Best Areas for Airbnb Investment in Bouc-Bel-Air (2025)
Exploring the top neighborhoods for short-term rentals in Bouc-Bel-Air? This section highlights key areas, outlining why they are attractive for hosts and guests, along with notable local attractions. Consider these locations based on your target guest profile and investment strategy.
| Neighborhood / Area | Why Host Here? (Target Guests & Appeal) | Key Attractions & Landmarks |
|---|---|---|
| Cezar Park | A picturesque park in the center of Bouc-Bel-Air that attracts visitors for its beauty and tranquility. Perfect for families and tourists looking to relax in nature. | Cezar Park, Picnic areas, Walking trails, Local flora and fauna |
| Old Town | The charming historical center of Bouc-Bel-Air, featuring traditional Provençal architecture and a vibrant local market. Ideal for those seeking an authentic experience. | Historical buildings, Local markets, Cafés and shops, Cultural events |
| La Chapelle de Saint-Jean | A beautiful chapel surrounded by scenic views, offering a peaceful retreat for those interested in spirituality and art. | Saint-Jean Chapel, Scenic viewpoints, Hiking paths, Cultural heritage |
| Golf de Bouc-Bel-Air | A popular golfing destination that attracts both local and visiting golf enthusiasts. Great for those looking to cater to sports lovers. | Golf course, Clubhouse restaurant, Nature trails, Scenic views |
| Musee des Arts et Traditions Populaires | Showcasing the local culture and traditions of the region, this museum is perfect for tourists interested in the history of Bouc-Bel-Air and Provence. | Cultural exhibits, Local artisan crafts, Workshops, Historical artifacts |
| Domaine de Saint-Just | A beautiful estate with vineyards and a serene environment. Perfect for wine lovers and those seeking relaxation. | Vineyard tours, Wine tasting, Scenic gardens, Relaxation spaces |
| Parc du Château | A historical park with a castle, providing a unique ambiance and several recreational activities, attractive for all age groups. | Château de Bouc-Bel-Air, Walking paths, Picnic spots, Cultural activities |
| Local markets | Bouc-Bel-Air hosts vibrant local markets that showcase fresh produce and local goods, great for those who want to experience the local lifestyle. | Provençal market, Local food vendors, Craftspeople, Culinary experiences |
Understanding Airbnb License Requirements & STR Laws in Bouc-Bel-Air (2025)
While Bouc-Bel-Air, Provence-Alpes-Côte d'Azur, France currently shows low STR regulations, specific Airbnb license requirements might still exist or change. Always verify the latest short term rental regulations and Airbnb license requirements directly with local government authorities for Bouc-Bel-Air to ensure full compliance before hosting.
(Source: AirROI data, 2025, based on 9% licensed listings)
Top Performing Airbnb Properties in Bouc-Bel-Air (2025)
Benchmark your potential! Explore examples of top-performing Airbnb properties in Bouc-Bel-Airbased on Trailing Twelve Month (TTM) revenue. Analyze their characteristics, revenue, occupancy rate, and ADR to understand what drives success in this market.
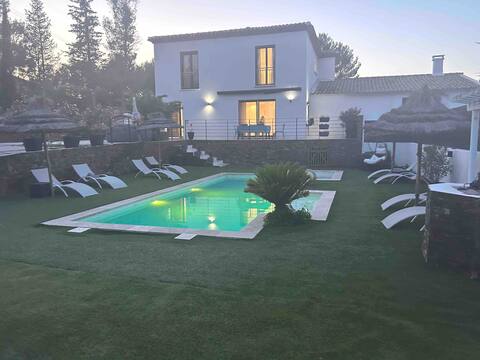
Villa high-end amenities heated pool
Entire Place • 3 bedrooms
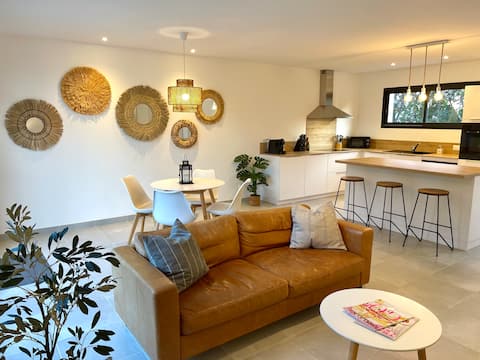
Brand new villa with pool, 8 minutes from Aix
Entire Place • 3 bedrooms
Entire Place • 1 bedroom

Havre de paix dans moulin Provençal avec jacuzzi
Private Room • 2 bedrooms
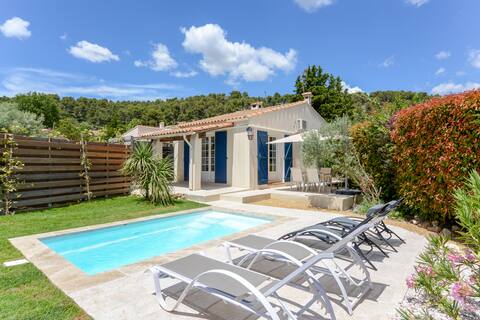
Stunning,spacious villa with private swimming pool
Entire Place • 4 bedrooms
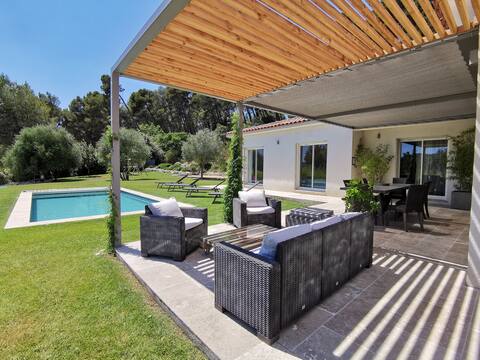
VILLA GIOIA + Chalet, Pool, Jacuzzi sur 2000m2
Entire Place • 6 bedrooms
Note: Performance varies based on location, size, amenities, seasonality, and management quality. Data reflects the past 12 months.
Top Performing Airbnb Hosts in Bouc-Bel-Air (2025)
Learn from the best! This table showcases top-performing Airbnb hosts in Bouc-Bel-Air based on the number of properties managed and estimated total revenue over the past year. Analyze their scale and performance metrics.
| Host Name | Properties | Grossing Revenue | Stay Reviews | Avg Rating |
|---|---|---|---|---|
| Erwan | 2 | $128,507 | 117 | 4.98/5.0 |
| Séverine | 2 | $116,873 | 98 | 4.97/5.0 |
| Sonia | 1 | $100,794 | 7 | 4.00/5.0 |
| Céline Et Stéphane | 2 | $75,793 | 52 | 4.97/5.0 |
| Thalie | 1 | $69,843 | 43 | 4.98/5.0 |
| Coralie Et Thomas | 1 | $66,010 | 35 | 4.83/5.0 |
| Cecile | 1 | $61,962 | 20 | 4.95/5.0 |
| Fanny | 1 | $54,471 | 11 | 5.00/5.0 |
| Isabelle Et Olivier | 1 | $50,006 | 26 | 4.88/5.0 |
| Laure Et Joël | 2 | $49,988 | 18 | 2.39/5.0 |
Analyzing the strategies of top hosts, such as their property selection, pricing, and guest communication, can offer valuable lessons for optimizing your own Airbnb operations in Bouc-Bel-Air.
Dive Deeper: Advanced Bouc-Bel-Air STR Market Data (2025)
Ready to unlock more insights? AirROI provides access to advanced metrics and comprehensive Airbnb data for Bouc-Bel-Air. Explore detailed analytics beyond this report to refine your investment strategy, optimize pricing, and maximize your vacation rental profits.
Explore Advanced MetricsBouc-Bel-Air Short-Term Rental Market Composition (2025): Property & Room Types
Room Type Distribution
Property Type Distribution
Market Composition Insights for Bouc-Bel-Air
- The Bouc-Bel-Air Airbnb market composition is heavily skewed towards Entire Home/Apt listings, which make up 84.1% of the 113 active rentals. This indicates strong guest preference for privacy and space.
- Looking at the property type distribution in Bouc-Bel-Air, House properties are the most common (63.7%), reflecting the local real estate landscape.
- Houses represent a significant 63.7% portion, catering likely to families or larger groups.
- The presence of 9.7% Hotel/Boutique listings indicates integration with traditional hospitality.
- Smaller segments like others, unique stays (combined 4.5%) offer potential for unique stay experiences.
Bouc-Bel-Air Airbnb Room Capacity Analysis (2025): Bedroom Distribution
Distribution of Listings by Number of Bedrooms
Room Capacity Insights for Bouc-Bel-Air
- The dominant room capacity in Bouc-Bel-Air is 1 bedroom listings, making up 38.9% of the market. This suggests a strong demand for properties suitable for couples or solo travelers.
- Together, 1 bedroom and 4 bedrooms properties represent 54.8% of the active Airbnb listings in Bouc-Bel-Air, indicating a high concentration in these sizes.
- A significant 35.3% of listings offer 3+ bedrooms, catering to larger groups and families seeking more space in Bouc-Bel-Air.
Bouc-Bel-Air Vacation Rental Guest Capacity Trends (2025)
Distribution of Listings by Guest Capacity
Guest Capacity Insights for Bouc-Bel-Air
- The most common guest capacity trend in Bouc-Bel-Air vacation rentals is listings accommodating 2 guests (30.1%). This suggests the primary traveler segment is likely couples or solo travelers.
- Properties designed for 2 guests and 8+ guests dominate the Bouc-Bel-Air STR market, accounting for 47.8% of listings.
- 33.6% of properties accommodate 6+ guests, serving the market segment for larger families or group travel in Bouc-Bel-Air.
- On average, properties in Bouc-Bel-Air are equipped to host 4.0 guests.
Bouc-Bel-Air Airbnb Booking Patterns (2025): Available vs. Booked Days
Available Days Distribution
Booked Days Distribution
Booking Pattern Insights for Bouc-Bel-Air
- The most common availability pattern in Bouc-Bel-Air falls within the 271-366 days range, representing 52.2% of listings. This suggests many properties have significant open periods on their calendars.
- Approximately 75.2% of listings show high availability (181+ days open annually), indicating potential for increased bookings or specific owner usage patterns.
- For booked days, the 31-90 days range is most frequent in Bouc-Bel-Air (27.4%), reflecting common guest stay durations or potential owner blocking patterns.
- A notable 25.7% of properties secure long booking periods (181+ days booked per year), highlighting successful long-term rental strategies or significant owner usage.
Bouc-Bel-Air Airbnb Minimum Stay Requirements Analysis
Distribution of Listings by Minimum Night Requirement
1 Night
33 listings
30.8% of total
2 Nights
27 listings
25.2% of total
3 Nights
10 listings
9.3% of total
4-6 Nights
19 listings
17.8% of total
7-29 Nights
13 listings
12.1% of total
30+ Nights
5 listings
4.7% of total
Key Insights
- The most prevalent minimum stay requirement in Bouc-Bel-Air is 1 Night, adopted by 30.8% of listings. This highlights the market's preference for shorter, flexible bookings.
Recommendations
- Align with the market by considering a 1 Night minimum stay, as 30.8% of Bouc-Bel-Air hosts use this setting.
- Adjust minimum nights based on seasonality – potentially shorter during low season and longer during peak demand periods in Bouc-Bel-Air.
Bouc-Bel-Air Airbnb Cancellation Policy Trends Analysis (2025)
Flexible
31 listings
33% of total
Moderate
25 listings
26.6% of total
Firm
15 listings
16% of total
Strict
23 listings
24.5% of total
Cancellation Policy Insights for Bouc-Bel-Air
- The prevailing Airbnb cancellation policy trend in Bouc-Bel-Air is Flexible, used by 33% of listings.
- There's a relatively balanced mix between guest-friendly (59.6%) and stricter (40.5%) policies, offering choices for different guest needs.
Recommendations for Hosts
- Consider adopting a Flexible policy to align with the 33% market standard in Bouc-Bel-Air.
- Regularly review your cancellation policy against competitors and market demand shifts in Bouc-Bel-Air.
Bouc-Bel-Air STR Booking Lead Time Analysis (2025)
Average Booking Lead Time by Month
Booking Lead Time Insights for Bouc-Bel-Air
- The overall average booking lead time for vacation rentals in Bouc-Bel-Air is 52 days.
- Guests book furthest in advance for stays during June (average 81 days), likely coinciding with peak travel demand or local events.
- The shortest booking windows occur for stays in October (average 31 days), indicating more last-minute travel plans during this time.
- Seasonally, Summer (69 days avg.) sees the longest lead times, while Winter (41 days avg.) has the shortest, reflecting typical travel planning cycles.
Recommendations for Hosts
- Use the overall average lead time (52 days) as a baseline for your pricing and availability strategy in Bouc-Bel-Air.
- For June stays, consider implementing length-of-stay discounts or slightly higher rates for bookings made less than 81 days out to capitalize on advance planning.
- Target marketing efforts for the Summer season well in advance (at least 69 days) to capture early planners.
- Monitor your own booking lead times against these Bouc-Bel-Air averages to identify opportunities for dynamic pricing adjustments.
Popular & Essential Airbnb Amenities in Bouc-Bel-Air (2025)
Amenity Prevalence
Amenity Insights for Bouc-Bel-Air
- Essential amenities in Bouc-Bel-Air that guests expect include: Wifi. Lacking these (this) could significantly impact bookings.
- Popular amenities like Heating, Hot water, Free parking on premises are common but not universal. Offering these can provide a competitive edge.
Recommendations for Hosts
- Ensure your listing includes all essential amenities for Bouc-Bel-Air: Wifi.
- Prioritize adding missing essentials: Wifi.
- Consider adding popular differentiators like Heating or Hot water to increase appeal.
- Highlight unique or less common amenities you offer (e.g., hot tub, dedicated workspace, EV charger) in your listing description and photos.
- Regularly check competitor amenities in Bouc-Bel-Air to stay competitive.
Bouc-Bel-Air Airbnb Guest Demographics & Profile Analysis (2025)
Guest Profile Summary for Bouc-Bel-Air
- The typical guest profile for Airbnb in Bouc-Bel-Air consists of primarily domestic travelers (76%), often arriving from nearby Paris, typically belonging to the Post-2000s (Gen Z/Alpha) group (50%), primarily speaking French or English.
- Domestic travelers account for 76.4% of guests.
- Key international markets include France (76.4%) and Germany (4.2%).
- Top languages spoken are French (38.6%) followed by English (34.2%).
- A significant demographic segment is the Post-2000s (Gen Z/Alpha) group, representing 50% of guests.
Recommendations for Hosts
- Target domestic marketing efforts towards travelers from Paris and Marseille.
- Tailor amenities and listing descriptions to appeal to the dominant Post-2000s (Gen Z/Alpha) demographic (e.g., highlight fast WiFi, smart home features, local guides).
- Highlight unique local experiences or amenities relevant to the primary guest profile.
- Consider seasonal promotions aligned with peak travel times for key origin markets.
Nearby Short-Term Rental Market Comparison
How does the Bouc-Bel-Air Airbnb market stack up against its neighbors? Compare key performance metrics like average monthly revenue, ADR, and occupancy rates in surrounding areas to understand the broader regional STR landscape.
| Market | Active Properties | Monthly Revenue | Daily Rate | Avg. Occupancy |
|---|---|---|---|---|
| Divajeu | 19 | $3,941 | $410.65 | 42% |
| Ramatuelle | 213 | $3,891 | $670.10 | 41% |
| Saint-Tropez | 742 | $3,498 | $506.57 | 41% |
| Chantepérier | 20 | $3,057 | $281.60 | 37% |
| Opio | 40 | $3,057 | $540.62 | 37% |
| Gassin | 384 | $2,939 | $434.44 | 40% |
| Gordes | 225 | $2,913 | $366.32 | 43% |
| Redessan | 19 | $2,834 | $334.82 | 34% |
| Fontarèches | 11 | $2,802 | $525.31 | 34% |
| Ménerbes | 97 | $2,800 | $453.86 | 41% |