Arles Airbnb Market Analysis 2025: Short Term Rental Data & Vacation Rental Statistics in Provence-Alpes-Côte d'Azur, France
Is Airbnb profitable in Arles in 2025? Explore comprehensive Airbnb analytics for Arles, Provence-Alpes-Côte d'Azur, France to uncover income potential. This 2025 STR market report for Arles, based on AirROI data from April 2024 to March 2025, reveals key trends in the bustling market of 1,392 active listings.
Whether you're considering an Airbnb investment in Arles, optimizing your existing vacation rental, or exploring rental arbitrage opportunities, understanding the Arles Airbnb data is crucial. Navigating the high regulation landscape is key to maximizing your short term rental income potential. Let's dive into the specifics.
Key Arles Airbnb Performance Metrics Overview
Monthly Airbnb Revenue Variations & Income Potential in Arles (2025)
Understanding the monthly revenue variations for Airbnb listings in Arles is key to maximizing your short term rental income potential. Seasonality significantly impacts earnings. Our analysis, based on data from the past 12 months, shows that the peak revenue month for STRs in Arles is typically August, while February often presents the lowest earnings, highlighting opportunities for strategic pricing adjustments during shoulder and low seasons. Explore the typical Airbnb income in Arles across different performance tiers:
- Best-in-class properties (Top 10%) achieve $3,255+ monthly, often utilizing dynamic pricing and superior guest experiences.
- Strong performing properties (Top 25%) earn $2,011 or more, indicating effective management and desirable locations/amenities.
- Typical properties (Median) generate around $1,211 per month, representing the average market performance.
- Entry-level properties (Bottom 25%) see earnings around $628, often with potential for optimization.
Average Monthly Airbnb Earnings Trend in Arles
Arles Airbnb Occupancy Rate Trends (2025)
Maximize your bookings by understanding the Arles STR occupancy trends. Seasonal demand shifts significantly influence how often properties are booked. Typically, Augustsees the highest demand (peak season occupancy), while January experiences the lowest (low season). Effective strategies, like adjusting minimum stays or offering promotions, can boost occupancy during slower periods. Here's how different property tiers perform in Arles:
- Best-in-class properties (Top 10%) achieve 77%+ occupancy, indicating high desirability and potentially optimized availability.
- Strong performing properties (Top 25%) maintain 58% or higher occupancy, suggesting good market fit and guest satisfaction.
- Typical properties (Median) have an occupancy rate around 37%.
- Entry-level properties (Bottom 25%) average 19% occupancy, potentially facing higher vacancy.
Average Monthly Occupancy Rate Trend in Arles
Average Daily Rate (ADR) Airbnb Trends in Arles (2025)
Effective short term rental pricing strategy in Arles involves understanding monthly ADR fluctuations. The Average Daily Rate (ADR) for Airbnb in Arles typically peaks in July and dips lowest during March. Leveraging Airbnb dynamic pricing tools or strategies based on this seasonality can significantly boost revenue. Here's a look at the typical nightly rates achieved:
- Best-in-class properties (Top 10%) command rates of $230+ per night, often due to premium features or locations.
- Strong performing properties (Top 25%) achieve nightly rates of $141 or more.
- Typical properties (Median) charge around $97 per night.
- Entry-level properties (Bottom 25%) earn around $72 per night.
Average Daily Rate (ADR) Trend by Month in Arles
Get Live Arles Market Intelligence 👇

Explore Real-time Analytics
Airbnb Seasonality Analysis & Trends in Arles (2025)
Peak Season (August, July, June)
- Revenue averages $2,440 per month
- Occupancy rates average 52.1%
- Daily rates average $140
Shoulder Season
- Revenue averages $1,607 per month
- Occupancy maintains around 39.9%
- Daily rates hold near $131
Low Season (January, February, March)
- Revenue drops to average $899 per month
- Occupancy decreases to average 28.4%
- Daily rates adjust to average $125
Seasonality Insights for Arles
- The Airbnb seasonality in Arles shows highly seasonal trends requiring careful strategy. While the sections above show seasonal averages, it's also insightful to look at the extremes:
- During the high season, the absolute peak month showcases Arles's highest earning potential, with monthly revenues capable of climbing to $2,604, occupancy reaching a high of 60.2%, and ADRs peaking at $142.
- Conversely, the slowest single month of the year, typically falling within the low season, marks the market's lowest point. In this month, revenue might dip to $857, occupancy could drop to 26.6%, and ADRs may adjust down to $124.
- Understanding both the seasonal averages and these monthly peaks and troughs in revenue, occupancy, and ADR is crucial for maximizing your Airbnb profit potential in Arles.
Seasonal Strategies for Maximizing Profit
- Peak Season: Maximize revenue through premium pricing and potentially longer minimum stays. Ensure high availability.
- Low Season: Offer competitive pricing, special promotions (e.g., extended stay discounts), and flexible cancellation policies. Target off-season travelers like remote workers or budget-conscious guests.
- Shoulder Seasons: Implement dynamic pricing that balances peak and low rates. Target weekend travelers or specific events. Offer slightly more flexible terms than peak season.
- Regularly analyze your own performance against these Arles seasonality benchmarks and adjust your pricing and availability strategy accordingly.
Best Areas for Airbnb Investment in Arles (2025)
Exploring the top neighborhoods for short-term rentals in Arles? This section highlights key areas, outlining why they are attractive for hosts and guests, along with notable local attractions. Consider these locations based on your target guest profile and investment strategy.
| Neighborhood / Area | Why Host Here? (Target Guests & Appeal) | Key Attractions & Landmarks |
|---|---|---|
| Historical Center | The heart of Arles, known for its Roman architecture, charming streets, and vibrant atmosphere. Tourists flock to this area for its rich history and cultural sites. | Amphitheatre of Arles, Saint-Trophime Church, The Alyscamps, The Roman Theatre, Museon Arlaten |
| Les Alyscamps | A picturesque ancient Roman cemetery that attracts visitors looking for history and beauty. An ideal spot for those who appreciate serene, historic environments. | The Alyscamps, The Saint-Césaire Church, Cultural festivals, Walking trails, Scenic views |
| Rhodan Valley | This area offers beautiful landscapes and vineyards, attracting tourists interested in wine and nature. Perfect for guests seeking rural retreats and wine tours. | Vineyards, Local wineries, Biking paths, Nature parks, Riverside picnics |
| St. Martin | A charming neighborhood with a peaceful vibe, ideal for travelers looking for a quiet getaway yet close to the city. Family-friendly and residential feel. | Local cafes, Parks, Neighborhood markets, Quiet residential streets, Artisan shops |
| Camargue | Famous for its wild landscapes, flamingos, and white horses, the Camargue attracts nature lovers and adventure tourists. Excellent for outdoor activities and natural exploration. | Camargue Nature Park, Wildlife spotting, Horseback riding, Beaches, Unique ecosystems |
| La Roquette | A quaint area that is known for its local culture and accessibility to the main attractions in Arles. A great blend of local charm and tourist convenience. | Local eateries, Cultural events, Street art, Craft shops, Proximity to central attractions |
| Arles Market District | A vibrant area bustling with local markets and shops, perfect for visitors looking to experience local culture and cuisine directly. Great foot traffic and atmosphere. | Arles Market, Local produce, Food stalls, Cultural exchanges, Artisan crafts |
| Arles Riverside | The scenic riverside area is perfect for leisurely strolls and enjoying the French countryside. Ideal for guests who love nature and picturesque views by the river. | Riverside pathways, Scenic views, Cafes by the river, Fishing spots, Picnic areas |
Understanding Airbnb License Requirements & STR Laws in Arles (2025)
Yes, Arles, Provence-Alpes-Côte d'Azur, France enforces high STR regulations. Obtaining a license and ensuring compliance is almost certainly required according to current 2025 STR laws. Always verify the latest short term rental regulations and Airbnb license requirements directly with local government authorities for Arles to ensure full compliance before hosting.
(Source: AirROI data, 2025, based on 76% licensed listings)
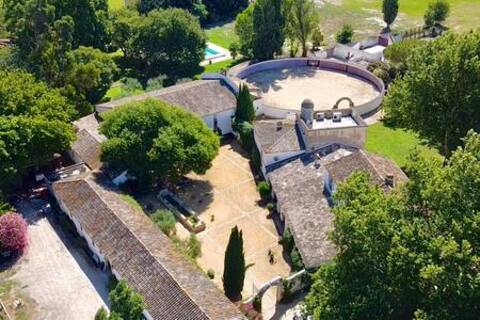
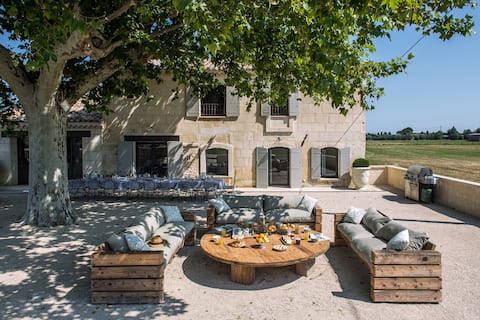
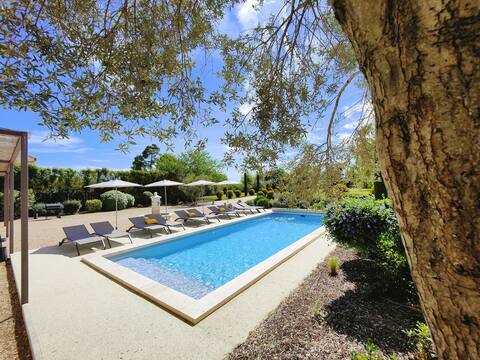
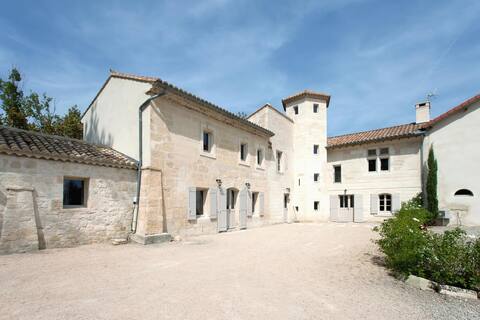
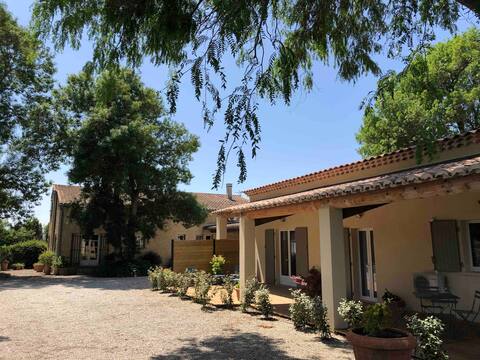
Top Performing Airbnb Properties in Arles (2025)
Benchmark your potential! Explore examples of top-performing Airbnb properties in Arlesbased on Trailing Twelve Month (TTM) revenue. Analyze their characteristics, revenue, occupancy rate, and ADR to understand what drives success in this market.
Mas des Bécasses in Provence 22 pax
Entire Place • 11 bedrooms

MAS DU GRAND PEYRAS 15 people
Entire Place • 8 bedrooms
Mas "Le Grand" 8 bedrooms, with pool
Entire Place • 8 bedrooms
The Loft of Mas Florence (10 min from Arles)
Entire Place • 5 bedrooms
Charming provencal mas at Arles
Entire Place • 9 bedrooms
Property in Provence
Entire Place • 8 bedrooms
Note: Performance varies based on location, size, amenities, seasonality, and management quality. Data reflects the past 12 months.
Top Performing Airbnb Hosts in Arles (2025)
Learn from the best! This table showcases top-performing Airbnb hosts in Arles based on the number of properties managed and estimated total revenue over the past year. Analyze their scale and performance metrics.
| Host Name | Properties | Grossing Revenue | Stay Reviews | Avg Rating |
|---|---|---|---|---|
| Vincent | 25 | $512,273 | 842 | 4.59/5.0 |
| My Holidays In Provence (Earl | 3 | $394,121 | 124 | 4.81/5.0 |
| Sandra | 29 | $377,971 | 712 | 4.27/5.0 |
| Vincent | 1 | $310,819 | 14 | 4.93/5.0 |
| Elise | 4 | $221,006 | 551 | 4.94/5.0 |
| Régis | 15 | $159,877 | 213 | 2.87/5.0 |
| Olivia | 8 | $147,413 | 413 | 4.92/5.0 |
| Florence | 1 | $140,332 | 101 | 4.82/5.0 |
| Delphine | 6 | $128,077 | 666 | 4.97/5.0 |
| Katie | 7 | $103,348 | 1008 | 4.86/5.0 |
Analyzing the strategies of top hosts, such as their property selection, pricing, and guest communication, can offer valuable lessons for optimizing your own Airbnb operations in Arles.
Dive Deeper: Advanced Arles STR Market Data (2025)
Ready to unlock more insights? AirROI provides access to advanced metrics and comprehensive Airbnb data for Arles. Explore detailed analytics beyond this report to refine your investment strategy, optimize pricing, and maximize your vacation rental profits.
Explore Advanced MetricsArles Short-Term Rental Market Composition (2025): Property & Room Types
Room Type Distribution
Property Type Distribution
Market Composition Insights for Arles
- The Arles Airbnb market composition is heavily skewed towards Entire Home/Apt listings, which make up 87.6% of the 1,392 active rentals. This indicates strong guest preference for privacy and space.
- Looking at the property type distribution in Arles, Apartment/Condo properties are the most common (46.3%), reflecting the local real estate landscape.
- Houses represent a significant 44% portion, catering likely to families or larger groups.
- The presence of 5.7% Hotel/Boutique listings indicates integration with traditional hospitality.
- Smaller segments like outdoor/unique, others, unique stays (combined 3.8%) offer potential for unique stay experiences.
Arles Airbnb Room Capacity Analysis (2025): Bedroom Distribution
Distribution of Listings by Number of Bedrooms
Room Capacity Insights for Arles
- The dominant room capacity in Arles is 1 bedroom listings, making up 43% of the market. This suggests a strong demand for properties suitable for couples or solo travelers.
- Together, 1 bedroom and 2 bedrooms properties represent 66.4% of the active Airbnb listings in Arles, indicating a high concentration in these sizes.
Arles Vacation Rental Guest Capacity Trends (2025)
Distribution of Listings by Guest Capacity
Guest Capacity Insights for Arles
- The most common guest capacity trend in Arles vacation rentals is listings accommodating 2 guests (31.3%). This suggests the primary traveler segment is likely couples or solo travelers.
- Properties designed for 2 guests and 4 guests dominate the Arles STR market, accounting for 59.5% of listings.
- 21.3% of properties accommodate 6+ guests, serving the market segment for larger families or group travel in Arles.
- On average, properties in Arles are equipped to host 3.6 guests.
Arles Airbnb Booking Patterns (2025): Available vs. Booked Days
Available Days Distribution
Booked Days Distribution
Booking Pattern Insights for Arles
- The most common availability pattern in Arles falls within the 271-366 days range, representing 47.5% of listings. This suggests many properties have significant open periods on their calendars.
- Approximately 82.8% of listings show high availability (181+ days open annually), indicating potential for increased bookings or specific owner usage patterns.
- For booked days, the 91-180 days range is most frequent in Arles (36.5%), reflecting common guest stay durations or potential owner blocking patterns.
- A notable 18.1% of properties secure long booking periods (181+ days booked per year), highlighting successful long-term rental strategies or significant owner usage.
Arles Airbnb Minimum Stay Requirements Analysis
Distribution of Listings by Minimum Night Requirement
1 Night
265 listings
20.6% of total
2 Nights
479 listings
37.3% of total
3 Nights
244 listings
19% of total
4-6 Nights
137 listings
10.7% of total
7-29 Nights
34 listings
2.6% of total
30+ Nights
126 listings
9.8% of total
Key Insights
- The most prevalent minimum stay requirement in Arles is 2 Nights, adopted by 37.3% of listings. This highlights the market's preference for shorter, flexible bookings.
Recommendations
- Align with the market by considering a 2 Nights minimum stay, as 37.3% of Arles hosts use this setting.
- If feasible, allowing 1-night stays, especially midweek or during low season, could capture last-minute bookings, as only 20.6% currently do.
- Explore offering discounts for stays of 30+ nights to attract the 9.8% of the market seeking extended stays.
- Adjust minimum nights based on seasonality – potentially shorter during low season and longer during peak demand periods in Arles.
Arles Airbnb Cancellation Policy Trends Analysis (2025)
Super Strict 30 Days
1 listings
0.1% of total
Super Strict 60 Days
1 listings
0.1% of total
Non-refundable
1 listings
0.1% of total
Flexible
268 listings
22.6% of total
Moderate
392 listings
33% of total
Firm
242 listings
20.4% of total
Strict
283 listings
23.8% of total
Cancellation Policy Insights for Arles
- The prevailing Airbnb cancellation policy trend in Arles is Moderate, used by 33% of listings.
- There's a relatively balanced mix between guest-friendly (55.6%) and stricter (44.2%) policies, offering choices for different guest needs.
Recommendations for Hosts
- Consider adopting a Moderate policy to align with the 33% market standard in Arles.
- Regularly review your cancellation policy against competitors and market demand shifts in Arles.
Arles STR Booking Lead Time Analysis (2025)
Average Booking Lead Time by Month
Booking Lead Time Insights for Arles
- The overall average booking lead time for vacation rentals in Arles is 56 days.
- Guests book furthest in advance for stays during July (average 97 days), likely coinciding with peak travel demand or local events.
- The shortest booking windows occur for stays in February (average 34 days), indicating more last-minute travel plans during this time.
- Seasonally, Summer (82 days avg.) sees the longest lead times, while Winter (37 days avg.) has the shortest, reflecting typical travel planning cycles.
Recommendations for Hosts
- Use the overall average lead time (56 days) as a baseline for your pricing and availability strategy in Arles.
- For July stays, consider implementing length-of-stay discounts or slightly higher rates for bookings made less than 97 days out to capitalize on advance planning.
- Target marketing efforts for the Summer season well in advance (at least 82 days) to capture early planners.
- Monitor your own booking lead times against these Arles averages to identify opportunities for dynamic pricing adjustments.
Popular & Essential Airbnb Amenities in Arles (2025)
Amenity Prevalence
Amenity Insights for Arles
- Popular amenities like Heating, Kitchen, Wifi are common but not universal. Offering these can provide a competitive edge.
- Warning: Wifi is not universally provided but is considered essential globally. Ensure reliable Wifi is offered.
Recommendations for Hosts
- Consider adding popular differentiators like Heating or Kitchen to increase appeal.
- Highlight unique or less common amenities you offer (e.g., hot tub, dedicated workspace, EV charger) in your listing description and photos.
- Regularly check competitor amenities in Arles to stay competitive.
Arles Airbnb Guest Demographics & Profile Analysis (2025)
Guest Profile Summary for Arles
- The typical guest profile for Airbnb in Arles consists of a mix of domestic (60%) and international guests, often arriving from nearby Paris, typically belonging to the Post-2000s (Gen Z/Alpha) group (50%), primarily speaking English or French.
- Domestic travelers account for 59.5% of guests.
- Key international markets include France (59.5%) and United States (6.3%).
- Top languages spoken are English (36.1%) followed by French (31.4%).
- A significant demographic segment is the Post-2000s (Gen Z/Alpha) group, representing 50% of guests.
Recommendations for Hosts
- Balance marketing efforts between domestic and international channels based on the guest mix.
- Tailor amenities and listing descriptions to appeal to the dominant Post-2000s (Gen Z/Alpha) demographic (e.g., highlight fast WiFi, smart home features, local guides).
- Highlight unique local experiences or amenities relevant to the primary guest profile.
- Consider seasonal promotions aligned with peak travel times for key origin markets.
Nearby Short-Term Rental Market Comparison
How does the Arles Airbnb market stack up against its neighbors? Compare key performance metrics like average monthly revenue, ADR, and occupancy rates in surrounding areas to understand the broader regional STR landscape.
| Market | Active Properties | Monthly Revenue | Daily Rate | Avg. Occupancy |
|---|---|---|---|---|
| Villeneuvette | 13 | $4,150 | $337.56 | 44% |
| Divajeu | 19 | $3,941 | $410.65 | 42% |
| Chantepérier | 20 | $3,057 | $281.60 | 37% |
| Rupià | 11 | $3,046 | $386.95 | 40% |
| Gordes | 225 | $2,913 | $366.32 | 43% |
| Redessan | 19 | $2,834 | $334.82 | 34% |
| Fontarèches | 11 | $2,802 | $525.31 | 34% |
| Ménerbes | 97 | $2,800 | $453.86 | 41% |
| La Bruguière | 14 | $2,732 | $277.64 | 50% |
| Soyans | 12 | $2,721 | $193.55 | 45% |