Antibes Airbnb Market Analysis 2025: Short Term Rental Data & Vacation Rental Statistics in Provence-Alpes-Côte d'Azur, France
Is Airbnb profitable in Antibes in 2025? Explore comprehensive Airbnb analytics for Antibes, Provence-Alpes-Côte d'Azur, France to uncover income potential. This 2025 STR market report for Antibes, based on AirROI data from April 2024 to March 2025, reveals key trends in the bustling market of 3,755 active listings.
Whether you're considering an Airbnb investment in Antibes, optimizing your existing vacation rental, or exploring rental arbitrage opportunities, understanding the Antibes Airbnb data is crucial. Understanding the local regulations is key to maximizing your short term rental income potential. Let's dive into the specifics.
Key Antibes Airbnb Performance Metrics Overview
Monthly Airbnb Revenue Variations & Income Potential in Antibes (2025)
Understanding the monthly revenue variations for Airbnb listings in Antibes is key to maximizing your short term rental income potential. Seasonality significantly impacts earnings. Our analysis, based on data from the past 12 months, shows that the peak revenue month for STRs in Antibes is typically August, while February often presents the lowest earnings, highlighting opportunities for strategic pricing adjustments during shoulder and low seasons. Explore the typical Airbnb income in Antibes across different performance tiers:
- Best-in-class properties (Top 10%) achieve $4,826+ monthly, often utilizing dynamic pricing and superior guest experiences.
- Strong performing properties (Top 25%) earn $3,046 or more, indicating effective management and desirable locations/amenities.
- Typical properties (Median) generate around $1,867 per month, representing the average market performance.
- Entry-level properties (Bottom 25%) see earnings around $1,026, often with potential for optimization.
Average Monthly Airbnb Earnings Trend in Antibes
Antibes Airbnb Occupancy Rate Trends (2025)
Maximize your bookings by understanding the Antibes STR occupancy trends. Seasonal demand shifts significantly influence how often properties are booked. Typically, Augustsees the highest demand (peak season occupancy), while January experiences the lowest (low season). Effective strategies, like adjusting minimum stays or offering promotions, can boost occupancy during slower periods. Here's how different property tiers perform in Antibes:
- Best-in-class properties (Top 10%) achieve 81%+ occupancy, indicating high desirability and potentially optimized availability.
- Strong performing properties (Top 25%) maintain 64% or higher occupancy, suggesting good market fit and guest satisfaction.
- Typical properties (Median) have an occupancy rate around 44%.
- Entry-level properties (Bottom 25%) average 24% occupancy, potentially facing higher vacancy.
Average Monthly Occupancy Rate Trend in Antibes
Average Daily Rate (ADR) Airbnb Trends in Antibes (2025)
Effective short term rental pricing strategy in Antibes involves understanding monthly ADR fluctuations. The Average Daily Rate (ADR) for Airbnb in Antibes typically peaks in August and dips lowest during February. Leveraging Airbnb dynamic pricing tools or strategies based on this seasonality can significantly boost revenue. Here's a look at the typical nightly rates achieved:
- Best-in-class properties (Top 10%) command rates of $297+ per night, often due to premium features or locations.
- Strong performing properties (Top 25%) achieve nightly rates of $175 or more.
- Typical properties (Median) charge around $122 per night.
- Entry-level properties (Bottom 25%) earn around $90 per night.
Average Daily Rate (ADR) Trend by Month in Antibes
Get Live Antibes Market Intelligence 👇

Explore Real-time Analytics
Airbnb Seasonality Analysis & Trends in Antibes (2025)
Peak Season (August, July, June)
- Revenue averages $4,254 per month
- Occupancy rates average 61.0%
- Daily rates average $202
Shoulder Season
- Revenue averages $2,453 per month
- Occupancy maintains around 44.1%
- Daily rates hold near $181
Low Season (January, February, March)
- Revenue drops to average $1,200 per month
- Occupancy decreases to average 29.1%
- Daily rates adjust to average $169
Seasonality Insights for Antibes
- The Airbnb seasonality in Antibes shows highly seasonal trends requiring careful strategy. While the sections above show seasonal averages, it's also insightful to look at the extremes:
- During the high season, the absolute peak month showcases Antibes's highest earning potential, with monthly revenues capable of climbing to $4,675, occupancy reaching a high of 70.6%, and ADRs peaking at $206.
- Conversely, the slowest single month of the year, typically falling within the low season, marks the market's lowest point. In this month, revenue might dip to $1,115, occupancy could drop to 26.7%, and ADRs may adjust down to $169.
- Understanding both the seasonal averages and these monthly peaks and troughs in revenue, occupancy, and ADR is crucial for maximizing your Airbnb profit potential in Antibes.
Seasonal Strategies for Maximizing Profit
- Peak Season: Maximize revenue through premium pricing and potentially longer minimum stays. Ensure high availability.
- Low Season: Offer competitive pricing, special promotions (e.g., extended stay discounts), and flexible cancellation policies. Target off-season travelers like remote workers or budget-conscious guests.
- Shoulder Seasons: Implement dynamic pricing that balances peak and low rates. Target weekend travelers or specific events. Offer slightly more flexible terms than peak season.
- Regularly analyze your own performance against these Antibes seasonality benchmarks and adjust your pricing and availability strategy accordingly.
Best Areas for Airbnb Investment in Antibes (2025)
Exploring the top neighborhoods for short-term rentals in Antibes? This section highlights key areas, outlining why they are attractive for hosts and guests, along with notable local attractions. Consider these locations based on your target guest profile and investment strategy.
| Neighborhood / Area | Why Host Here? (Target Guests & Appeal) | Key Attractions & Landmarks |
|---|---|---|
| Old Town Antibes | Charming historical district with narrow streets, lined with cafés and boutiques. Popular with tourists for its local culture and proximity to beaches. | Picasso Museum, Antibes Cathedral, Fort Carré, Place Nationale, Marineland |
| Juan-les-Pins | Lively seaside resort with sandy beaches and vibrant nightlife. Attracts families and party-goers seeking sun and entertainment. | Juan-les-Pins Beach, Pine Grove, Night clubs, Sea Theatre, Shopping promenade |
| Cap d'Antibes | Exclusive area known for luxury villas and stunning coastal views. Ideal for affluent travelers seeking tranquility and beauty. | Plage de la Garoupe, Billionaires' Bay, Cap d'Antibes Lighthouse, Luxury hotels, Scenic walking paths |
| Salis Beach | Popular beach area with family-friendly atmosphere and water sports activities. Perfect for attracting summer vacationers. | Salis Beach, Water sports rentals, Picnic spots, Seaside restaurants, Scenic views |
| Port Vauban | France's largest yacht harbor, attracting luxury travelers and sailing enthusiasts. Great for those interested in the nautical lifestyle. | Luxury yachts, Waterfront restaurants, Promenade, Old Antibes views, Nautical activities |
| La Colombette | Quiet residential area close to beaches and nature. Appeals to families looking for a peaceful getaway near the coast. | Nearby nature trails, Family-friendly parks, Close to schools, Local markets, Access to beaches |
| Antibes Market | Cultural hub with a vibrant local market. Attracts tourists looking for authentic French culture and cuisine. | Provencal Market, Local delicacies, Cafés, Artisan shops, Cultural events |
| Juan-les-Pins Nightlife | Vibrant nightlife scene with various bars and clubs. Targets younger crowds looking for entertainment and socializing. | Nightclubs, Bars, Live music venues, Beach parties, Cafés |
Understanding Airbnb License Requirements & STR Laws in Antibes (2025)
With 28% of listings showing registration in 2025, understanding potential Airbnb license requirements is crucial in Antibes. Always verify the latest short term rental regulations and Airbnb license requirements directly with local government authorities for Antibes to ensure full compliance before hosting.
(Source: AirROI data, 2025, based on 28% licensed listings)
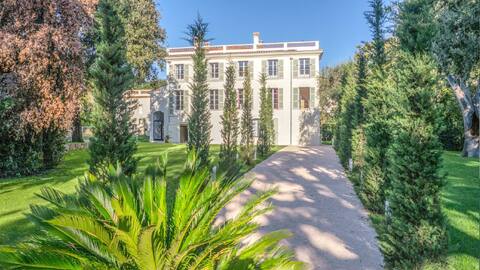
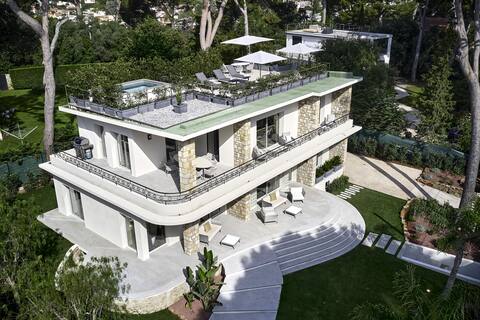
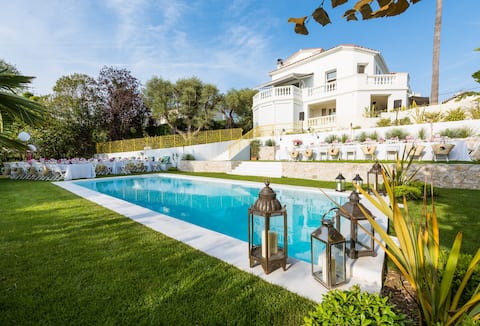
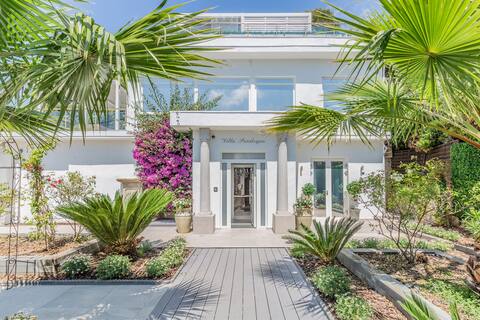
Top Performing Airbnb Properties in Antibes (2025)
Benchmark your potential! Explore examples of top-performing Airbnb properties in Antibesbased on Trailing Twelve Month (TTM) revenue. Analyze their characteristics, revenue, occupancy rate, and ADR to understand what drives success in this market.

Villa Acquamarine
Entire Place • 5 bedrooms
THE "WAOUHH "EFFECT! 760m2, 10 bedroom pool
Entire Place • 10 bedrooms
Villa Cap d'Antibes sea view 10 pax AC pool garage
Entire Place • 5 bedrooms
Cap d'Antibes Art Deco Villa 6 bedroom near beach
Entire Place • 6 bedrooms
VIP Villa Sandryon in the Exclusive Cap d'Antibes
Entire Place • 6 bedrooms
Villa Citadelle Fantastic sea view, spa, pool, gym
Entire Place • 6 bedrooms
Note: Performance varies based on location, size, amenities, seasonality, and management quality. Data reflects the past 12 months.
Top Performing Airbnb Hosts in Antibes (2025)
Learn from the best! This table showcases top-performing Airbnb hosts in Antibes based on the number of properties managed and estimated total revenue over the past year. Analyze their scale and performance metrics.
| Host Name | Properties | Grossing Revenue | Stay Reviews | Avg Rating |
|---|---|---|---|---|
| BnB | 41 | $1,918,144 | 396 | 3.47/5.0 |
| Ivan | 53 | $1,753,587 | 3296 | 4.66/5.0 |
| L'Équipe CLOME | 61 | $1,699,053 | 2814 | 4.78/5.0 |
| Nicolas And The Bnbhere Team | 43 | $1,260,979 | 1849 | 4.22/5.0 |
| Fabrice - Night & Day Bell | 38 | $860,474 | 1392 | 4.37/5.0 |
| Sébastien | 16 | $665,843 | 900 | 4.88/5.0 |
| Roxanne | 28 | $661,870 | 255 | 4.29/5.0 |
| Léo Et Romain | 12 | $635,625 | 289 | 4.92/5.0 |
| Henri & Maggy | 5 | $625,578 | 256 | 4.98/5.0 |
| Prescillia | 19 | $603,755 | 2065 | 4.78/5.0 |
Analyzing the strategies of top hosts, such as their property selection, pricing, and guest communication, can offer valuable lessons for optimizing your own Airbnb operations in Antibes.
Dive Deeper: Advanced Antibes STR Market Data (2025)
Ready to unlock more insights? AirROI provides access to advanced metrics and comprehensive Airbnb data for Antibes. Explore detailed analytics beyond this report to refine your investment strategy, optimize pricing, and maximize your vacation rental profits.
Explore Advanced MetricsAntibes Short-Term Rental Market Composition (2025): Property & Room Types
Room Type Distribution
Property Type Distribution
Market Composition Insights for Antibes
- The Antibes Airbnb market composition is heavily skewed towards Entire Home/Apt listings, which make up 97.8% of the 3,755 active rentals. This indicates strong guest preference for privacy and space.
- Looking at the property type distribution in Antibes, Apartment/Condo properties are the most common (88%), reflecting the local real estate landscape.
- Smaller segments like hotel/boutique, outdoor/unique, others (combined 0.9%) offer potential for unique stay experiences.
Antibes Airbnb Room Capacity Analysis (2025): Bedroom Distribution
Distribution of Listings by Number of Bedrooms
Room Capacity Insights for Antibes
- The dominant room capacity in Antibes is 1 bedroom listings, making up 47.1% of the market. This suggests a strong demand for properties suitable for couples or solo travelers.
- Together, 1 bedroom and 2 bedrooms properties represent 72.5% of the active Airbnb listings in Antibes, indicating a high concentration in these sizes.
Antibes Vacation Rental Guest Capacity Trends (2025)
Distribution of Listings by Guest Capacity
Guest Capacity Insights for Antibes
- The most common guest capacity trend in Antibes vacation rentals is listings accommodating 4 guests (42.5%). This suggests the primary traveler segment is likely small families or groups.
- Properties designed for 4 guests and 2 guests dominate the Antibes STR market, accounting for 68.2% of listings.
- 17.8% of properties accommodate 6+ guests, serving the market segment for larger families or group travel in Antibes.
- On average, properties in Antibes are equipped to host 3.9 guests.
Antibes Airbnb Booking Patterns (2025): Available vs. Booked Days
Available Days Distribution
Booked Days Distribution
Booking Pattern Insights for Antibes
- The most common availability pattern in Antibes falls within the 271-366 days range, representing 43.4% of listings. This suggests many properties have significant open periods on their calendars.
- Approximately 80.7% of listings show high availability (181+ days open annually), indicating potential for increased bookings or specific owner usage patterns.
- For booked days, the 91-180 days range is most frequent in Antibes (38.2%), reflecting common guest stay durations or potential owner blocking patterns.
- A notable 20.6% of properties secure long booking periods (181+ days booked per year), highlighting successful long-term rental strategies or significant owner usage.
Antibes Airbnb Minimum Stay Requirements Analysis
Distribution of Listings by Minimum Night Requirement
1 Night
273 listings
7.8% of total
2 Nights
618 listings
17.8% of total
3 Nights
773 listings
22.2% of total
4-6 Nights
1042 listings
29.9% of total
7-29 Nights
367 listings
10.5% of total
30+ Nights
408 listings
11.7% of total
Key Insights
- The most prevalent minimum stay requirement in Antibes is 4-6 Nights, adopted by 29.9% of listings. This highlights the market's preference for longer commitments.
- A significant segment (11.7%) caters to monthly stays (30+ nights) in Antibes, pointing to opportunities in the extended-stay market.
Recommendations
- Align with the market by considering a 4-6 Nights minimum stay, as 29.9% of Antibes hosts use this setting.
- If feasible, allowing 1-night stays, especially midweek or during low season, could capture last-minute bookings, as only 7.8% currently do.
- Explore offering discounts for stays of 30+ nights to attract the 11.7% of the market seeking extended stays.
- Adjust minimum nights based on seasonality – potentially shorter during low season and longer during peak demand periods in Antibes.
Antibes Airbnb Cancellation Policy Trends Analysis (2025)
Super Strict 30 Days
64 listings
2% of total
Super Strict 60 Days
13 listings
0.4% of total
Non-refundable
6 listings
0.2% of total
Refundable
2 listings
0.1% of total
Flexible
469 listings
15% of total
Moderate
777 listings
24.8% of total
Firm
781 listings
24.9% of total
Strict
1019 listings
32.5% of total
Cancellation Policy Insights for Antibes
- The prevailing Airbnb cancellation policy trend in Antibes is Strict, used by 32.5% of listings.
- A majority (57.4%) of hosts in Antibes utilize Firm or Strict policies, indicating a market where hosts prioritize booking security.
Recommendations for Hosts
- Consider adopting a Strict policy to align with the 32.5% market standard in Antibes.
- With 32.5% using Strict terms, this is a viable option in Antibes, particularly for high-value properties or during peak demand periods.
- Regularly review your cancellation policy against competitors and market demand shifts in Antibes.
Antibes STR Booking Lead Time Analysis (2025)
Average Booking Lead Time by Month
Booking Lead Time Insights for Antibes
- The overall average booking lead time for vacation rentals in Antibes is 58 days.
- Guests book furthest in advance for stays during July (average 96 days), likely coinciding with peak travel demand or local events.
- The shortest booking windows occur for stays in February (average 41 days), indicating more last-minute travel plans during this time.
- Seasonally, Summer (85 days avg.) sees the longest lead times, while Winter (43 days avg.) has the shortest, reflecting typical travel planning cycles.
Recommendations for Hosts
- Use the overall average lead time (58 days) as a baseline for your pricing and availability strategy in Antibes.
- For July stays, consider implementing length-of-stay discounts or slightly higher rates for bookings made less than 96 days out to capitalize on advance planning.
- Target marketing efforts for the Summer season well in advance (at least 85 days) to capture early planners.
- Monitor your own booking lead times against these Antibes averages to identify opportunities for dynamic pricing adjustments.
Popular & Essential Airbnb Amenities in Antibes (2025)
Amenity Prevalence
Amenity Insights for Antibes
- Essential amenities in Antibes that guests expect include: Kitchen, Wifi, TV. Lacking these (any) could significantly impact bookings.
- Popular amenities like Washer, Heating, Hot water are common but not universal. Offering these can provide a competitive edge.
Recommendations for Hosts
- Ensure your listing includes all essential amenities for Antibes: Kitchen, Wifi, TV.
- Prioritize adding missing essentials: Kitchen, Wifi, TV.
- Consider adding popular differentiators like Washer or Heating to increase appeal.
- Highlight unique or less common amenities you offer (e.g., hot tub, dedicated workspace, EV charger) in your listing description and photos.
- Regularly check competitor amenities in Antibes to stay competitive.
Antibes Airbnb Guest Demographics & Profile Analysis (2025)
Guest Profile Summary for Antibes
- The typical guest profile for Airbnb in Antibes consists of predominantly international visitors (71%), with top international origins including United Kingdom, typically belonging to the Post-2000s (Gen Z/Alpha) group (50%), primarily speaking English or French.
- Domestic travelers account for 29.2% of guests.
- Key international markets include France (29.2%) and United Kingdom (15.3%).
- Top languages spoken are English (41.2%) followed by French (21.8%).
- A significant demographic segment is the Post-2000s (Gen Z/Alpha) group, representing 50% of guests.
Recommendations for Hosts
- Focus marketing internationally, particularly towards travelers from United Kingdom.
- Tailor amenities and listing descriptions to appeal to the dominant Post-2000s (Gen Z/Alpha) demographic (e.g., highlight fast WiFi, smart home features, local guides).
- Highlight unique local experiences or amenities relevant to the primary guest profile.
- Consider seasonal promotions aligned with peak travel times for key origin markets.
Nearby Short-Term Rental Market Comparison
How does the Antibes Airbnb market stack up against its neighbors? Compare key performance metrics like average monthly revenue, ADR, and occupancy rates in surrounding areas to understand the broader regional STR landscape.
| Market | Active Properties | Monthly Revenue | Daily Rate | Avg. Occupancy |
|---|---|---|---|---|
| Monteu Roero | 16 | $4,432 | $540.14 | 36% |
| Ramatuelle | 213 | $3,891 | $670.10 | 41% |
| Saint-Jean-Cap-Ferrat | 107 | $3,844 | $424.21 | 46% |
| Cossano Belbo | 13 | $3,632 | $284.21 | 42% |
| Saint-Tropez | 742 | $3,498 | $506.57 | 41% |
| Cassinasco | 18 | $3,219 | $545.40 | 41% |
| Èze | 153 | $3,168 | $345.84 | 47% |
| Opio | 40 | $3,057 | $540.62 | 37% |
| Villefranche-sur-Mer | 501 | $2,977 | $268.57 | 52% |
| Gassin | 384 | $2,939 | $434.44 | 40% |