Saint-Barthélemy-d'Anjou Airbnb Market Analysis 2025: Short Term Rental Data & Vacation Rental Statistics in Pays de la Loire, France
Is Airbnb profitable in Saint-Barthélemy-d'Anjou in 2025? Explore comprehensive Airbnb analytics for Saint-Barthélemy-d'Anjou, Pays de la Loire, France to uncover income potential. This 2025 STR market report for Saint-Barthélemy-d'Anjou, based on AirROI data from April 2024 to March 2025, reveals key trends in the niche market of 22 active listings.
Whether you're considering an Airbnb investment in Saint-Barthélemy-d'Anjou, optimizing your existing vacation rental, or exploring rental arbitrage opportunities, understanding the Saint-Barthélemy-d'Anjou Airbnb data is crucial. Leveraging the low regulation environment is key to maximizing your short term rental income potential. Let's dive into the specifics.
Key Saint-Barthélemy-d'Anjou Airbnb Performance Metrics Overview
Monthly Airbnb Revenue Variations & Income Potential in Saint-Barthélemy-d'Anjou (2025)
Understanding the monthly revenue variations for Airbnb listings in Saint-Barthélemy-d'Anjou is key to maximizing your short term rental income potential. Seasonality significantly impacts earnings. Our analysis, based on data from the past 12 months, shows that the peak revenue month for STRs in Saint-Barthélemy-d'Anjou is typically August, while March often presents the lowest earnings, highlighting opportunities for strategic pricing adjustments during shoulder and low seasons. Explore the typical Airbnb income in Saint-Barthélemy-d'Anjou across different performance tiers:
- Best-in-class properties (Top 10%) achieve $2,575+ monthly, often utilizing dynamic pricing and superior guest experiences.
- Strong performing properties (Top 25%) earn $1,394 or more, indicating effective management and desirable locations/amenities.
- Typical properties (Median) generate around $889 per month, representing the average market performance.
- Entry-level properties (Bottom 25%) see earnings around $443, often with potential for optimization.
Average Monthly Airbnb Earnings Trend in Saint-Barthélemy-d'Anjou
Saint-Barthélemy-d'Anjou Airbnb Occupancy Rate Trends (2025)
Maximize your bookings by understanding the Saint-Barthélemy-d'Anjou STR occupancy trends. Seasonal demand shifts significantly influence how often properties are booked. Typically, Octobersees the highest demand (peak season occupancy), while April experiences the lowest (low season). Effective strategies, like adjusting minimum stays or offering promotions, can boost occupancy during slower periods. Here's how different property tiers perform in Saint-Barthélemy-d'Anjou:
- Best-in-class properties (Top 10%) achieve 76%+ occupancy, indicating high desirability and potentially optimized availability.
- Strong performing properties (Top 25%) maintain 64% or higher occupancy, suggesting good market fit and guest satisfaction.
- Typical properties (Median) have an occupancy rate around 40%.
- Entry-level properties (Bottom 25%) average 25% occupancy, potentially facing higher vacancy.
Average Monthly Occupancy Rate Trend in Saint-Barthélemy-d'Anjou
Average Daily Rate (ADR) Airbnb Trends in Saint-Barthélemy-d'Anjou (2025)
Effective short term rental pricing strategy in Saint-Barthélemy-d'Anjou involves understanding monthly ADR fluctuations. The Average Daily Rate (ADR) for Airbnb in Saint-Barthélemy-d'Anjou typically peaks in January and dips lowest during October. Leveraging Airbnb dynamic pricing tools or strategies based on this seasonality can significantly boost revenue. Here's a look at the typical nightly rates achieved:
- Best-in-class properties (Top 10%) command rates of $146+ per night, often due to premium features or locations.
- Strong performing properties (Top 25%) achieve nightly rates of $89 or more.
- Typical properties (Median) charge around $51 per night.
- Entry-level properties (Bottom 25%) earn around $40 per night.
Average Daily Rate (ADR) Trend by Month in Saint-Barthélemy-d'Anjou
Get Live Saint-Barthélemy-d'Anjou Market Intelligence 👇

Explore Real-time Analytics
Airbnb Seasonality Analysis & Trends in Saint-Barthélemy-d'Anjou (2025)
Peak Season (August, May, June)
- Revenue averages $2,012 per month
- Occupancy rates average 42.4%
- Daily rates average $90
Shoulder Season
- Revenue averages $1,309 per month
- Occupancy maintains around 45.6%
- Daily rates hold near $100
Low Season (January, February, March)
- Revenue drops to average $841 per month
- Occupancy decreases to average 44.1%
- Daily rates adjust to average $120
Seasonality Insights for Saint-Barthélemy-d'Anjou
- The Airbnb seasonality in Saint-Barthélemy-d'Anjou shows highly seasonal trends requiring careful strategy. While the sections above show seasonal averages, it's also insightful to look at the extremes:
- During the high season, the absolute peak month showcases Saint-Barthélemy-d'Anjou's highest earning potential, with monthly revenues capable of climbing to $2,080, occupancy reaching a high of 59.9%, and ADRs peaking at $122.
- Conversely, the slowest single month of the year, typically falling within the low season, marks the market's lowest point. In this month, revenue might dip to $778, occupancy could drop to 26.7%, and ADRs may adjust down to $89.
- Understanding both the seasonal averages and these monthly peaks and troughs in revenue, occupancy, and ADR is crucial for maximizing your Airbnb profit potential in Saint-Barthélemy-d'Anjou.
Seasonal Strategies for Maximizing Profit
- Peak Season: Maximize revenue through premium pricing and potentially longer minimum stays. Ensure high availability.
- Low Season: Offer competitive pricing, special promotions (e.g., extended stay discounts), and flexible cancellation policies. Target off-season travelers like remote workers or budget-conscious guests.
- Shoulder Seasons: Implement dynamic pricing that balances peak and low rates. Target weekend travelers or specific events. Offer slightly more flexible terms than peak season.
- Regularly analyze your own performance against these Saint-Barthélemy-d'Anjou seasonality benchmarks and adjust your pricing and availability strategy accordingly.
Best Areas for Airbnb Investment in Saint-Barthélemy-d'Anjou (2025)
Exploring the top neighborhoods for short-term rentals in Saint-Barthélemy-d'Anjou? This section highlights key areas, outlining why they are attractive for hosts and guests, along with notable local attractions. Consider these locations based on your target guest profile and investment strategy.
| Neighborhood / Area | Why Host Here? (Target Guests & Appeal) | Key Attractions & Landmarks |
|---|---|---|
| Saint-Barthélemy Centre | The heart of Saint-Barthélemy-d'Anjou, featuring a vibrant community atmosphere with local shops and restaurants. It's a great location for travelers looking to explore local culture and cuisine. | Local markets, Cultural festivals, Cycling paths, Parks and recreational areas |
| Les Hauts de Saint-Barthélemy | A residential area that offers a mix of tranquility and accessibility. Commonly preferred by families and those looking for a longer stay, it provides a peaceful environment with nearby amenities. | Parks, Schools, Playgrounds |
| Parc des Expositions | Ideal for visitors attending shows and exhibitions, this area has a steady flow of business travelers seeking convenient accommodations near events. | Exhibition center, Conference venues, Local dining options |
| La Roche d'Égreville | Known for its scenic views and natural beauty, this area attracts nature lovers and those looking for a retreat from urban life, perfect for relaxation. | Hiking trails, Nature parks, Scenic viewpoints |
| Lac de Maine | A beautiful lake area offering recreational activities such as boating and fishing. Popular among tourists for outdoor activities and relaxing by the water. | Lac de Maine park, Boating and fishing opportunities, Walking trails |
| Zone d'activités des Tuileries | A commercial hub with various shops and services, appealing to both business travelers and tourists who need easy access to facilities and transportation. | Shops and restaurants, Business amenities |
| Saint-Barthélemy-le-Vieux | An older part of the city with historical architecture and a charming atmosphere. Attracts visitors interested in history and culture. | Historical sites, Museums, Cultural landmarks |
| Les Jardins de la Ville | New residential developments that cater to families, providing modern living spaces. Attractive to those looking for a suburban feel with city conveniences. | Community parks, Play areas, Family-friendly services |
Understanding Airbnb License Requirements & STR Laws in Saint-Barthélemy-d'Anjou (2025)
While Saint-Barthélemy-d'Anjou, Pays de la Loire, France currently shows low STR regulations, specific Airbnb license requirements might still exist or change. Always verify the latest short term rental regulations and Airbnb license requirements directly with local government authorities for Saint-Barthélemy-d'Anjou to ensure full compliance before hosting.
(Source: AirROI data, 2025, based on 5% licensed listings)
Top Performing Airbnb Properties in Saint-Barthélemy-d'Anjou (2025)
Benchmark your potential! Explore examples of top-performing Airbnb properties in Saint-Barthélemy-d'Anjoubased on Trailing Twelve Month (TTM) revenue. Analyze their characteristics, revenue, occupancy rate, and ADR to understand what drives success in this market.
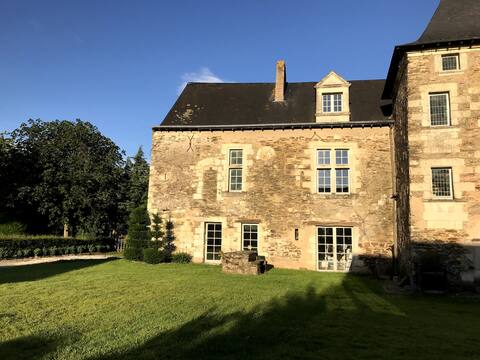
At the gates of Angers La Pignonnière, old Priory
Entire Place • 7 bedrooms
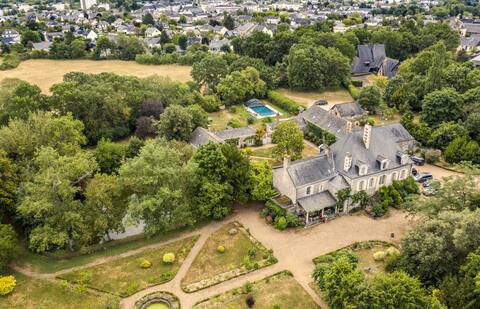
Les Rangeardières - Maison Familiale
Entire Place • 10 bedrooms

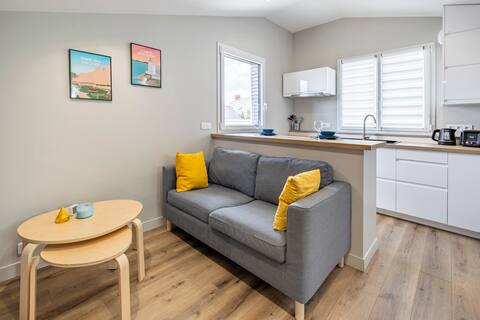
Apartment - 3 suites
Entire Place • 3 bedrooms
Chez Anne-Lise and Sébastien Air-conditioned accommodation
Entire Place • 1 bedroom
Renovated charming home
Entire Place • 1 bedroom
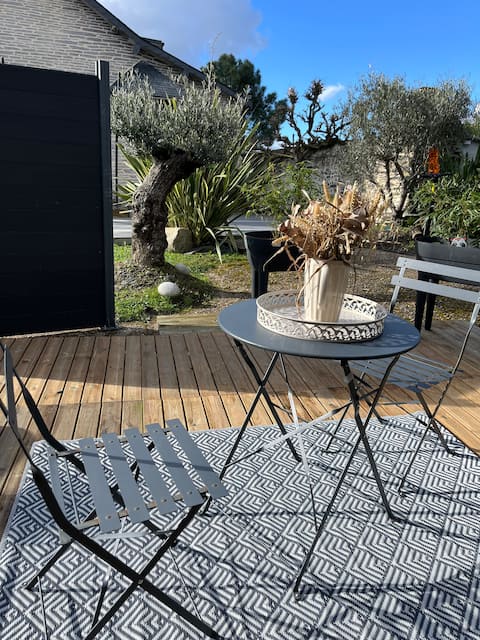
Le Patio: Studio with Outdoor
Entire Place • 1 bedroom
Note: Performance varies based on location, size, amenities, seasonality, and management quality. Data reflects the past 12 months.
Top Performing Airbnb Hosts in Saint-Barthélemy-d'Anjou (2025)
Learn from the best! This table showcases top-performing Airbnb hosts in Saint-Barthélemy-d'Anjou based on the number of properties managed and estimated total revenue over the past year. Analyze their scale and performance metrics.
| Host Name | Properties | Grossing Revenue | Stay Reviews | Avg Rating |
|---|---|---|---|---|
| Marie-Dominique | 1 | $51,711 | 5 | 5.00/5.0 |
| Host #260409147 | 1 | $34,022 | 2 | 0.00/5.0 |
| Karine | 1 | $27,796 | 71 | 4.99/5.0 |
| Sébastien | 1 | $16,948 | 69 | 4.94/5.0 |
| Anaïs | 1 | $15,344 | 21 | 4.90/5.0 |
| Sylvain | 1 | $15,299 | 156 | 4.94/5.0 |
| Cécilia | 1 | $11,810 | 24 | 4.92/5.0 |
| Host #461099195 | 2 | $10,132 | 25 | 4.68/5.0 |
| Charlotte | 2 | $9,458 | 9 | 4.67/5.0 |
| May | 1 | $8,928 | 98 | 4.99/5.0 |
Analyzing the strategies of top hosts, such as their property selection, pricing, and guest communication, can offer valuable lessons for optimizing your own Airbnb operations in Saint-Barthélemy-d'Anjou.
Dive Deeper: Advanced Saint-Barthélemy-d'Anjou STR Market Data (2025)
Ready to unlock more insights? AirROI provides access to advanced metrics and comprehensive Airbnb data for Saint-Barthélemy-d'Anjou. Explore detailed analytics beyond this report to refine your investment strategy, optimize pricing, and maximize your vacation rental profits.
Explore Advanced MetricsSaint-Barthélemy-d'Anjou Short-Term Rental Market Composition (2025): Property & Room Types
Room Type Distribution
Property Type Distribution
Market Composition Insights for Saint-Barthélemy-d'Anjou
- The Saint-Barthélemy-d'Anjou Airbnb market composition is heavily skewed towards Entire Home/Apt listings, which make up 72.7% of the 22 active rentals. This indicates strong guest preference for privacy and space.
- Looking at the property type distribution in Saint-Barthélemy-d'Anjou, House properties are the most common (59.1%), reflecting the local real estate landscape.
- Houses represent a significant 59.1% portion, catering likely to families or larger groups.
- The presence of 9.1% Hotel/Boutique listings indicates integration with traditional hospitality.
Saint-Barthélemy-d'Anjou Airbnb Room Capacity Analysis (2025): Bedroom Distribution
Distribution of Listings by Number of Bedrooms
Room Capacity Insights for Saint-Barthélemy-d'Anjou
- The dominant room capacity in Saint-Barthélemy-d'Anjou is 1 bedroom listings, making up 40.9% of the market. This suggests a strong demand for properties suitable for couples or solo travelers.
- Together, 1 bedroom and 5+ bedrooms properties represent 50.0% of the active Airbnb listings in Saint-Barthélemy-d'Anjou, indicating a high concentration in these sizes.
Saint-Barthélemy-d'Anjou Vacation Rental Guest Capacity Trends (2025)
Distribution of Listings by Guest Capacity
Guest Capacity Insights for Saint-Barthélemy-d'Anjou
- The most common guest capacity trend in Saint-Barthélemy-d'Anjou vacation rentals is listings accommodating 2 guests (40.9%). This suggests the primary traveler segment is likely couples or solo travelers.
- Properties designed for 2 guests and 5 guests dominate the Saint-Barthélemy-d'Anjou STR market, accounting for 50.0% of listings.
- A significant 40.9% of listings cater specifically to 1-2 guests, highlighting strong demand from couples and solo travelers in Saint-Barthélemy-d'Anjou.
- 13.6% of properties accommodate 6+ guests, serving the market segment for larger families or group travel in Saint-Barthélemy-d'Anjou.
- On average, properties in Saint-Barthélemy-d'Anjou are equipped to host 2.6 guests.
Saint-Barthélemy-d'Anjou Airbnb Booking Patterns (2025): Available vs. Booked Days
Available Days Distribution
Booked Days Distribution
Booking Pattern Insights for Saint-Barthélemy-d'Anjou
- The most common availability pattern in Saint-Barthélemy-d'Anjou falls within the 271-366 days range, representing 54.5% of listings. This suggests many properties have significant open periods on their calendars.
- Approximately 72.7% of listings show high availability (181+ days open annually), indicating potential for increased bookings or specific owner usage patterns.
- For booked days, the 31-90 days range is most frequent in Saint-Barthélemy-d'Anjou (36.4%), reflecting common guest stay durations or potential owner blocking patterns.
- A notable 27.2% of properties secure long booking periods (181+ days booked per year), highlighting successful long-term rental strategies or significant owner usage.
Saint-Barthélemy-d'Anjou Airbnb Minimum Stay Requirements Analysis
Distribution of Listings by Minimum Night Requirement
1 Night
10 listings
50% of total
2 Nights
5 listings
25% of total
3 Nights
3 listings
15% of total
4-6 Nights
2 listings
10% of total
Key Insights
- The most prevalent minimum stay requirement in Saint-Barthélemy-d'Anjou is 1 Night, adopted by 50% of listings. This highlights the market's preference for shorter, flexible bookings.
- A strong majority (75.0%) of the Saint-Barthélemy-d'Anjou Airbnb data shows acceptance of very short stays (1-2 nights), indicating a dynamic, high-turnover market.
Recommendations
- Align with the market by considering a 1 Night minimum stay, as 50% of Saint-Barthélemy-d'Anjou hosts use this setting.
- Adjust minimum nights based on seasonality – potentially shorter during low season and longer during peak demand periods in Saint-Barthélemy-d'Anjou.
Saint-Barthélemy-d'Anjou Airbnb Cancellation Policy Trends Analysis (2025)
Flexible
7 listings
36.8% of total
Moderate
7 listings
36.8% of total
Firm
2 listings
10.5% of total
Strict
3 listings
15.8% of total
Cancellation Policy Insights for Saint-Barthélemy-d'Anjou
- The prevailing Airbnb cancellation policy trend in Saint-Barthélemy-d'Anjou is Flexible, used by 36.8% of listings.
- The market strongly favors guest-friendly terms, with 73.6% of listings offering Flexible or Moderate policies. This suggests guests in Saint-Barthélemy-d'Anjou may expect booking flexibility.
Recommendations for Hosts
- Consider adopting a Flexible policy to align with the 36.8% market standard in Saint-Barthélemy-d'Anjou.
- Regularly review your cancellation policy against competitors and market demand shifts in Saint-Barthélemy-d'Anjou.
Saint-Barthélemy-d'Anjou STR Booking Lead Time Analysis (2025)
Average Booking Lead Time by Month
Booking Lead Time Insights for Saint-Barthélemy-d'Anjou
- The overall average booking lead time for vacation rentals in Saint-Barthélemy-d'Anjou is 31 days.
- Guests book furthest in advance for stays during July (average 85 days), likely coinciding with peak travel demand or local events.
- The shortest booking windows occur for stays in November (average 16 days), indicating more last-minute travel plans during this time.
- Seasonally, Summer (70 days avg.) sees the longest lead times, while Fall (24 days avg.) has the shortest, reflecting typical travel planning cycles.
Recommendations for Hosts
- Use the overall average lead time (31 days) as a baseline for your pricing and availability strategy in Saint-Barthélemy-d'Anjou.
- For July stays, consider implementing length-of-stay discounts or slightly higher rates for bookings made less than 85 days out to capitalize on advance planning.
- Target marketing efforts for the Summer season well in advance (at least 70 days) to capture early planners.
- Monitor your own booking lead times against these Saint-Barthélemy-d'Anjou averages to identify opportunities for dynamic pricing adjustments.
Popular & Essential Airbnb Amenities in Saint-Barthélemy-d'Anjou (2025)
Amenity Prevalence
Amenity Insights for Saint-Barthélemy-d'Anjou
- Essential amenities in Saint-Barthélemy-d'Anjou that guests expect include: Wifi, Heating. Lacking these (any) could significantly impact bookings.
- Popular amenities like Refrigerator, Essentials, Hot water are common but not universal. Offering these can provide a competitive edge.
Recommendations for Hosts
- Ensure your listing includes all essential amenities for Saint-Barthélemy-d'Anjou: Wifi, Heating.
- Prioritize adding missing essentials: Wifi, Heating.
- Consider adding popular differentiators like Refrigerator or Essentials to increase appeal.
- Highlight unique or less common amenities you offer (e.g., hot tub, dedicated workspace, EV charger) in your listing description and photos.
- Regularly check competitor amenities in Saint-Barthélemy-d'Anjou to stay competitive.
Saint-Barthélemy-d'Anjou Airbnb Guest Demographics & Profile Analysis (2025)
Guest Profile Summary for Saint-Barthélemy-d'Anjou
- The typical guest profile for Airbnb in Saint-Barthélemy-d'Anjou consists of primarily domestic travelers (95%), often arriving from nearby Paris, typically belonging to the Post-2000s (Gen Z/Alpha) group (50%), primarily speaking French or English.
- Domestic travelers account for 94.8% of guests.
- Key international markets include France (94.8%) and United Kingdom (1.4%).
- Top languages spoken are French (52.8%) followed by English (29.6%).
- A significant demographic segment is the Post-2000s (Gen Z/Alpha) group, representing 50% of guests.
Recommendations for Hosts
- Target domestic marketing efforts towards travelers from Paris and Angers.
- Tailor amenities and listing descriptions to appeal to the dominant Post-2000s (Gen Z/Alpha) demographic (e.g., highlight fast WiFi, smart home features, local guides).
- Highlight unique local experiences or amenities relevant to the primary guest profile.
- Consider seasonal promotions aligned with peak travel times for key origin markets.
Nearby Short-Term Rental Market Comparison
How does the Saint-Barthélemy-d'Anjou Airbnb market stack up against its neighbors? Compare key performance metrics like average monthly revenue, ADR, and occupancy rates in surrounding areas to understand the broader regional STR landscape.
| Market | Active Properties | Monthly Revenue | Daily Rate | Avg. Occupancy |
|---|---|---|---|---|
| Coteaux-sur-Loire | 19 | $3,328 | $270.00 | 41% |
| Moulins-le-Carbonnel | 11 | $3,213 | $320.85 | 35% |
| Villiers-sur-Loir | 10 | $2,967 | $216.51 | 41% |
| Artannes-sur-Indre | 21 | $2,949 | $275.91 | 41% |
| Vallon-sur-Gée | 11 | $2,913 | $379.01 | 30% |
| La Ferté-en-Ouche | 19 | $2,854 | $258.24 | 39% |
| Tourouvre au Perche | 31 | $2,842 | $237.49 | 43% |
| Bourneau | 11 | $2,747 | $442.07 | 35% |
| Nuaillé-d'Aunis | 10 | $2,741 | $373.83 | 37% |
| Ambillou | 18 | $2,701 | $370.97 | 28% |