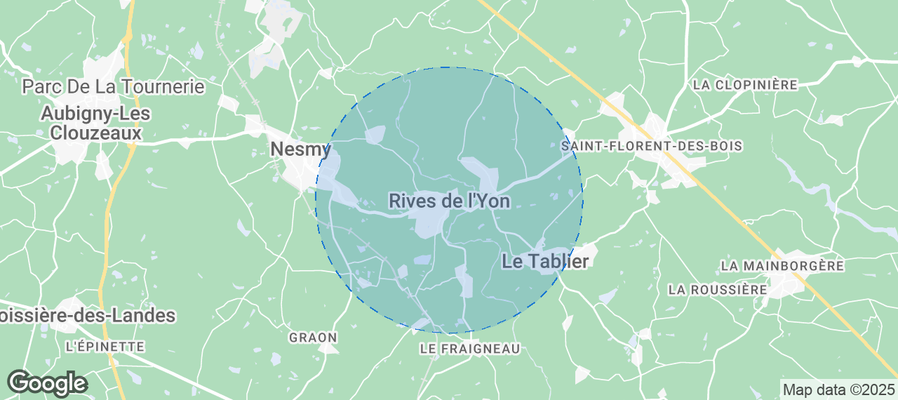
Rives-de-l'Yon Airbnb Market Analysis 2025: Short Term Rental Data & Vacation Rental Statistics in Pays de la Loire, France
Is Airbnb profitable in Rives-de-l'Yon in 2025? Explore comprehensive Airbnb analytics for Rives-de-l'Yon, Pays de la Loire, France to uncover income potential. This 2025 STR market report for Rives-de-l'Yon, based on AirROI data from April 2024 to March 2025, reveals key trends in the niche market of 17 active listings.
Whether you're considering an Airbnb investment in Rives-de-l'Yon, optimizing your existing vacation rental, or exploring rental arbitrage opportunities, understanding the Rives-de-l'Yon Airbnb data is crucial. Leveraging the low regulation environment is key to maximizing your short term rental income potential. Let's dive into the specifics.
Key Rives-de-l'Yon Airbnb Performance Metrics Overview
Monthly Airbnb Revenue Variations & Income Potential in Rives-de-l'Yon (2025)
Understanding the monthly revenue variations for Airbnb listings in Rives-de-l'Yon is key to maximizing your short term rental income potential. Seasonality significantly impacts earnings. Our analysis, based on data from the past 12 months, shows that the peak revenue month for STRs in Rives-de-l'Yon is typically August, while February often presents the lowest earnings, highlighting opportunities for strategic pricing adjustments during shoulder and low seasons. Explore the typical Airbnb income in Rives-de-l'Yon across different performance tiers:
- Best-in-class properties (Top 10%) achieve $3,138+ monthly, often utilizing dynamic pricing and superior guest experiences.
- Strong performing properties (Top 25%) earn $1,589 or more, indicating effective management and desirable locations/amenities.
- Typical properties (Median) generate around $912 per month, representing the average market performance.
- Entry-level properties (Bottom 25%) see earnings around $378, often with potential for optimization.
Average Monthly Airbnb Earnings Trend in Rives-de-l'Yon
Rives-de-l'Yon Airbnb Occupancy Rate Trends (2025)
Maximize your bookings by understanding the Rives-de-l'Yon STR occupancy trends. Seasonal demand shifts significantly influence how often properties are booked. Typically, Augustsees the highest demand (peak season occupancy), while March experiences the lowest (low season). Effective strategies, like adjusting minimum stays or offering promotions, can boost occupancy during slower periods. Here's how different property tiers perform in Rives-de-l'Yon:
- Best-in-class properties (Top 10%) achieve 70%+ occupancy, indicating high desirability and potentially optimized availability.
- Strong performing properties (Top 25%) maintain 49% or higher occupancy, suggesting good market fit and guest satisfaction.
- Typical properties (Median) have an occupancy rate around 28%.
- Entry-level properties (Bottom 25%) average 16% occupancy, potentially facing higher vacancy.
Average Monthly Occupancy Rate Trend in Rives-de-l'Yon
Average Daily Rate (ADR) Airbnb Trends in Rives-de-l'Yon (2025)
Effective short term rental pricing strategy in Rives-de-l'Yon involves understanding monthly ADR fluctuations. The Average Daily Rate (ADR) for Airbnb in Rives-de-l'Yon typically peaks in November and dips lowest during October. Leveraging Airbnb dynamic pricing tools or strategies based on this seasonality can significantly boost revenue. Here's a look at the typical nightly rates achieved:
- Best-in-class properties (Top 10%) command rates of $253+ per night, often due to premium features or locations.
- Strong performing properties (Top 25%) achieve nightly rates of $132 or more.
- Typical properties (Median) charge around $72 per night.
- Entry-level properties (Bottom 25%) earn around $50 per night.
Average Daily Rate (ADR) Trend by Month in Rives-de-l'Yon
Get Live Rives-de-l'Yon Market Intelligence 👇
Explore Real-time Analytics
Airbnb Seasonality Analysis & Trends in Rives-de-l'Yon (2025)
Peak Season (August, July, May)
- Revenue averages $1,986 per month
- Occupancy rates average 49.2%
- Daily rates average $115
Shoulder Season
- Revenue averages $1,252 per month
- Occupancy maintains around 32.7%
- Daily rates hold near $112
Low Season (January, February, November)
- Revenue drops to average $654 per month
- Occupancy decreases to average 25.2%
- Daily rates adjust to average $117
Seasonality Insights for Rives-de-l'Yon
- The Airbnb seasonality in Rives-de-l'Yon shows highly seasonal trends requiring careful strategy. While the sections above show seasonal averages, it's also insightful to look at the extremes:
- During the high season, the absolute peak month showcases Rives-de-l'Yon's highest earning potential, with monthly revenues capable of climbing to $2,281, occupancy reaching a high of 61.7%, and ADRs peaking at $122.
- Conversely, the slowest single month of the year, typically falling within the low season, marks the market's lowest point. In this month, revenue might dip to $607, occupancy could drop to 19.4%, and ADRs may adjust down to $109.
- Understanding both the seasonal averages and these monthly peaks and troughs in revenue, occupancy, and ADR is crucial for maximizing your Airbnb profit potential in Rives-de-l'Yon.
Seasonal Strategies for Maximizing Profit
- Peak Season: Maximize revenue through premium pricing and potentially longer minimum stays. Ensure high availability.
- Low Season: Offer competitive pricing, special promotions (e.g., extended stay discounts), and flexible cancellation policies. Target off-season travelers like remote workers or budget-conscious guests.
- Shoulder Seasons: Implement dynamic pricing that balances peak and low rates. Target weekend travelers or specific events. Offer slightly more flexible terms than peak season.
- Regularly analyze your own performance against these Rives-de-l'Yon seasonality benchmarks and adjust your pricing and availability strategy accordingly.
Best Areas for Airbnb Investment in Rives-de-l'Yon (2025)
Exploring the top neighborhoods for short-term rentals in Rives-de-l'Yon? This section highlights key areas, outlining why they are attractive for hosts and guests, along with notable local attractions. Consider these locations based on your target guest profile and investment strategy.
| Neighborhood / Area | Why Host Here? (Target Guests & Appeal) | Key Attractions & Landmarks |
|---|---|---|
| La Roche-sur-Yon | The capital of the Vendée department, known for its dynamic urban environment and rich history. It's an excellent place for visitors to explore French culture and local attractions. | Place Napoleon, Les Halles, Musee de l'Abbaye Sainte-Croix, Parc des Jardins de la Roche, La Roche-sur-Yon railway station |
| Les Sables-d'Olonne | A popular seaside town famous for its beautiful beaches and maritime heritage. This location is attractive for vacationers looking for sun, sand, and sea activities. | Les Plages des Sables d'Olonne, Zoo des Sables d'Olonne, Port Olona, Promenade Georges Clemenceau, Parc de la Folie |
| Saint-Gilles-Croix-de-Vie | A charming coastal town known for its fishing port and stunning beaches. An ideal spot for families and beachgoers during the summer months. | Plage de Boisvinet, Port de Saint-Gilles-Croix-de-Vie, Les Halles de Saint Gilles, La Pointe de la Banche, L'Île de la Vie |
| Brétignolles-sur-Mer | This seaside resort is known for its beautiful landscapes and outdoor activities, making it perfect for nature lovers and water sports enthusiasts. | Plage de Brétignolles, Golf de Brétignolles, Les Dunes de la petite Roche, L'Île de Boisvinet, Circuit des Marais |
| Talmont-Saint-Hilaire | A picturesque town located along the coastline with rich cultural heritage and proximity to beautiful natural reserves, ideal for nature tourists. | Château de Talmont, Plage de la ypalaise, La Guittière, L'Église Saint-Hilaire, Le Puy du Fou |
| Noirmoutier-en-l'Ile | A beautiful island known for its stunning beaches and unique charm, perfect for tourists seeking a serene getaway. | Plage des Soux, Château de Noirmoutier, Le vieux port de Noirmoutier, L'Herbaudière, Les marais salants |
| Sallertaine | A quaint village offering a glimpse into traditional French rural life, appealing to those looking for a peaceful retreat. | L'Eglise de Sallertaine, Le Jardin des Olfacties, Les marais de Sallertaine, Au Paradis de l'Escargot, L'Atelier de la Chaire |
| Saint-Jean-de-Monts | A resort town known for its extensive sandy beaches and family-friendly atmosphere, making it a sought-after summer destination. | Plage de Saint-Jean-de-Monts, Parc des Dunes, Les Pays de la Loire, La Thalasso de Saint-Jean, Aqua Land |
Understanding Airbnb License Requirements & STR Laws in Rives-de-l'Yon (2025)
While Rives-de-l'Yon, Pays de la Loire, France currently shows low STR regulations, specific Airbnb license requirements might still exist or change. Always verify the latest short term rental regulations and Airbnb license requirements directly with local government authorities for Rives-de-l'Yon to ensure full compliance before hosting.
(Source: AirROI data, 2025, finding no licensed listings among those analyzed)
Top Performing Airbnb Properties in Rives-de-l'Yon (2025)
Benchmark your potential! Explore examples of top-performing Airbnb properties in Rives-de-l'Yonbased on Trailing Twelve Month (TTM) revenue. Analyze their characteristics, revenue, occupancy rate, and ADR to understand what drives success in this market.

Beautiful 5* villa with private swimming pool park 2 ha
Entire Place • 5 bedrooms

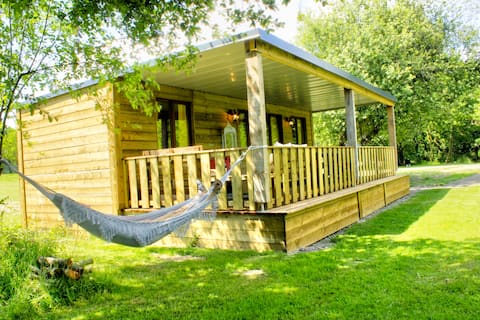
Luxe Lodge Safari Tent
Entire Place • 2 bedrooms

La maison aux petit bonheurs
Entire Place • 3 bedrooms

Le Logis du Bourg
Entire Place • 2 bedrooms
Nature and unusual chalet
Entire Place • 2 bedrooms
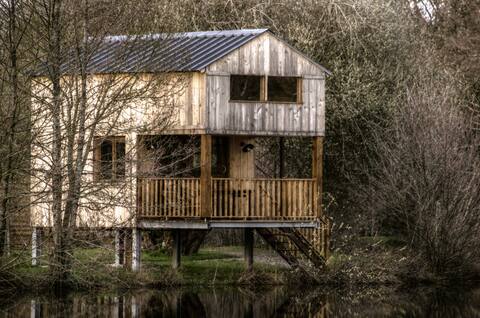
Chalet perché
Entire Place • 2 bedrooms
Note: Performance varies based on location, size, amenities, seasonality, and management quality. Data reflects the past 12 months.
Top Performing Airbnb Hosts in Rives-de-l'Yon (2025)
Learn from the best! This table showcases top-performing Airbnb hosts in Rives-de-l'Yon based on the number of properties managed and estimated total revenue over the past year. Analyze their scale and performance metrics.
| Host Name | Properties | Grossing Revenue | Stay Reviews | Avg Rating |
|---|---|---|---|---|
| Mélanie | 3 | $58,957 | 16 | 3.33/5.0 |
| Soliane La Clé Chaumoise | 1 | $37,140 | 10 | 5.00/5.0 |
| Jean-François | 2 | $22,220 | 586 | 4.95/5.0 |
| Violetta Philippe | 1 | $21,914 | 21 | 5.00/5.0 |
| Jean Philippe | 2 | $20,467 | 180 | 4.63/5.0 |
| Brigitte | 1 | $18,027 | 16 | 4.94/5.0 |
| Nathalie | 4 | $12,386 | 82 | 4.66/5.0 |
| Laetitia | 1 | $7,276 | 55 | 4.93/5.0 |
| Lea | 1 | $2,789 | 44 | 4.98/5.0 |
| Joseph | 1 | $1,910 | 15 | 4.53/5.0 |
Analyzing the strategies of top hosts, such as their property selection, pricing, and guest communication, can offer valuable lessons for optimizing your own Airbnb operations in Rives-de-l'Yon.
Dive Deeper: Advanced Rives-de-l'Yon STR Market Data (2025)
Ready to unlock more insights? AirROI provides access to advanced metrics and comprehensive Airbnb data for Rives-de-l'Yon. Explore detailed analytics beyond this report to refine your investment strategy, optimize pricing, and maximize your vacation rental profits.
Explore Advanced MetricsRives-de-l'Yon Short-Term Rental Market Composition (2025): Property & Room Types
Room Type Distribution
Property Type Distribution
Market Composition Insights for Rives-de-l'Yon
- The Rives-de-l'Yon Airbnb market composition is heavily skewed towards Entire Home/Apt listings, which make up 82.4% of the 17 active rentals. This indicates strong guest preference for privacy and space.
- Looking at the property type distribution in Rives-de-l'Yon, House properties are the most common (35.3%), reflecting the local real estate landscape.
- Houses represent a significant 35.3% portion, catering likely to families or larger groups.
- The presence of 11.8% Hotel/Boutique listings indicates integration with traditional hospitality.
Rives-de-l'Yon Airbnb Room Capacity Analysis (2025): Bedroom Distribution
Distribution of Listings by Number of Bedrooms
Room Capacity Insights for Rives-de-l'Yon
- The dominant room capacity in Rives-de-l'Yon is 2 bedrooms listings, making up 41.2% of the market. This suggests a strong demand for properties suitable for couples or solo travelers.
- Together, 2 bedrooms and 1 bedroom properties represent 64.7% of the active Airbnb listings in Rives-de-l'Yon, indicating a high concentration in these sizes.
Rives-de-l'Yon Vacation Rental Guest Capacity Trends (2025)
Distribution of Listings by Guest Capacity
Guest Capacity Insights for Rives-de-l'Yon
- The most common guest capacity trend in Rives-de-l'Yon vacation rentals is listings accommodating 4 guests (23.5%). This suggests the primary traveler segment is likely small families or groups.
- Properties designed for 4 guests and 2 guests dominate the Rives-de-l'Yon STR market, accounting for 41.1% of listings.
- 29.4% of properties accommodate 6+ guests, serving the market segment for larger families or group travel in Rives-de-l'Yon.
- On average, properties in Rives-de-l'Yon are equipped to host 3.9 guests.
Rives-de-l'Yon Airbnb Booking Patterns (2025): Available vs. Booked Days
Available Days Distribution
Booked Days Distribution
Booking Pattern Insights for Rives-de-l'Yon
- The most common availability pattern in Rives-de-l'Yon falls within the 271-366 days range, representing 52.9% of listings. This suggests many properties have significant open periods on their calendars.
- Approximately 88.2% of listings show high availability (181+ days open annually), indicating potential for increased bookings or specific owner usage patterns.
- For booked days, the 31-90 days range is most frequent in Rives-de-l'Yon (47.1%), reflecting common guest stay durations or potential owner blocking patterns.
- A notable 11.8% of properties secure long booking periods (181+ days booked per year), highlighting successful long-term rental strategies or significant owner usage.
Rives-de-l'Yon Airbnb Minimum Stay Requirements Analysis
Distribution of Listings by Minimum Night Requirement
1 Night
8 listings
47.1% of total
2 Nights
4 listings
23.5% of total
3 Nights
2 listings
11.8% of total
4-6 Nights
1 listings
5.9% of total
30+ Nights
2 listings
11.8% of total
Key Insights
- The most prevalent minimum stay requirement in Rives-de-l'Yon is 1 Night, adopted by 47.1% of listings. This highlights the market's preference for shorter, flexible bookings.
- A strong majority (70.6%) of the Rives-de-l'Yon Airbnb data shows acceptance of very short stays (1-2 nights), indicating a dynamic, high-turnover market.
- A significant segment (11.8%) caters to monthly stays (30+ nights) in Rives-de-l'Yon, pointing to opportunities in the extended-stay market.
Recommendations
- Align with the market by considering a 1 Night minimum stay, as 47.1% of Rives-de-l'Yon hosts use this setting.
- Explore offering discounts for stays of 30+ nights to attract the 11.8% of the market seeking extended stays.
- Adjust minimum nights based on seasonality – potentially shorter during low season and longer during peak demand periods in Rives-de-l'Yon.
Rives-de-l'Yon Airbnb Cancellation Policy Trends Analysis (2025)
Flexible
5 listings
31.3% of total
Moderate
3 listings
18.8% of total
Firm
1 listings
6.3% of total
Strict
7 listings
43.8% of total
Cancellation Policy Insights for Rives-de-l'Yon
- The prevailing Airbnb cancellation policy trend in Rives-de-l'Yon is Strict, used by 43.8% of listings.
- A majority (50.1%) of hosts in Rives-de-l'Yon utilize Firm or Strict policies, indicating a market where hosts prioritize booking security.
Recommendations for Hosts
- Consider adopting a Strict policy to align with the 43.8% market standard in Rives-de-l'Yon.
- With 43.8% using Strict terms, this is a viable option in Rives-de-l'Yon, particularly for high-value properties or during peak demand periods.
- Regularly review your cancellation policy against competitors and market demand shifts in Rives-de-l'Yon.
Rives-de-l'Yon STR Booking Lead Time Analysis (2025)
Average Booking Lead Time by Month
Booking Lead Time Insights for Rives-de-l'Yon
- The overall average booking lead time for vacation rentals in Rives-de-l'Yon is 49 days.
- Guests book furthest in advance for stays during August (average 70 days), likely coinciding with peak travel demand or local events.
- The shortest booking windows occur for stays in February (average 18 days), indicating more last-minute travel plans during this time.
- Seasonally, Fall (65 days avg.) sees the longest lead times, while Winter (21 days avg.) has the shortest, reflecting typical travel planning cycles.
Recommendations for Hosts
- Use the overall average lead time (49 days) as a baseline for your pricing and availability strategy in Rives-de-l'Yon.
- For August stays, consider implementing length-of-stay discounts or slightly higher rates for bookings made less than 70 days out to capitalize on advance planning.
- Target marketing efforts for the Fall season well in advance (at least 65 days) to capture early planners.
- Monitor your own booking lead times against these Rives-de-l'Yon averages to identify opportunities for dynamic pricing adjustments.
Popular & Essential Airbnb Amenities in Rives-de-l'Yon (2025)
Amenity Prevalence
Amenity Insights for Rives-de-l'Yon
- Essential amenities in Rives-de-l'Yon that guests expect include: Heating, Kitchen. Lacking these (any) could significantly impact bookings.
- Popular amenities like Dishes and silverware, Free parking on premises, Hot water are common but not universal. Offering these can provide a competitive edge.
- Warning: Wifi is not universally provided but is considered essential globally. Ensure reliable Wifi is offered.
Recommendations for Hosts
- Ensure your listing includes all essential amenities for Rives-de-l'Yon: Heating, Kitchen.
- Consider adding popular differentiators like Dishes and silverware or Free parking on premises to increase appeal.
- Highlight unique or less common amenities you offer (e.g., hot tub, dedicated workspace, EV charger) in your listing description and photos.
- Regularly check competitor amenities in Rives-de-l'Yon to stay competitive.
Rives-de-l'Yon Airbnb Guest Demographics & Profile Analysis (2025)
Guest Profile Summary for Rives-de-l'Yon
- The typical guest profile for Airbnb in Rives-de-l'Yon consists of primarily domestic travelers (92%), often arriving from nearby Paris, typically belonging to the Post-2000s (Gen Z/Alpha) group (50%), primarily speaking French or English.
- Domestic travelers account for 92.2% of guests.
- Key international markets include France (92.2%) and United Kingdom (4.3%).
- Top languages spoken are French (50.5%) followed by English (28.7%).
- A significant demographic segment is the Post-2000s (Gen Z/Alpha) group, representing 50% of guests.
Recommendations for Hosts
- Target domestic marketing efforts towards travelers from Paris and Toulouse.
- Tailor amenities and listing descriptions to appeal to the dominant Post-2000s (Gen Z/Alpha) demographic (e.g., highlight fast WiFi, smart home features, local guides).
- Highlight unique local experiences or amenities relevant to the primary guest profile.
- Consider seasonal promotions aligned with peak travel times for key origin markets.
Nearby Short-Term Rental Market Comparison
How does the Rives-de-l'Yon Airbnb market stack up against its neighbors? Compare key performance metrics like average monthly revenue, ADR, and occupancy rates in surrounding areas to understand the broader regional STR landscape.
| Market | Active Properties | Monthly Revenue | Daily Rate | Avg. Occupancy |
|---|---|---|---|---|
| Vallon-sur-Gée | 11 | $2,913 | $379.01 | 30% |
| Bourneau | 11 | $2,747 | $442.07 | 35% |
| Nuaillé-d'Aunis | 10 | $2,741 | $373.83 | 37% |
| Le Bois-Plage-en-Ré | 303 | $2,528 | $284.63 | 45% |
| Chambellay | 11 | $2,525 | $255.24 | 34% |
| Sainte-Florence | 10 | $2,445 | $233.78 | 46% |
| Saint-Hippolyte | 10 | $2,443 | $204.98 | 44% |
| Abzac | 12 | $2,415 | $349.03 | 36% |
| La Flotte | 396 | $2,382 | $236.53 | 46% |
| Saint-Georges-des-Coteaux | 12 | $2,335 | $187.61 | 43% |