Pont-l'Abbé-d'Arnoult Airbnb Market Analysis 2025: Short Term Rental Data & Vacation Rental Statistics in Nouvelle-Aquitaine, France
Is Airbnb profitable in Pont-l'Abbé-d'Arnoult in 2025? Explore comprehensive Airbnb analytics for Pont-l'Abbé-d'Arnoult, Nouvelle-Aquitaine, France to uncover income potential. This 2025 STR market report for Pont-l'Abbé-d'Arnoult, based on AirROI data from April 2024 to March 2025, reveals key trends in the niche market of 18 active listings.
Whether you're considering an Airbnb investment in Pont-l'Abbé-d'Arnoult, optimizing your existing vacation rental, or exploring rental arbitrage opportunities, understanding the Pont-l'Abbé-d'Arnoult Airbnb data is crucial. Understanding the local regulations is key to maximizing your short term rental income potential. Let's dive into the specifics.
Key Pont-l'Abbé-d'Arnoult Airbnb Performance Metrics Overview
Monthly Airbnb Revenue Variations & Income Potential in Pont-l'Abbé-d'Arnoult (2025)
Understanding the monthly revenue variations for Airbnb listings in Pont-l'Abbé-d'Arnoult is key to maximizing your short term rental income potential. Seasonality significantly impacts earnings. Our analysis, based on data from the past 12 months, shows that the peak revenue month for STRs in Pont-l'Abbé-d'Arnoult is typically August, while November often presents the lowest earnings, highlighting opportunities for strategic pricing adjustments during shoulder and low seasons. Explore the typical Airbnb income in Pont-l'Abbé-d'Arnoult across different performance tiers:
- Best-in-class properties (Top 10%) achieve $1,919+ monthly, often utilizing dynamic pricing and superior guest experiences.
- Strong performing properties (Top 25%) earn $1,283 or more, indicating effective management and desirable locations/amenities.
- Typical properties (Median) generate around $822 per month, representing the average market performance.
- Entry-level properties (Bottom 25%) see earnings around $458, often with potential for optimization.
Average Monthly Airbnb Earnings Trend in Pont-l'Abbé-d'Arnoult
Pont-l'Abbé-d'Arnoult Airbnb Occupancy Rate Trends (2025)
Maximize your bookings by understanding the Pont-l'Abbé-d'Arnoult STR occupancy trends. Seasonal demand shifts significantly influence how often properties are booked. Typically, Augustsees the highest demand (peak season occupancy), while November experiences the lowest (low season). Effective strategies, like adjusting minimum stays or offering promotions, can boost occupancy during slower periods. Here's how different property tiers perform in Pont-l'Abbé-d'Arnoult:
- Best-in-class properties (Top 10%) achieve 85%+ occupancy, indicating high desirability and potentially optimized availability.
- Strong performing properties (Top 25%) maintain 62% or higher occupancy, suggesting good market fit and guest satisfaction.
- Typical properties (Median) have an occupancy rate around 30%.
- Entry-level properties (Bottom 25%) average 12% occupancy, potentially facing higher vacancy.
Average Monthly Occupancy Rate Trend in Pont-l'Abbé-d'Arnoult
Average Daily Rate (ADR) Airbnb Trends in Pont-l'Abbé-d'Arnoult (2025)
Effective short term rental pricing strategy in Pont-l'Abbé-d'Arnoult involves understanding monthly ADR fluctuations. The Average Daily Rate (ADR) for Airbnb in Pont-l'Abbé-d'Arnoult typically peaks in January and dips lowest during September. Leveraging Airbnb dynamic pricing tools or strategies based on this seasonality can significantly boost revenue. Here's a look at the typical nightly rates achieved:
- Best-in-class properties (Top 10%) command rates of $133+ per night, often due to premium features or locations.
- Strong performing properties (Top 25%) achieve nightly rates of $102 or more.
- Typical properties (Median) charge around $74 per night.
- Entry-level properties (Bottom 25%) earn around $57 per night.
Average Daily Rate (ADR) Trend by Month in Pont-l'Abbé-d'Arnoult
Get Live Pont-l'Abbé-d'Arnoult Market Intelligence 👇

Explore Real-time Analytics
Airbnb Seasonality Analysis & Trends in Pont-l'Abbé-d'Arnoult (2025)
Peak Season (August, June, July)
- Revenue averages $1,301 per month
- Occupancy rates average 46.7%
- Daily rates average $81
Shoulder Season
- Revenue averages $970 per month
- Occupancy maintains around 38.1%
- Daily rates hold near $81
Low Season (February, March, November)
- Revenue drops to average $584 per month
- Occupancy decreases to average 28.9%
- Daily rates adjust to average $83
Seasonality Insights for Pont-l'Abbé-d'Arnoult
- The Airbnb seasonality in Pont-l'Abbé-d'Arnoult shows highly seasonal trends requiring careful strategy. While the sections above show seasonal averages, it's also insightful to look at the extremes:
- During the high season, the absolute peak month showcases Pont-l'Abbé-d'Arnoult's highest earning potential, with monthly revenues capable of climbing to $1,521, occupancy reaching a high of 57.0%, and ADRs peaking at $84.
- Conversely, the slowest single month of the year, typically falling within the low season, marks the market's lowest point. In this month, revenue might dip to $483, occupancy could drop to 25.0%, and ADRs may adjust down to $79.
- Understanding both the seasonal averages and these monthly peaks and troughs in revenue, occupancy, and ADR is crucial for maximizing your Airbnb profit potential in Pont-l'Abbé-d'Arnoult.
Seasonal Strategies for Maximizing Profit
- Peak Season: Maximize revenue through premium pricing and potentially longer minimum stays. Ensure high availability.
- Low Season: Offer competitive pricing, special promotions (e.g., extended stay discounts), and flexible cancellation policies. Target off-season travelers like remote workers or budget-conscious guests.
- Shoulder Seasons: Implement dynamic pricing that balances peak and low rates. Target weekend travelers or specific events. Offer slightly more flexible terms than peak season.
- Regularly analyze your own performance against these Pont-l'Abbé-d'Arnoult seasonality benchmarks and adjust your pricing and availability strategy accordingly.
Best Areas for Airbnb Investment in Pont-l'Abbé-d'Arnoult (2025)
Exploring the top neighborhoods for short-term rentals in Pont-l'Abbé-d'Arnoult? This section highlights key areas, outlining why they are attractive for hosts and guests, along with notable local attractions. Consider these locations based on your target guest profile and investment strategy.
| Neighborhood / Area | Why Host Here? (Target Guests & Appeal) | Key Attractions & Landmarks |
|---|---|---|
| Centre-ville | The town center of Pont-l'Abbé-d'Arnoult offers a charming atmosphere with shops, cafes, and amenities. It is popular with visitors wanting to experience local culture and cuisine. | Local markets, Café de la Plage, St. Charles Church, Artisan shops, Town square events |
| Parc Naturel Régional de la Gironde et des Landes de Gascogne | A natural park nearby that attracts nature lovers and outdoor enthusiasts. Ideal for guests looking to explore the great outdoors, hiking, and local wildlife. | Hiking trails, Picnic areas, Wildlife observation, Biking paths |
| Pêche et Nature | A picturesque area known for fishing and nature activities. Appeals to families and individuals looking for relaxation and water activities. | Fishing spots, Boating, Picnic areas, Scenic views |
| Château de la Roche-Courbon | Historic site that draws visitors interested in architecture and history. Offers a unique cultural experience and beautiful gardens. | Château tours, Gardens, Historic exhibits, Events |
| Plages de Marennes-Oléron | Proximity to some of the region's best beaches, perfect for summer visitors. Ideal for families looking for beach activities and relaxation. | Beach access, Water sports, Sunbathing, Beachside restaurants |
| Cognac wineries | Near the famous Cognac region, attracting wine lovers and tourists interested in tours and tastings. Perfect for weekend getaways. | Cognac distilleries, Wine tours, Tasting events, Historic towns nearby |
| Île d'Oléron | A beautiful island close by with stunning beaches and a laid-back atmosphere. Popular among vacationers seeking a coastal retreat. | Beaches, Cycling routes, Local seafood restaurants, Nature reserves |
| Cité de l'Huître | A unique attraction that gives insight into oyster farming in the region. Draws visitors interested in gastronomy and local culture. | Oyster farm tours, Tasting sessions, Educational exhibits |
Understanding Airbnb License Requirements & STR Laws in Pont-l'Abbé-d'Arnoult (2025)
With 11% of listings showing registration in 2025, understanding potential Airbnb license requirements is crucial in Pont-l'Abbé-d'Arnoult. Always verify the latest short term rental regulations and Airbnb license requirements directly with local government authorities for Pont-l'Abbé-d'Arnoult to ensure full compliance before hosting.
(Source: AirROI data, 2025, based on 11% licensed listings)
Top Performing Airbnb Properties in Pont-l'Abbé-d'Arnoult (2025)
Benchmark your potential! Explore examples of top-performing Airbnb properties in Pont-l'Abbé-d'Arnoultbased on Trailing Twelve Month (TTM) revenue. Analyze their characteristics, revenue, occupancy rate, and ADR to understand what drives success in this market.

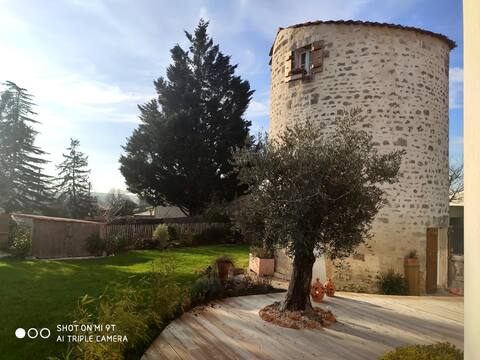
Stone village house with inner courtyard
Entire Place • 3 bedrooms
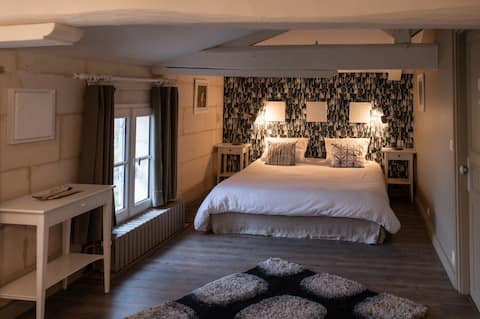
MOULIN DU CLOS DE LA GARENNE
Entire Place • 1 bedroom
La Tillaie, Maison d'Hôtes entre Saintes et Oléron
Private Room • 1 bedroom
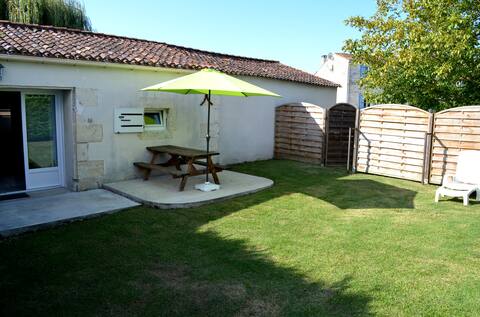
Logis des Allards
Entire Place • 1 bedroom
lovely and cozy little house
Private Room • 2 bedrooms

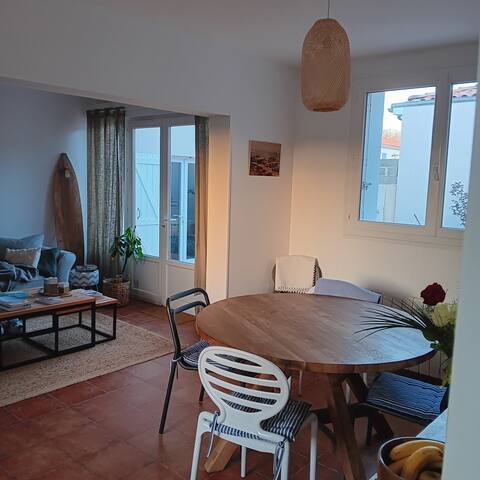
"In the right place" Guest House with swimming pool
Entire Place • 1 bedroom
Note: Performance varies based on location, size, amenities, seasonality, and management quality. Data reflects the past 12 months.
Top Performing Airbnb Hosts in Pont-l'Abbé-d'Arnoult (2025)
Learn from the best! This table showcases top-performing Airbnb hosts in Pont-l'Abbé-d'Arnoult based on the number of properties managed and estimated total revenue over the past year. Analyze their scale and performance metrics.
| Host Name | Properties | Grossing Revenue | Stay Reviews | Avg Rating |
|---|---|---|---|---|
| Host #113800773 | 3 | $26,512 | 55 | 4.97/5.0 |
| Elodie | 2 | $17,138 | 21 | 5.00/5.0 |
| Claire Et Laurent | 1 | $14,762 | 41 | 4.95/5.0 |
| Philippe | 1 | $13,775 | 61 | 5.00/5.0 |
| Hélène | 1 | $11,559 | 342 | 4.80/5.0 |
| Nadine | 1 | $10,012 | 21 | 5.00/5.0 |
| Fanny | 1 | $9,267 | 3 | 5.00/5.0 |
| Rebecca | 1 | $9,132 | 125 | 4.87/5.0 |
| Christelle | 1 | $7,645 | 98 | 4.86/5.0 |
| Edwige | 3 | $6,405 | 32 | 3.27/5.0 |
Analyzing the strategies of top hosts, such as their property selection, pricing, and guest communication, can offer valuable lessons for optimizing your own Airbnb operations in Pont-l'Abbé-d'Arnoult.
Dive Deeper: Advanced Pont-l'Abbé-d'Arnoult STR Market Data (2025)
Ready to unlock more insights? AirROI provides access to advanced metrics and comprehensive Airbnb data for Pont-l'Abbé-d'Arnoult. Explore detailed analytics beyond this report to refine your investment strategy, optimize pricing, and maximize your vacation rental profits.
Explore Advanced MetricsPont-l'Abbé-d'Arnoult Short-Term Rental Market Composition (2025): Property & Room Types
Room Type Distribution
Property Type Distribution
Market Composition Insights for Pont-l'Abbé-d'Arnoult
- The Pont-l'Abbé-d'Arnoult Airbnb market composition is heavily skewed towards Entire Home/Apt listings, which make up 50% of the 18 active rentals. This indicates strong guest preference for privacy and space.
- However, a notable 33.3% share for Private Rooms suggests opportunities for budget-conscious travelers or hosts renting out spare rooms.
- Looking at the property type distribution in Pont-l'Abbé-d'Arnoult, House properties are the most common (55.6%), reflecting the local real estate landscape.
- Houses represent a significant 55.6% portion, catering likely to families or larger groups.
- The presence of 27.8% Hotel/Boutique listings indicates integration with traditional hospitality.
Pont-l'Abbé-d'Arnoult Airbnb Room Capacity Analysis (2025): Bedroom Distribution
Distribution of Listings by Number of Bedrooms
Room Capacity Insights for Pont-l'Abbé-d'Arnoult
- The dominant room capacity in Pont-l'Abbé-d'Arnoult is 1 bedroom listings, making up 61.1% of the market. This suggests a strong demand for properties suitable for couples or solo travelers.
- Together, 1 bedroom and 3 bedrooms properties represent 77.8% of the active Airbnb listings in Pont-l'Abbé-d'Arnoult, indicating a high concentration in these sizes.
- With over half the market (61.1%) consisting of studios or 1-bedroom units, Pont-l'Abbé-d'Arnoult is particularly well-suited for individuals or couples.
Pont-l'Abbé-d'Arnoult Vacation Rental Guest Capacity Trends (2025)
Distribution of Listings by Guest Capacity
Guest Capacity Insights for Pont-l'Abbé-d'Arnoult
- The most common guest capacity trend in Pont-l'Abbé-d'Arnoult vacation rentals is listings accommodating 2 guests (38.9%). This suggests the primary traveler segment is likely couples or solo travelers.
- Properties designed for 2 guests and 3 guests dominate the Pont-l'Abbé-d'Arnoult STR market, accounting for 55.6% of listings.
- 16.7% of properties accommodate 6+ guests, serving the market segment for larger families or group travel in Pont-l'Abbé-d'Arnoult.
- On average, properties in Pont-l'Abbé-d'Arnoult are equipped to host 2.5 guests.
Pont-l'Abbé-d'Arnoult Airbnb Booking Patterns (2025): Available vs. Booked Days
Available Days Distribution
Booked Days Distribution
Booking Pattern Insights for Pont-l'Abbé-d'Arnoult
- The most common availability pattern in Pont-l'Abbé-d'Arnoult falls within the 271-366 days range, representing 55.6% of listings. This suggests many properties have significant open periods on their calendars.
- Approximately 94.5% of listings show high availability (181+ days open annually), indicating potential for increased bookings or specific owner usage patterns.
- For booked days, the 91-180 days range is most frequent in Pont-l'Abbé-d'Arnoult (44.4%), reflecting common guest stay durations or potential owner blocking patterns.
- A notable 5.6% of properties secure long booking periods (181+ days booked per year), highlighting successful long-term rental strategies or significant owner usage.
Pont-l'Abbé-d'Arnoult Airbnb Minimum Stay Requirements Analysis
Distribution of Listings by Minimum Night Requirement
1 Night
5 listings
29.4% of total
2 Nights
9 listings
52.9% of total
3 Nights
1 listings
5.9% of total
4-6 Nights
1 listings
5.9% of total
30+ Nights
1 listings
5.9% of total
Key Insights
- The most prevalent minimum stay requirement in Pont-l'Abbé-d'Arnoult is 2 Nights, adopted by 52.9% of listings. This highlights the market's preference for shorter, flexible bookings.
- A strong majority (82.3%) of the Pont-l'Abbé-d'Arnoult Airbnb data shows acceptance of very short stays (1-2 nights), indicating a dynamic, high-turnover market.
Recommendations
- Align with the market by considering a 2 Nights minimum stay, as 52.9% of Pont-l'Abbé-d'Arnoult hosts use this setting.
- If feasible, allowing 1-night stays, especially midweek or during low season, could capture last-minute bookings, as only 29.4% currently do.
- Explore offering discounts for stays of 30+ nights to attract the 5.9% of the market seeking extended stays.
- Adjust minimum nights based on seasonality – potentially shorter during low season and longer during peak demand periods in Pont-l'Abbé-d'Arnoult.
Pont-l'Abbé-d'Arnoult Airbnb Cancellation Policy Trends Analysis (2025)
Flexible
7 listings
41.2% of total
Moderate
5 listings
29.4% of total
Firm
4 listings
23.5% of total
Strict
1 listings
5.9% of total
Cancellation Policy Insights for Pont-l'Abbé-d'Arnoult
- The prevailing Airbnb cancellation policy trend in Pont-l'Abbé-d'Arnoult is Flexible, used by 41.2% of listings.
- The market strongly favors guest-friendly terms, with 70.6% of listings offering Flexible or Moderate policies. This suggests guests in Pont-l'Abbé-d'Arnoult may expect booking flexibility.
- Strict cancellation policies are quite rare (5.9%), potentially making listings with this policy less competitive unless justified by high demand or property type.
Recommendations for Hosts
- Consider adopting a Flexible policy to align with the 41.2% market standard in Pont-l'Abbé-d'Arnoult.
- Using a Strict policy might deter some guests, as only 5.9% of listings use it. Evaluate if potential revenue protection outweighs possible lower booking rates.
- Regularly review your cancellation policy against competitors and market demand shifts in Pont-l'Abbé-d'Arnoult.
Pont-l'Abbé-d'Arnoult STR Booking Lead Time Analysis (2025)
Average Booking Lead Time by Month
Booking Lead Time Insights for Pont-l'Abbé-d'Arnoult
- The overall average booking lead time for vacation rentals in Pont-l'Abbé-d'Arnoult is 49 days.
- Guests book furthest in advance for stays during May (average 110 days), likely coinciding with peak travel demand or local events.
- The shortest booking windows occur for stays in March (average 21 days), indicating more last-minute travel plans during this time.
- Seasonally, Summer (82 days avg.) sees the longest lead times, while Winter (42 days avg.) has the shortest, reflecting typical travel planning cycles.
Recommendations for Hosts
- Use the overall average lead time (49 days) as a baseline for your pricing and availability strategy in Pont-l'Abbé-d'Arnoult.
- For May stays, consider implementing length-of-stay discounts or slightly higher rates for bookings made less than 110 days out to capitalize on advance planning.
- Target marketing efforts for the Summer season well in advance (at least 82 days) to capture early planners.
- Monitor your own booking lead times against these Pont-l'Abbé-d'Arnoult averages to identify opportunities for dynamic pricing adjustments.
Popular & Essential Airbnb Amenities in Pont-l'Abbé-d'Arnoult (2025)
Amenity Prevalence
Amenity Insights for Pont-l'Abbé-d'Arnoult
- Popular amenities like Hangers, Heating, Kitchen are common but not universal. Offering these can provide a competitive edge.
- Warning: Wifi is not universally provided but is considered essential globally. Ensure reliable Wifi is offered.
Recommendations for Hosts
- Consider adding popular differentiators like Hangers or Heating to increase appeal.
- Highlight unique or less common amenities you offer (e.g., hot tub, dedicated workspace, EV charger) in your listing description and photos.
- Regularly check competitor amenities in Pont-l'Abbé-d'Arnoult to stay competitive.
Pont-l'Abbé-d'Arnoult Airbnb Guest Demographics & Profile Analysis (2025)
Guest Profile Summary for Pont-l'Abbé-d'Arnoult
- The typical guest profile for Airbnb in Pont-l'Abbé-d'Arnoult consists of primarily domestic travelers (85%), often arriving from nearby Paris, typically belonging to the Post-2000s (Gen Z/Alpha) group (50%), primarily speaking French or English.
- Domestic travelers account for 84.6% of guests.
- Key international markets include France (84.6%) and United Kingdom (4.2%).
- Top languages spoken are French (48.4%) followed by English (34.4%).
- A significant demographic segment is the Post-2000s (Gen Z/Alpha) group, representing 50% of guests.
Recommendations for Hosts
- Target domestic marketing efforts towards travelers from Paris and Bordeaux.
- Tailor amenities and listing descriptions to appeal to the dominant Post-2000s (Gen Z/Alpha) demographic (e.g., highlight fast WiFi, smart home features, local guides).
- Highlight unique local experiences or amenities relevant to the primary guest profile.
- Consider seasonal promotions aligned with peak travel times for key origin markets.
Nearby Short-Term Rental Market Comparison
How does the Pont-l'Abbé-d'Arnoult Airbnb market stack up against its neighbors? Compare key performance metrics like average monthly revenue, ADR, and occupancy rates in surrounding areas to understand the broader regional STR landscape.
| Market | Active Properties | Monthly Revenue | Daily Rate | Avg. Occupancy |
|---|---|---|---|---|
| Saint-Laurent-des-Combes | 11 | $3,526 | $706.18 | 23% |
| Astaffort | 10 | $3,393 | $314.20 | 35% |
| Cénac | 18 | $2,773 | $268.58 | 53% |
| Bourneau | 11 | $2,747 | $442.07 | 35% |
| Nuaillé-d'Aunis | 10 | $2,741 | $373.83 | 37% |
| Cérons | 11 | $2,635 | $196.16 | 39% |
| Galgon | 12 | $2,599 | $210.34 | 48% |
| Eynesse | 14 | $2,564 | $282.87 | 36% |
| Le Bois-Plage-en-Ré | 303 | $2,528 | $284.63 | 45% |
| Le Grand-Pressigny | 11 | $2,511 | $266.72 | 31% |