L'Île-Saint-Denis Airbnb Market Analysis 2025: Short Term Rental Data & Vacation Rental Statistics in Ile-de-France, France
Is Airbnb profitable in L'Île-Saint-Denis in 2025? Explore comprehensive Airbnb analytics for L'Île-Saint-Denis, Ile-de-France, France to uncover income potential. This 2025 STR market report for L'Île-Saint-Denis, based on AirROI data from April 2024 to March 2025, reveals key trends in the niche market of 68 active listings.
Whether you're considering an Airbnb investment in L'Île-Saint-Denis, optimizing your existing vacation rental, or exploring rental arbitrage opportunities, understanding the L'Île-Saint-Denis Airbnb data is crucial. Leveraging the low regulation environment is key to maximizing your short term rental income potential. Let's dive into the specifics.
Key L'Île-Saint-Denis Airbnb Performance Metrics Overview
Monthly Airbnb Revenue Variations & Income Potential in L'Île-Saint-Denis (2025)
Understanding the monthly revenue variations for Airbnb listings in L'Île-Saint-Denis is key to maximizing your short term rental income potential. Seasonality significantly impacts earnings. Our analysis, based on data from the past 12 months, shows that the peak revenue month for STRs in L'Île-Saint-Denis is typically April, while February often presents the lowest earnings, highlighting opportunities for strategic pricing adjustments during shoulder and low seasons. Explore the typical Airbnb income in L'Île-Saint-Denis across different performance tiers:
- Best-in-class properties (Top 10%) achieve $4,446+ monthly, often utilizing dynamic pricing and superior guest experiences.
- Strong performing properties (Top 25%) earn $2,602 or more, indicating effective management and desirable locations/amenities.
- Typical properties (Median) generate around $1,808 per month, representing the average market performance.
- Entry-level properties (Bottom 25%) see earnings around $970, often with potential for optimization.
Average Monthly Airbnb Earnings Trend in L'Île-Saint-Denis
L'Île-Saint-Denis Airbnb Occupancy Rate Trends (2025)
Maximize your bookings by understanding the L'Île-Saint-Denis STR occupancy trends. Seasonal demand shifts significantly influence how often properties are booked. Typically, Aprilsees the highest demand (peak season occupancy), while September experiences the lowest (low season). Effective strategies, like adjusting minimum stays or offering promotions, can boost occupancy during slower periods. Here's how different property tiers perform in L'Île-Saint-Denis:
- Best-in-class properties (Top 10%) achieve 84%+ occupancy, indicating high desirability and potentially optimized availability.
- Strong performing properties (Top 25%) maintain 67% or higher occupancy, suggesting good market fit and guest satisfaction.
- Typical properties (Median) have an occupancy rate around 43%.
- Entry-level properties (Bottom 25%) average 22% occupancy, potentially facing higher vacancy.
Average Monthly Occupancy Rate Trend in L'Île-Saint-Denis
Average Daily Rate (ADR) Airbnb Trends in L'Île-Saint-Denis (2025)
Effective short term rental pricing strategy in L'Île-Saint-Denis involves understanding monthly ADR fluctuations. The Average Daily Rate (ADR) for Airbnb in L'Île-Saint-Denis typically peaks in August and dips lowest during March. Leveraging Airbnb dynamic pricing tools or strategies based on this seasonality can significantly boost revenue. Here's a look at the typical nightly rates achieved:
- Best-in-class properties (Top 10%) command rates of $408+ per night, often due to premium features or locations.
- Strong performing properties (Top 25%) achieve nightly rates of $216 or more.
- Typical properties (Median) charge around $126 per night.
- Entry-level properties (Bottom 25%) earn around $86 per night.
Average Daily Rate (ADR) Trend by Month in L'Île-Saint-Denis
Get Live L'Île-Saint-Denis Market Intelligence 👇

Explore Real-time Analytics
Airbnb Seasonality Analysis & Trends in L'Île-Saint-Denis (2025)
Peak Season (April, June, May)
- Revenue averages $3,230 per month
- Occupancy rates average 53.0%
- Daily rates average $198
Shoulder Season
- Revenue averages $2,077 per month
- Occupancy maintains around 44.3%
- Daily rates hold near $194
Low Season (January, February, November)
- Revenue drops to average $1,476 per month
- Occupancy decreases to average 42.0%
- Daily rates adjust to average $174
Seasonality Insights for L'Île-Saint-Denis
- The Airbnb seasonality in L'Île-Saint-Denis shows highly seasonal trends requiring careful strategy. While the sections above show seasonal averages, it's also insightful to look at the extremes:
- During the high season, the absolute peak month showcases L'Île-Saint-Denis's highest earning potential, with monthly revenues capable of climbing to $3,426, occupancy reaching a high of 59.1%, and ADRs peaking at $215.
- Conversely, the slowest single month of the year, typically falling within the low season, marks the market's lowest point. In this month, revenue might dip to $1,267, occupancy could drop to 39.1%, and ADRs may adjust down to $169.
- Understanding both the seasonal averages and these monthly peaks and troughs in revenue, occupancy, and ADR is crucial for maximizing your Airbnb profit potential in L'Île-Saint-Denis.
Seasonal Strategies for Maximizing Profit
- Peak Season: Maximize revenue through premium pricing and potentially longer minimum stays. Ensure high availability.
- Low Season: Offer competitive pricing, special promotions (e.g., extended stay discounts), and flexible cancellation policies. Target off-season travelers like remote workers or budget-conscious guests.
- Shoulder Seasons: Implement dynamic pricing that balances peak and low rates. Target weekend travelers or specific events. Offer slightly more flexible terms than peak season.
- Regularly analyze your own performance against these L'Île-Saint-Denis seasonality benchmarks and adjust your pricing and availability strategy accordingly.
Best Areas for Airbnb Investment in L'Île-Saint-Denis (2025)
Exploring the top neighborhoods for short-term rentals in L'Île-Saint-Denis? This section highlights key areas, outlining why they are attractive for hosts and guests, along with notable local attractions. Consider these locations based on your target guest profile and investment strategy.
| Neighborhood / Area | Why Host Here? (Target Guests & Appeal) | Key Attractions & Landmarks |
|---|---|---|
| Île-Saint-Denis Center | The heart of Île-Saint-Denis, known for its local markets and accessibility to public transportation. An ideal spot for visitors wanting to experience local culture while remaining close to Paris. | Île-Saint-Denis Market, Stade Pierre-Mauroy, Local cafes, Espace Pierre Cardin |
| Parc de la Villette | A sprawling urban park nearby that attracts visitors for its innovative cultural venues and green spaces. It’s an excellent location for families and young people. | Cité des Sciences et de l'Industrie, Philharmonie de Paris, Parc de la Villette gardens, La Géode, Cité des Enfants |
| Canal de l'Ourcq | A scenic canal that offers beautiful walks and cycling paths. This area is perfect for tourists looking for picturesque views and outdoor activities. | Canal de l'Ourcq promenade, Bassin de la Villette, Open-air cinemas, Boat rentals |
| La Plaine-Saint-Denis | Nearby industrial and cultural hub, known for hosting numerous film and television studios. A growing area attracting creatives and media professionals. | Stade de France, Canal Saint-Martin, Cultural festivals, Shopping centers |
| Stade Pierre-Mauroy | Popular event venue that attracts sports fans and concert-goers. The surrounding area has numerous dining options and is well-connected to public transport. | Stade Pierre-Mauroy stadium, Concert events, Restaurants and bar venues |
| Île de la Jatte | A peaceful island in the Seine that provides a charming getaway from the urban hustle. Ideal for those seeking relaxation and nature close to the city. | Île de la Jatte park, Seine riverside strolls, Local eateries |
| Les Quatre Temps | A major shopping center that draws visitors for shopping and entertainment. This area is bustling with activity and a popular spot for tourists and locals alike. | Les Quatre Temps mall, Cinemas, Restaurants |
| Saint-Ouen Flea Market | Known for its vast antique market, this area attracts bargain hunters and vintage lovers from all over. Unique shopping experiences abound here. | Marché aux Puces de Saint-Ouen, Antique shops, Galleries |
Understanding Airbnb License Requirements & STR Laws in L'Île-Saint-Denis (2025)
While L'Île-Saint-Denis, Ile-de-France, France currently shows low STR regulations, specific Airbnb license requirements might still exist or change. Always verify the latest short term rental regulations and Airbnb license requirements directly with local government authorities for L'Île-Saint-Denis to ensure full compliance before hosting.
(Source: AirROI data, 2025, finding no licensed listings among those analyzed)
Top Performing Airbnb Properties in L'Île-Saint-Denis (2025)
Benchmark your potential! Explore examples of top-performing Airbnb properties in L'Île-Saint-Denisbased on Trailing Twelve Month (TTM) revenue. Analyze their characteristics, revenue, occupancy rate, and ADR to understand what drives success in this market.

Maison Nina Exception Suite 1
Entire Place • 1 bedroom
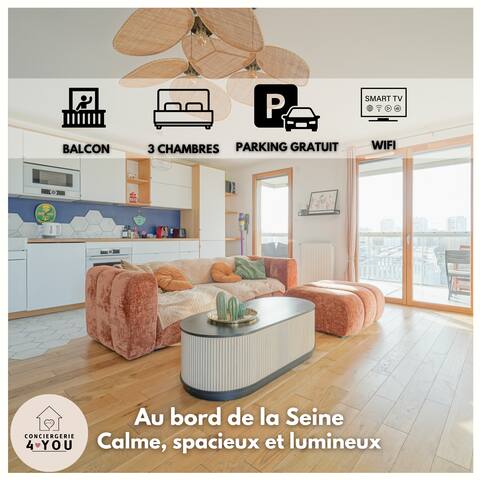
Spacious and peaceful, Seine view, balcony, parking
Entire Place • 3 bedrooms
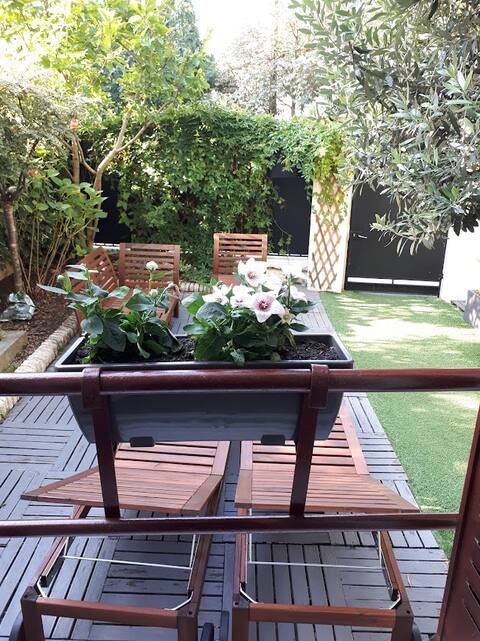
Charming house Ile Saint Denis Residential Calm
Entire Place • 3 bedrooms
Private Parking and Terrace, 10 min from Paris
Entire Place • 1 bedroom

Unusual stay on a houseboat
Entire Place • 5 bedrooms

“Face to face with the Seine” on the outskirts of Paris
Entire Place • 1 bedroom
Note: Performance varies based on location, size, amenities, seasonality, and management quality. Data reflects the past 12 months.
Top Performing Airbnb Hosts in L'Île-Saint-Denis (2025)
Learn from the best! This table showcases top-performing Airbnb hosts in L'Île-Saint-Denis based on the number of properties managed and estimated total revenue over the past year. Analyze their scale and performance metrics.
| Host Name | Properties | Grossing Revenue | Stay Reviews | Avg Rating |
|---|---|---|---|---|
| Maison | 1 | $95,416 | 312 | 4.94/5.0 |
| Camille | 1 | $37,978 | 7 | 4.71/5.0 |
| Aude | 1 | $36,539 | 5 | 4.80/5.0 |
| Julie | 2 | $36,256 | 3 | 2.17/5.0 |
| Clément | 1 | $31,205 | 44 | 4.82/5.0 |
| Jeremy | 1 | $28,536 | 111 | 4.68/5.0 |
| Moha-Erica | 1 | $28,519 | 3 | 5.00/5.0 |
| Host #25810709 | 1 | $26,479 | 0 | 0.00/5.0 |
| Ngeko Freddy | 1 | $26,062 | 64 | 4.69/5.0 |
| Rachid | 1 | $24,830 | 10 | 4.80/5.0 |
Analyzing the strategies of top hosts, such as their property selection, pricing, and guest communication, can offer valuable lessons for optimizing your own Airbnb operations in L'Île-Saint-Denis.
Dive Deeper: Advanced L'Île-Saint-Denis STR Market Data (2025)
Ready to unlock more insights? AirROI provides access to advanced metrics and comprehensive Airbnb data for L'Île-Saint-Denis. Explore detailed analytics beyond this report to refine your investment strategy, optimize pricing, and maximize your vacation rental profits.
Explore Advanced MetricsL'Île-Saint-Denis Short-Term Rental Market Composition (2025): Property & Room Types
Room Type Distribution
Property Type Distribution
Market Composition Insights for L'Île-Saint-Denis
- The L'Île-Saint-Denis Airbnb market composition is heavily skewed towards Entire Home/Apt listings, which make up 94.1% of the 68 active rentals. This indicates strong guest preference for privacy and space.
- Looking at the property type distribution in L'Île-Saint-Denis, Apartment/Condo properties are the most common (82.4%), reflecting the local real estate landscape.
- Smaller segments like hotel/boutique, others, outdoor/unique (combined 4.5%) offer potential for unique stay experiences.
L'Île-Saint-Denis Airbnb Room Capacity Analysis (2025): Bedroom Distribution
Distribution of Listings by Number of Bedrooms
Room Capacity Insights for L'Île-Saint-Denis
- The dominant room capacity in L'Île-Saint-Denis is 1 bedroom listings, making up 52.9% of the market. This suggests a strong demand for properties suitable for couples or solo travelers.
- Together, 1 bedroom and 2 bedrooms properties represent 79.4% of the active Airbnb listings in L'Île-Saint-Denis, indicating a high concentration in these sizes.
- With over half the market (52.9%) consisting of studios or 1-bedroom units, L'Île-Saint-Denis is particularly well-suited for individuals or couples.
- A significant 20.6% of listings offer 3+ bedrooms, catering to larger groups and families seeking more space in L'Île-Saint-Denis.
L'Île-Saint-Denis Vacation Rental Guest Capacity Trends (2025)
Distribution of Listings by Guest Capacity
Guest Capacity Insights for L'Île-Saint-Denis
- The most common guest capacity trend in L'Île-Saint-Denis vacation rentals is listings accommodating 4 guests (45.6%). This suggests the primary traveler segment is likely small families or groups.
- Properties designed for 4 guests and 6 guests dominate the L'Île-Saint-Denis STR market, accounting for 64.7% of listings.
- 25.0% of properties accommodate 6+ guests, serving the market segment for larger families or group travel in L'Île-Saint-Denis.
- On average, properties in L'Île-Saint-Denis are equipped to host 4.1 guests.
L'Île-Saint-Denis Airbnb Booking Patterns (2025): Available vs. Booked Days
Available Days Distribution
Booked Days Distribution
Booking Pattern Insights for L'Île-Saint-Denis
- The most common availability pattern in L'Île-Saint-Denis falls within the 271-366 days range, representing 66.2% of listings. This suggests many properties have significant open periods on their calendars.
- Approximately 85.3% of listings show high availability (181+ days open annually), indicating potential for increased bookings or specific owner usage patterns.
- For booked days, the 31-90 days range is most frequent in L'Île-Saint-Denis (38.2%), reflecting common guest stay durations or potential owner blocking patterns.
- A notable 14.7% of properties secure long booking periods (181+ days booked per year), highlighting successful long-term rental strategies or significant owner usage.
L'Île-Saint-Denis Airbnb Minimum Stay Requirements Analysis
Distribution of Listings by Minimum Night Requirement
1 Night
16 listings
30.2% of total
2 Nights
20 listings
37.7% of total
3 Nights
4 listings
7.5% of total
4-6 Nights
4 listings
7.5% of total
7-29 Nights
3 listings
5.7% of total
30+ Nights
6 listings
11.3% of total
Key Insights
- The most prevalent minimum stay requirement in L'Île-Saint-Denis is 2 Nights, adopted by 37.7% of listings. This highlights the market's preference for shorter, flexible bookings.
- A strong majority (67.9%) of the L'Île-Saint-Denis Airbnb data shows acceptance of very short stays (1-2 nights), indicating a dynamic, high-turnover market.
- A significant segment (11.3%) caters to monthly stays (30+ nights) in L'Île-Saint-Denis, pointing to opportunities in the extended-stay market.
Recommendations
- Align with the market by considering a 2 Nights minimum stay, as 37.7% of L'Île-Saint-Denis hosts use this setting.
- Explore offering discounts for stays of 30+ nights to attract the 11.3% of the market seeking extended stays.
- Adjust minimum nights based on seasonality – potentially shorter during low season and longer during peak demand periods in L'Île-Saint-Denis.
L'Île-Saint-Denis Airbnb Cancellation Policy Trends Analysis (2025)
Flexible
7 listings
22.6% of total
Moderate
11 listings
35.5% of total
Firm
6 listings
19.4% of total
Strict
7 listings
22.6% of total
Cancellation Policy Insights for L'Île-Saint-Denis
- The prevailing Airbnb cancellation policy trend in L'Île-Saint-Denis is Moderate, used by 35.5% of listings.
- There's a relatively balanced mix between guest-friendly (58.1%) and stricter (42.0%) policies, offering choices for different guest needs.
Recommendations for Hosts
- Consider adopting a Moderate policy to align with the 35.5% market standard in L'Île-Saint-Denis.
- Regularly review your cancellation policy against competitors and market demand shifts in L'Île-Saint-Denis.
L'Île-Saint-Denis STR Booking Lead Time Analysis (2025)
Average Booking Lead Time by Month
Booking Lead Time Insights for L'Île-Saint-Denis
- The overall average booking lead time for vacation rentals in L'Île-Saint-Denis is 29 days.
- Guests book furthest in advance for stays during July (average 117 days), likely coinciding with peak travel demand or local events.
- The shortest booking windows occur for stays in March (average 18 days), indicating more last-minute travel plans during this time.
- Seasonally, Summer (82 days avg.) sees the longest lead times, while Winter (23 days avg.) has the shortest, reflecting typical travel planning cycles.
Recommendations for Hosts
- Use the overall average lead time (29 days) as a baseline for your pricing and availability strategy in L'Île-Saint-Denis.
- For July stays, consider implementing length-of-stay discounts or slightly higher rates for bookings made less than 117 days out to capitalize on advance planning.
- Target marketing efforts for the Summer season well in advance (at least 82 days) to capture early planners.
- Monitor your own booking lead times against these L'Île-Saint-Denis averages to identify opportunities for dynamic pricing adjustments.
Popular & Essential Airbnb Amenities in L'Île-Saint-Denis (2025)
Amenity Prevalence
Amenity Insights for L'Île-Saint-Denis
- Essential amenities in L'Île-Saint-Denis that guests expect include: Kitchen, Wifi, Heating, Smoke alarm, Hot water. Lacking these (any) could significantly impact bookings.
- Popular amenities like Essentials, TV, Washer are common but not universal. Offering these can provide a competitive edge.
Recommendations for Hosts
- Ensure your listing includes all essential amenities for L'Île-Saint-Denis: Kitchen, Wifi, Heating, Smoke alarm, Hot water.
- Prioritize adding missing essentials: Wifi, Heating, Smoke alarm, Hot water.
- Consider adding popular differentiators like Essentials or TV to increase appeal.
- Highlight unique or less common amenities you offer (e.g., hot tub, dedicated workspace, EV charger) in your listing description and photos.
- Regularly check competitor amenities in L'Île-Saint-Denis to stay competitive.
L'Île-Saint-Denis Airbnb Guest Demographics & Profile Analysis (2025)
Guest Profile Summary for L'Île-Saint-Denis
- The typical guest profile for Airbnb in L'Île-Saint-Denis consists of a mix of domestic (53%) and international guests, often arriving from nearby Paris, typically belonging to the Post-2000s (Gen Z/Alpha) group (50%), primarily speaking English or French.
- Domestic travelers account for 52.6% of guests.
- Key international markets include France (52.6%) and United Kingdom (7.2%).
- Top languages spoken are English (33.8%) followed by French (26.9%).
- A significant demographic segment is the Post-2000s (Gen Z/Alpha) group, representing 50% of guests.
Recommendations for Hosts
- Balance marketing efforts between domestic and international channels based on the guest mix.
- Tailor amenities and listing descriptions to appeal to the dominant Post-2000s (Gen Z/Alpha) demographic (e.g., highlight fast WiFi, smart home features, local guides).
- Highlight unique local experiences or amenities relevant to the primary guest profile.
- Consider seasonal promotions aligned with peak travel times for key origin markets.
Nearby Short-Term Rental Market Comparison
How does the L'Île-Saint-Denis Airbnb market stack up against its neighbors? Compare key performance metrics like average monthly revenue, ADR, and occupancy rates in surrounding areas to understand the broader regional STR landscape.
| Market | Active Properties | Monthly Revenue | Daily Rate | Avg. Occupancy |
|---|---|---|---|---|
| Morienval | 10 | $5,794 | $400.84 | 32% |
| Verdelot | 13 | $3,885 | $300.79 | 46% |
| Trigny | 10 | $3,775 | $248.19 | 46% |
| La Couture-Boussey | 12 | $3,620 | $378.08 | 28% |
| Dourdan | 15 | $3,576 | $223.06 | 52% |
| Rosoy-en-Multien | 15 | $3,558 | $367.61 | 51% |
| Millançay | 11 | $3,476 | $370.42 | 39% |
| Chaintreaux | 11 | $3,136 | $278.28 | 34% |
| Langon-sur-Cher | 12 | $3,127 | $400.27 | 35% |
| Mesnils-sur-Iton | 22 | $3,028 | $309.05 | 40% |